Development of 3D neuromuscular bioactuators
- PMID: 32161837
- PMCID: PMC7064368
- DOI: 10.1063/1.5134477
Development of 3D neuromuscular bioactuators
Abstract
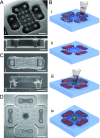
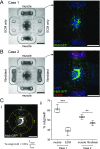
Neuronal control of skeletal muscle bioactuators represents a critical milestone toward the realization of future biohybrid machines that may generate complex motor patterns and autonomously navigate through their environment. Animals achieve these feats using neural networks that generate robust firing patterns and coordinate muscle activity through neuromuscular units. Here, we designed a versatile 3D neuron-muscle co-culture platform to serve as a test-bed for neuromuscular bioactuators. We used our platform in conjunction with microelectrode array electrophysiology to study the roles of synergistic interactions in the co-development of neural networks and muscle tissues. Our platform design enables co-culture of a neuronal cluster with up to four target muscle actuators, as well as quantification of muscle contraction forces. Using engineered muscle tissue targets, we first demonstrated the formation of functional neuromuscular bioactuators. We then investigated possible roles of long-range interactions in neuronal outgrowth patterns and observed preferential outgrowth toward muscles compared to the acellular matrix or fibroblasts, indicating muscle-specific chemotactic cues acting on motor neurons. Next, we showed that co-cultured muscle strips exhibited significantly higher spontaneous contractility as well as improved sarcomere assembly compared to muscles cultured alone. Finally, we performed microelectrode array measurements on neuronal cultures, which revealed that muscle-conditioned medium enhances overall neural firing rates and the emergence of synchronous bursting patterns. Overall, our study illustrates the significance of neuron-muscle cross talk for the in vitro development of neuromuscular bioactuators.
© Author(s).
Figures


Similar articles
-
Neuromuscular actuation of biohybrid motile bots.Proc Natl Acad Sci U S A. 2019 Oct 1;116(40):19841-19847. doi: 10.1073/pnas.1907051116. Epub 2019 Sep 16. Proc Natl Acad Sci U S A. 2019. PMID: 31527266 Free PMC article.
-
The neuromuscular transform: the dynamic, nonlinear link between motor neuron firing patterns and muscle contraction in rhythmic behaviors.J Neurophysiol. 2000 Jan;83(1):207-31. doi: 10.1152/jn.2000.83.1.207. J Neurophysiol. 2000. PMID: 10634868
-
Contraction Control of Aligned Myofiber Sheet Tissue by Parallel Oriented Induced Pluripotent Stem Cell-Derived Neurons.Tissue Eng Part A. 2022 Aug;28(15-16):661-671. doi: 10.1089/ten.TEA.2021.0202. Epub 2022 Mar 30. Tissue Eng Part A. 2022. PMID: 35057641
-
Advances in In Vitro Models of Neuromuscular Junction: Focusing on Organ-on-a-Chip, Organoids, and Biohybrid Robotics.Adv Mater. 2023 Oct;35(41):e2211059. doi: 10.1002/adma.202211059. Epub 2023 Jul 30. Adv Mater. 2023. PMID: 36934404 Review.
-
Metamorphosis in Insect Muscle: Insights for Engineering Muscle-Based Actuators.Tissue Eng Part B Rev. 2021 Aug;27(4):330-340. doi: 10.1089/ten.TEB.2020.0204. Epub 2020 Nov 4. Tissue Eng Part B Rev. 2021. PMID: 33012237 Review.
Cited by
-
Current Progress in the Creation, Characterization, and Application of Human Stem Cell-derived in Vitro Neuromuscular Junction Models.Stem Cell Rev Rep. 2022 Feb;18(2):768-780. doi: 10.1007/s12015-021-10201-2. Epub 2021 Jul 1. Stem Cell Rev Rep. 2022. PMID: 34212303 Free PMC article. Review.
-
Tensile Forces and Nanofiber Alignment Influence Both Innervated and Non-Innervated Skeletal Myofiber Formation in Custom Mechanobioreactors.Biotechnol J. 2025 Jun;20(6):e70047. doi: 10.1002/biot.70047. Biotechnol J. 2025. PMID: 40491005 Free PMC article.
-
Bioengineered model of the human motor unit with physiologically functional neuromuscular junctions.Sci Rep. 2021 Jun 3;11(1):11695. doi: 10.1038/s41598-021-91203-5. Sci Rep. 2021. PMID: 34083648 Free PMC article.
-
Astrocyte-mediated Transduction of Muscle Fiber Contractions Synchronizes Hippocampal Neuronal Network Development.Neuroscience. 2023 Apr 1;515:25-36. doi: 10.1016/j.neuroscience.2023.01.028. Epub 2023 Feb 2. Neuroscience. 2023. PMID: 36736611 Free PMC article.
-
Development of an objective index, neural activity score (NAS), reveals neural network ontogeny and treatment effects on microelectrode arrays.Sci Rep. 2021 Apr 27;11(1):9110. doi: 10.1038/s41598-021-88675-w. Sci Rep. 2021. PMID: 33907294 Free PMC article.
References
LinkOut - more resources
Full Text Sources

