. 2020 May 15;126(10):2250-2266.
doi: 10.1002/cncr.32801. Epub 2020 Mar 12.

Annual report to the nation on the status of cancer, part II: Progress toward Healthy People 2020 objectives for 4 common cancers

Affiliations

Annual report to the nation on the status of cancer, part II: Progress toward Healthy People 2020 objectives for 4 common cancers

S Jane Henley et al. Cancer. .

Abstract

Background: The Centers for Disease Control and Prevention, the American Cancer Society, the National Cancer Institute, and the North American Association of Central Cancer Registries collaborate to provide annual updates on cancer occurrence and trends in the United States and to address a special topic of interest. Part I of this report focuses on national cancer statistics, and part 2 characterizes progress in achieving select Healthy People 2020 cancer objectives.

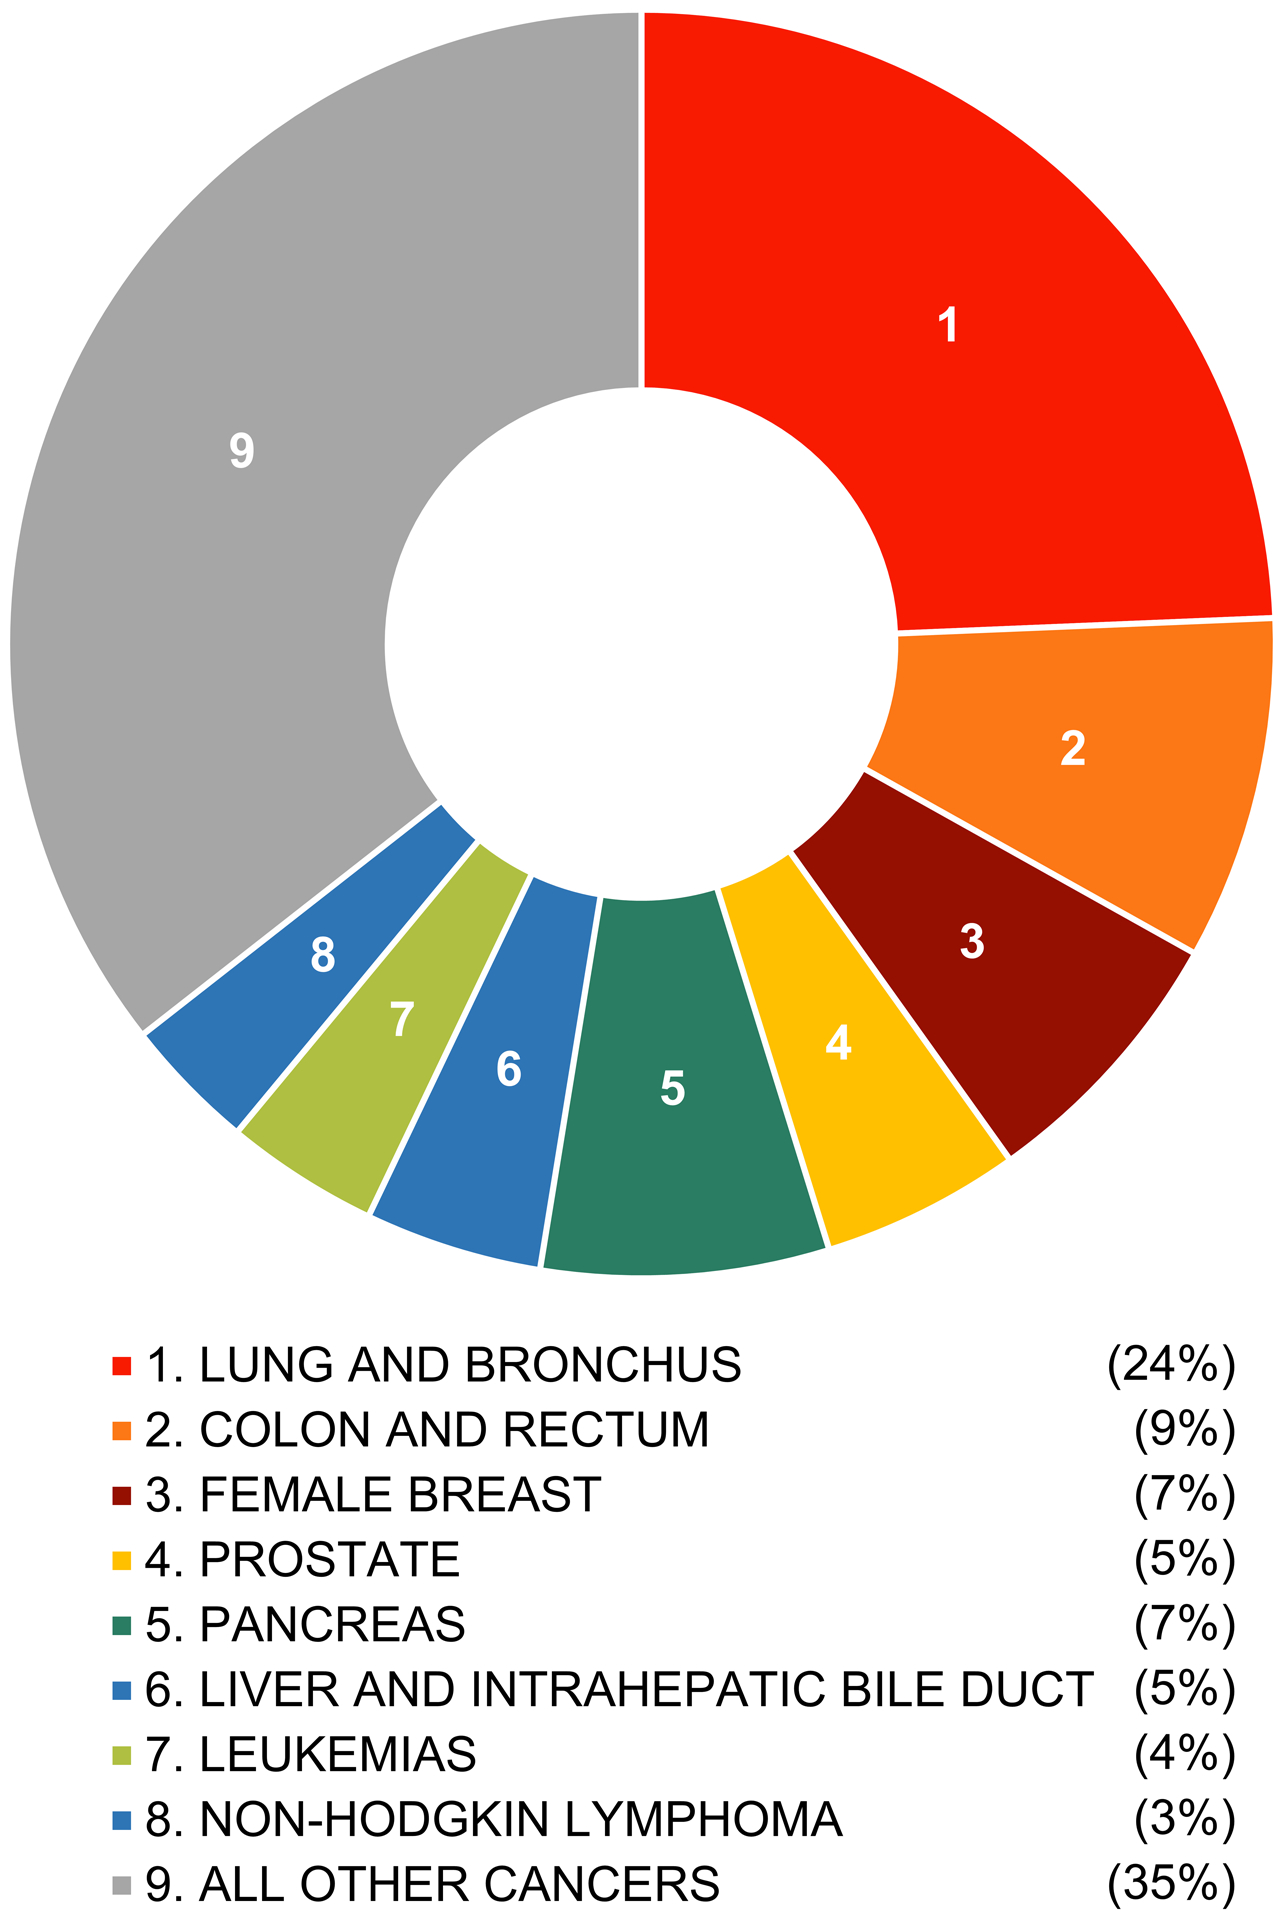
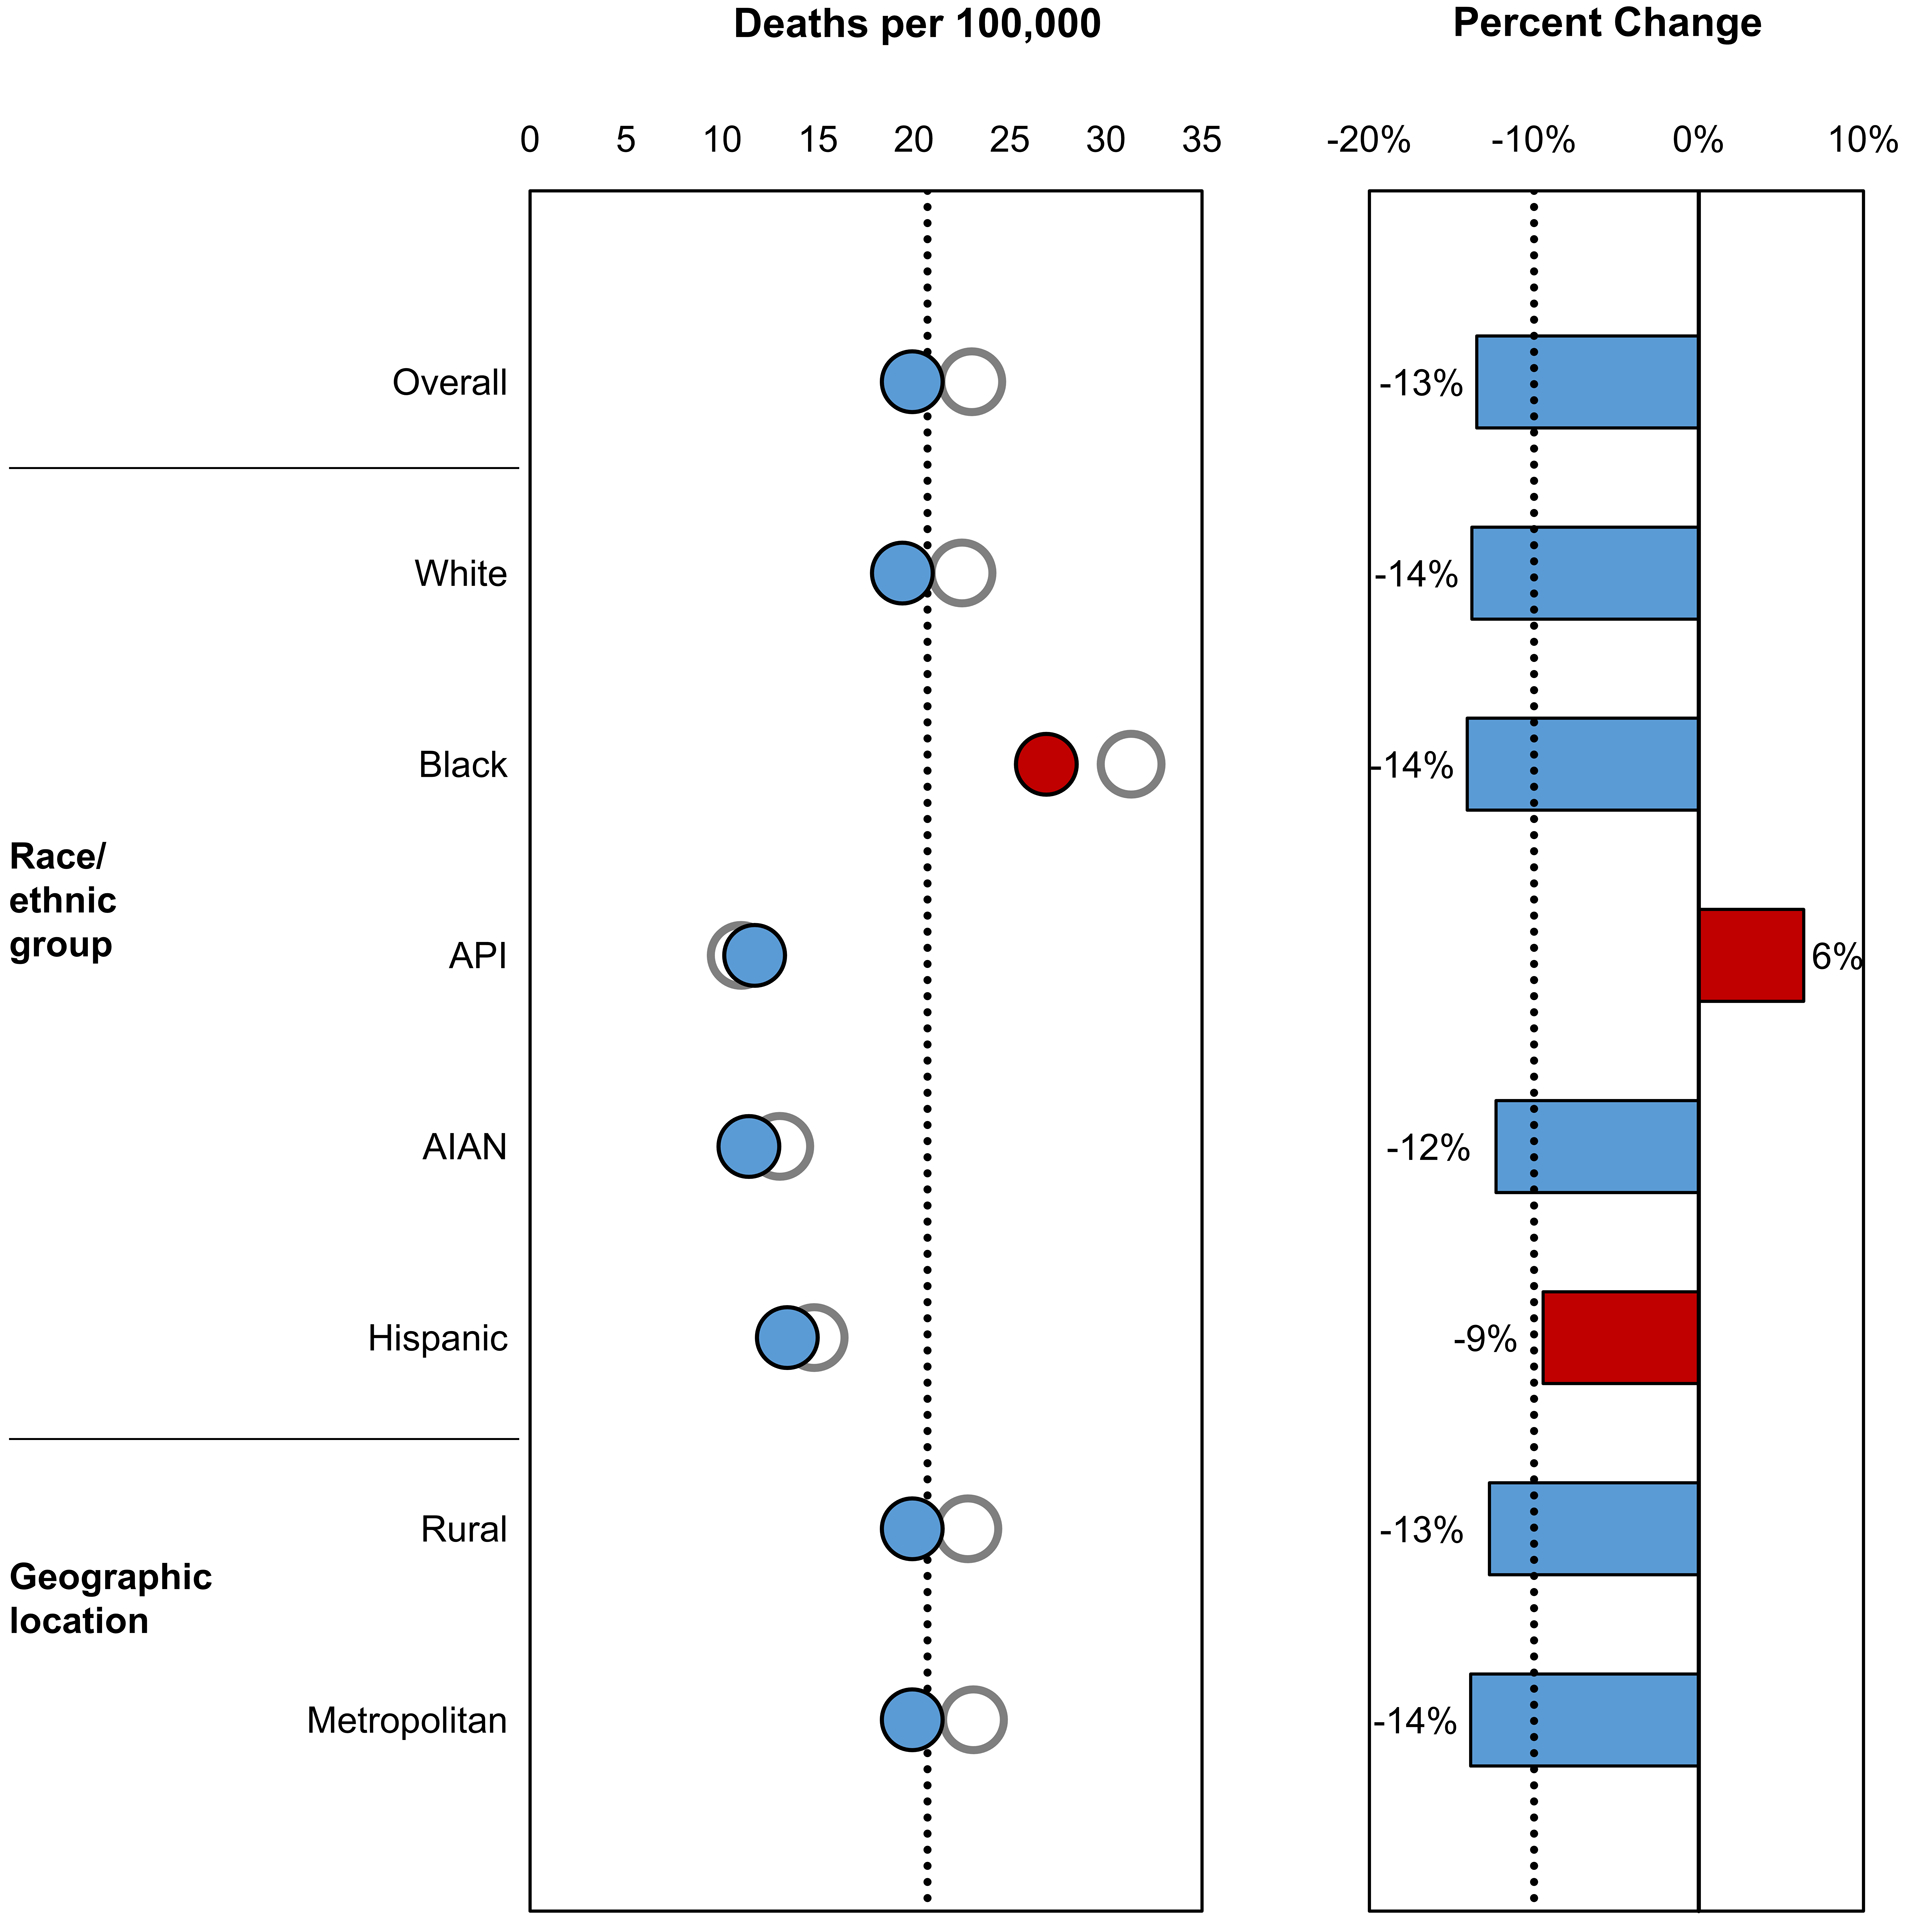
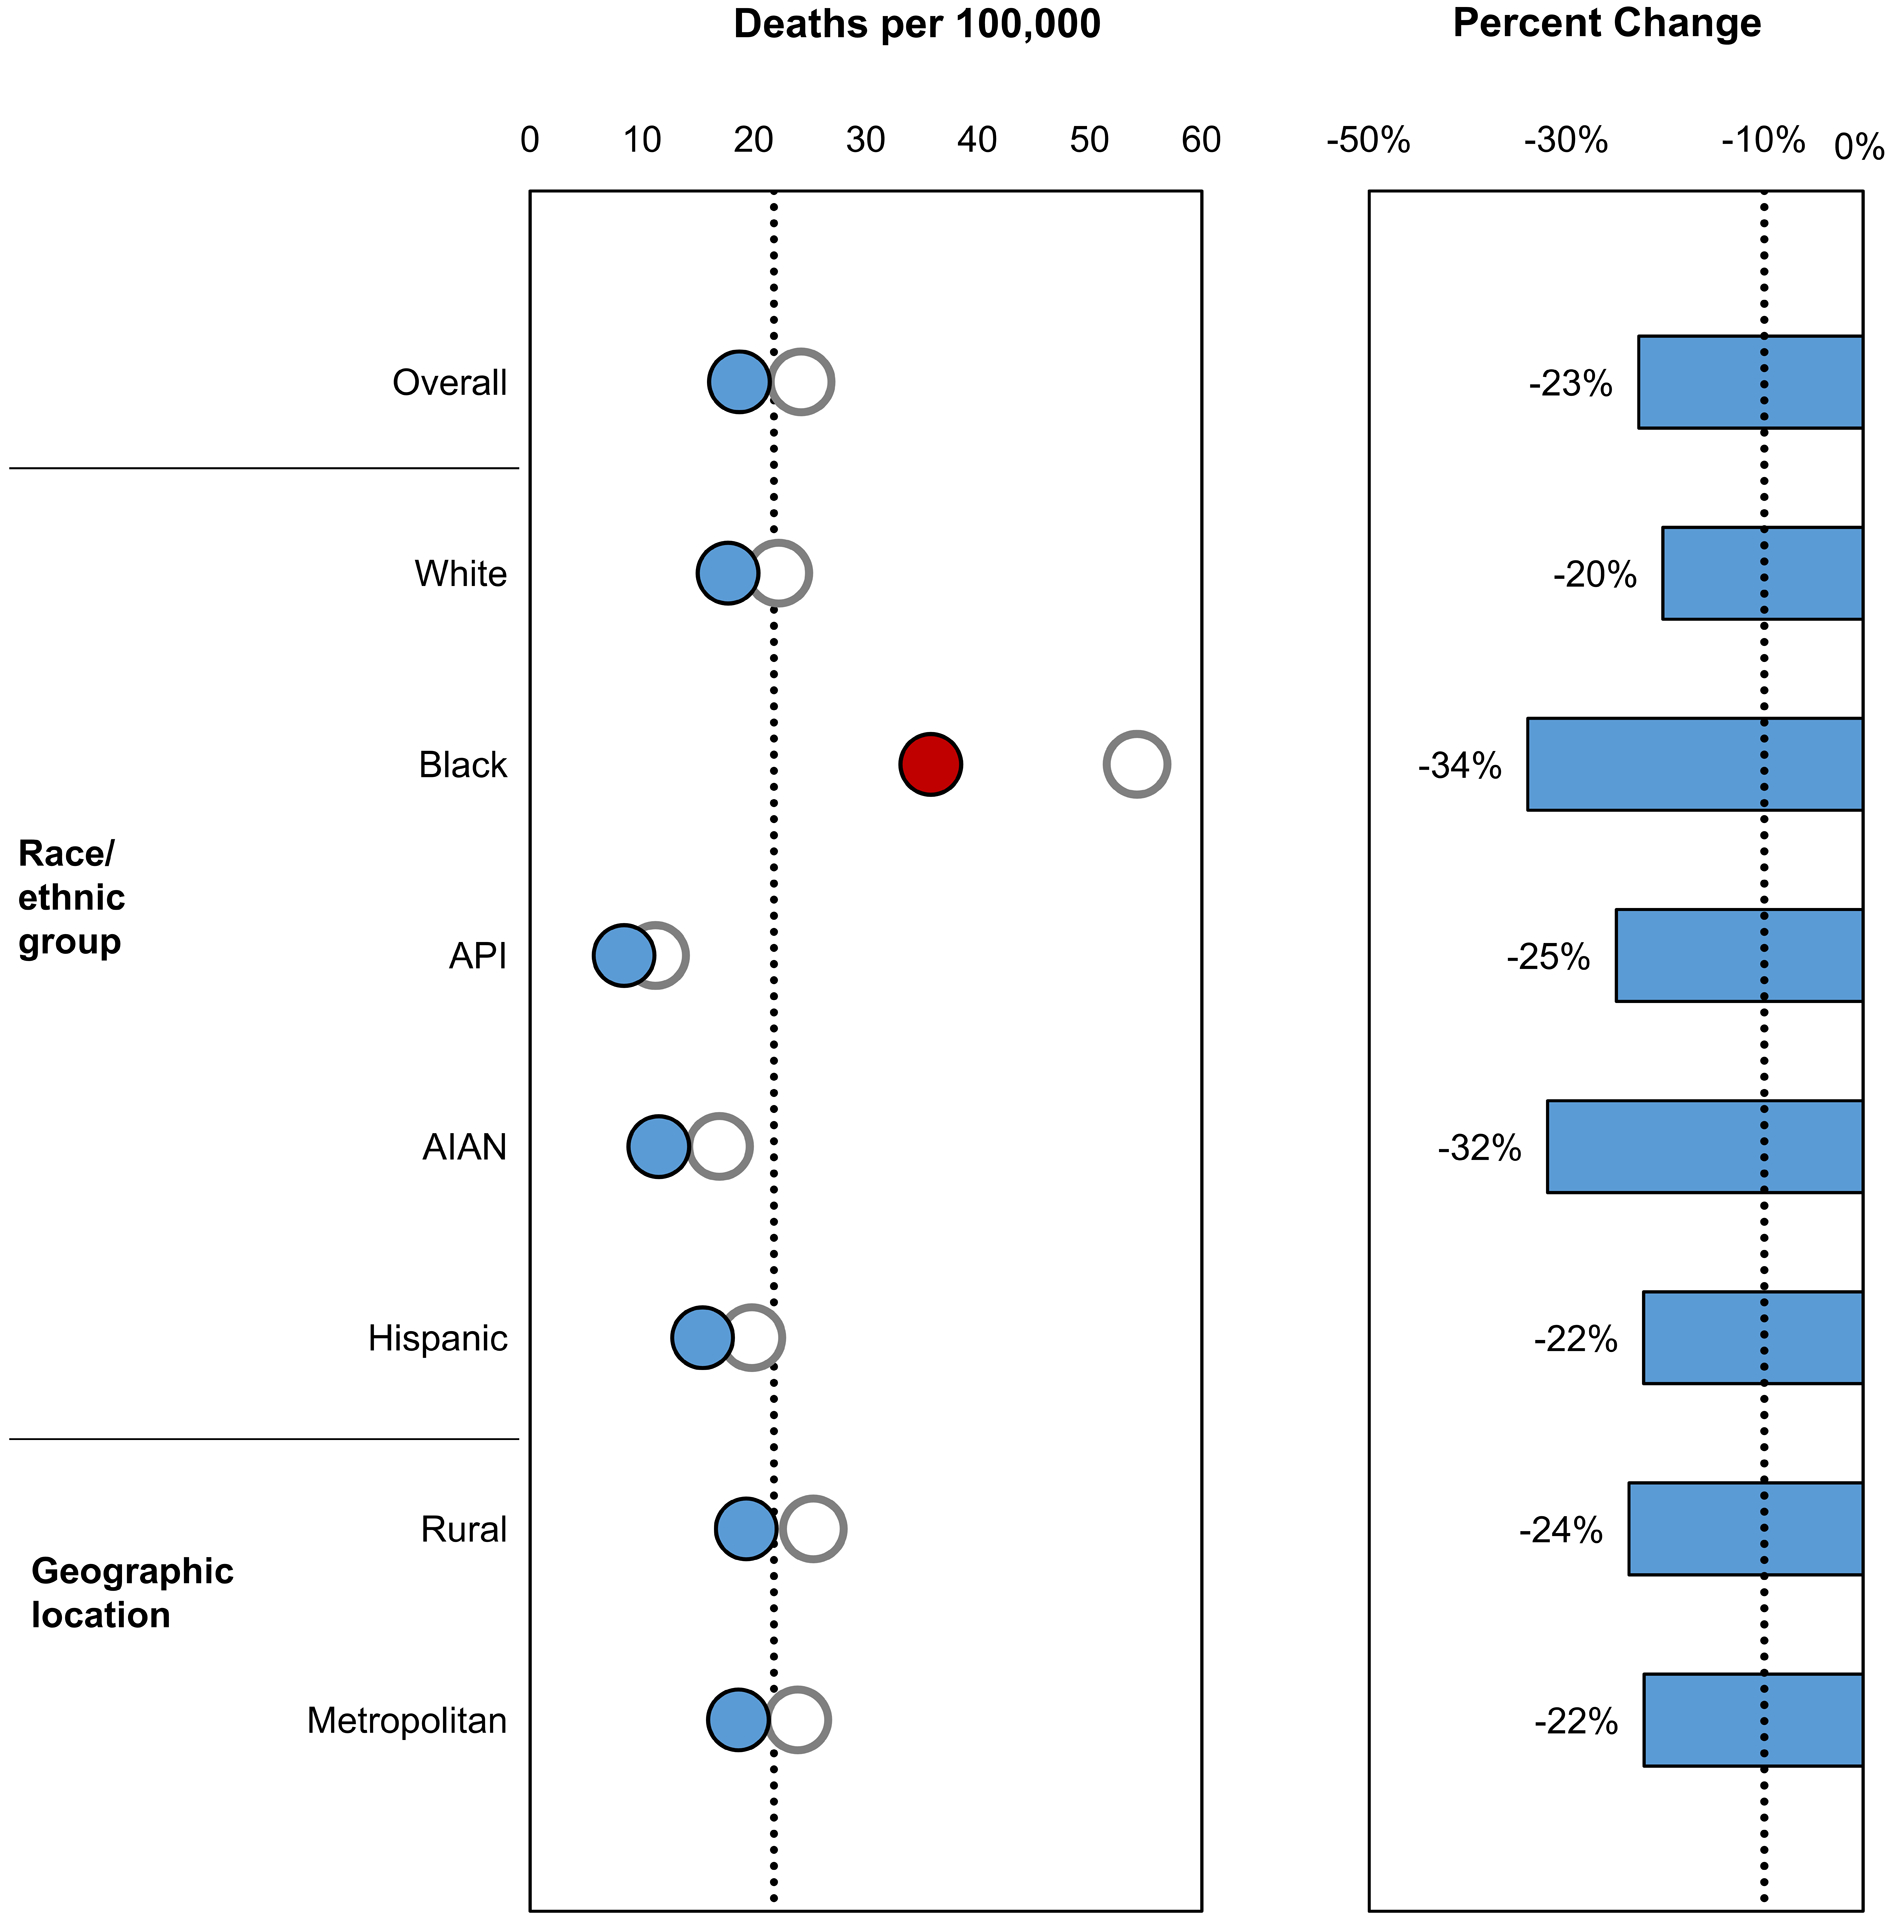
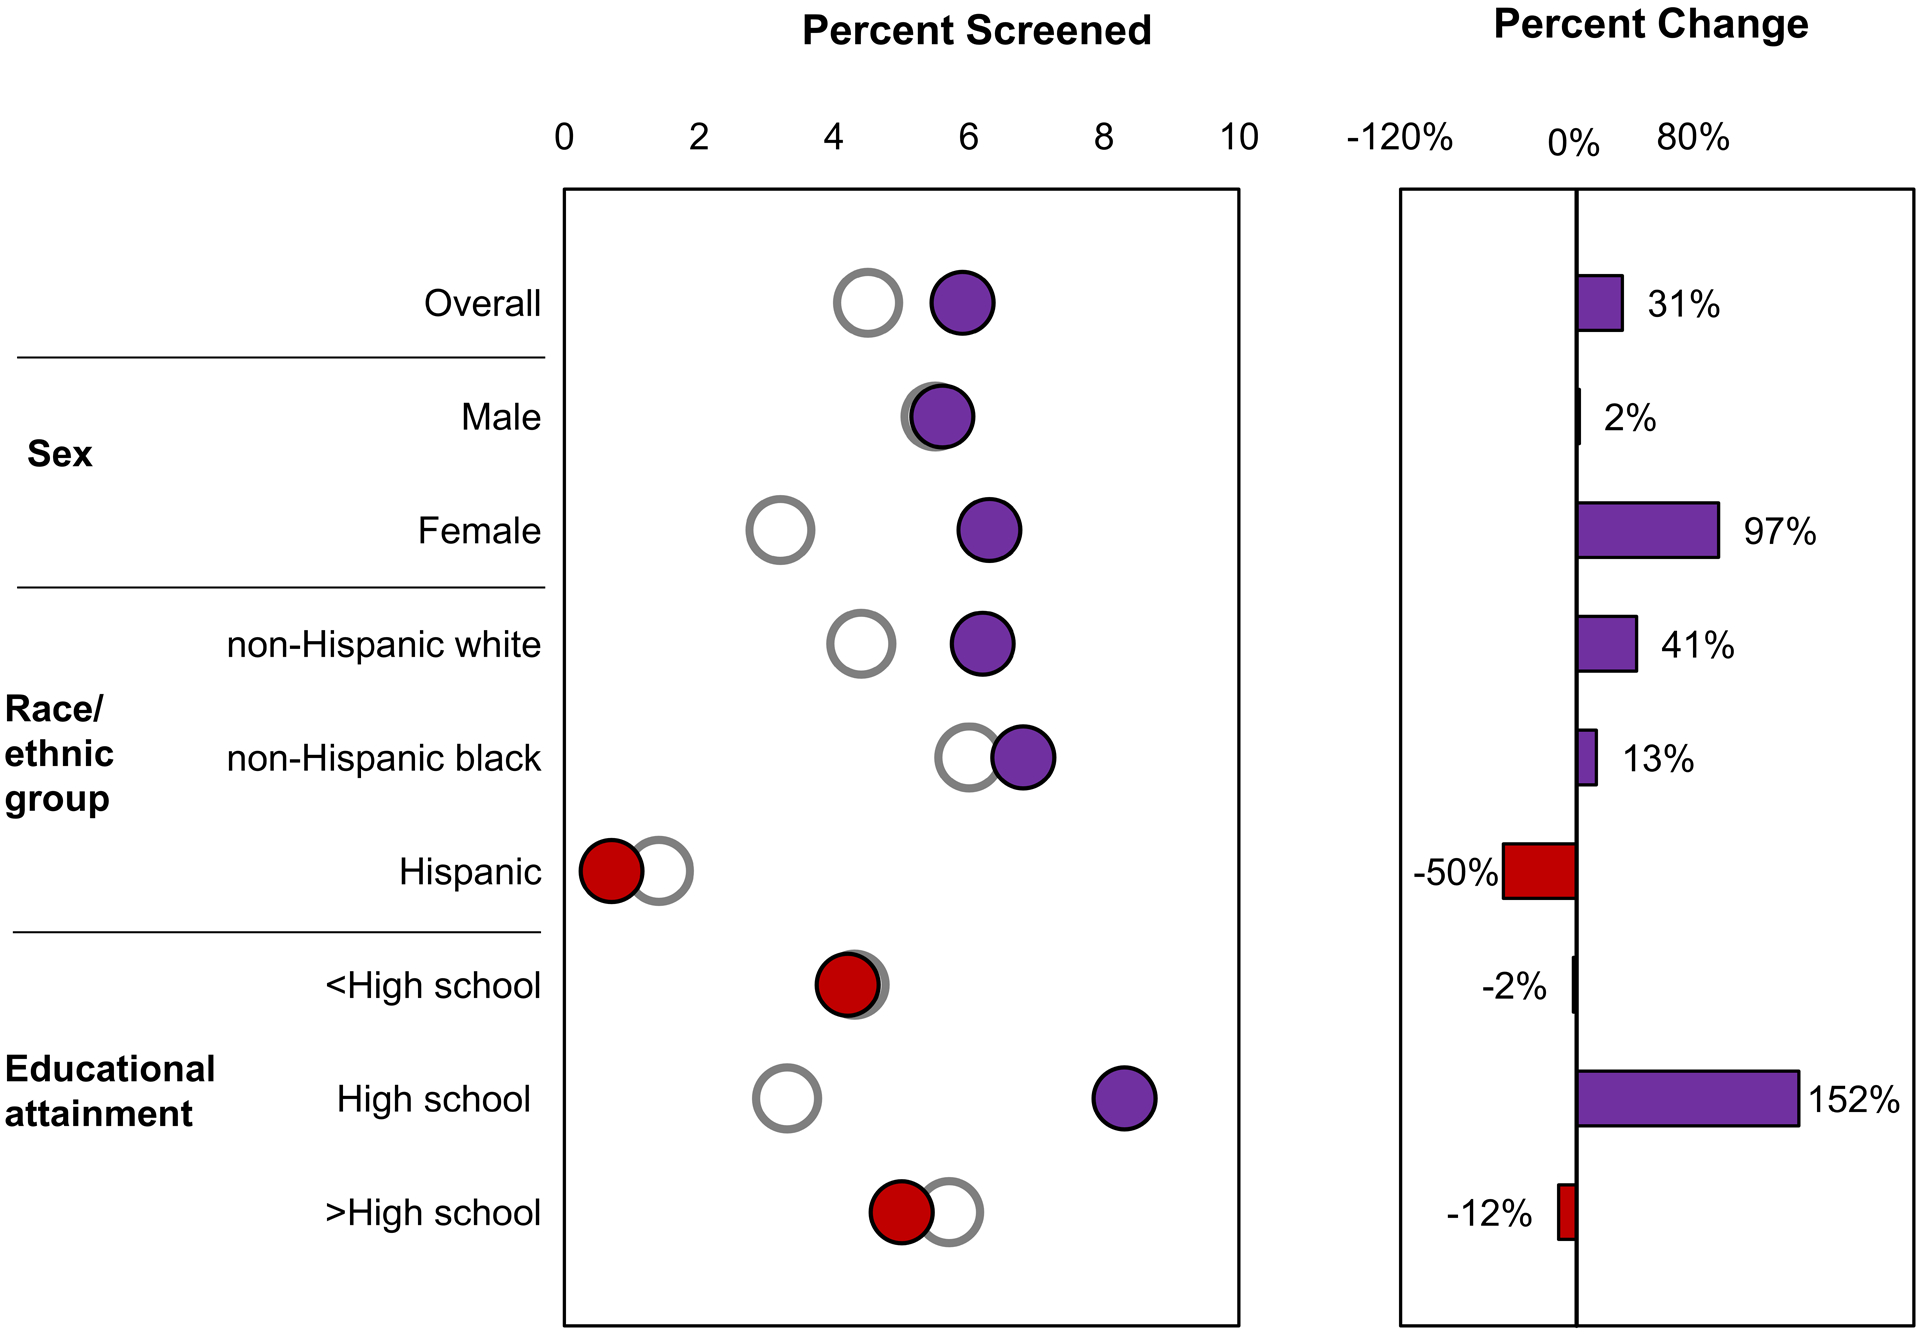
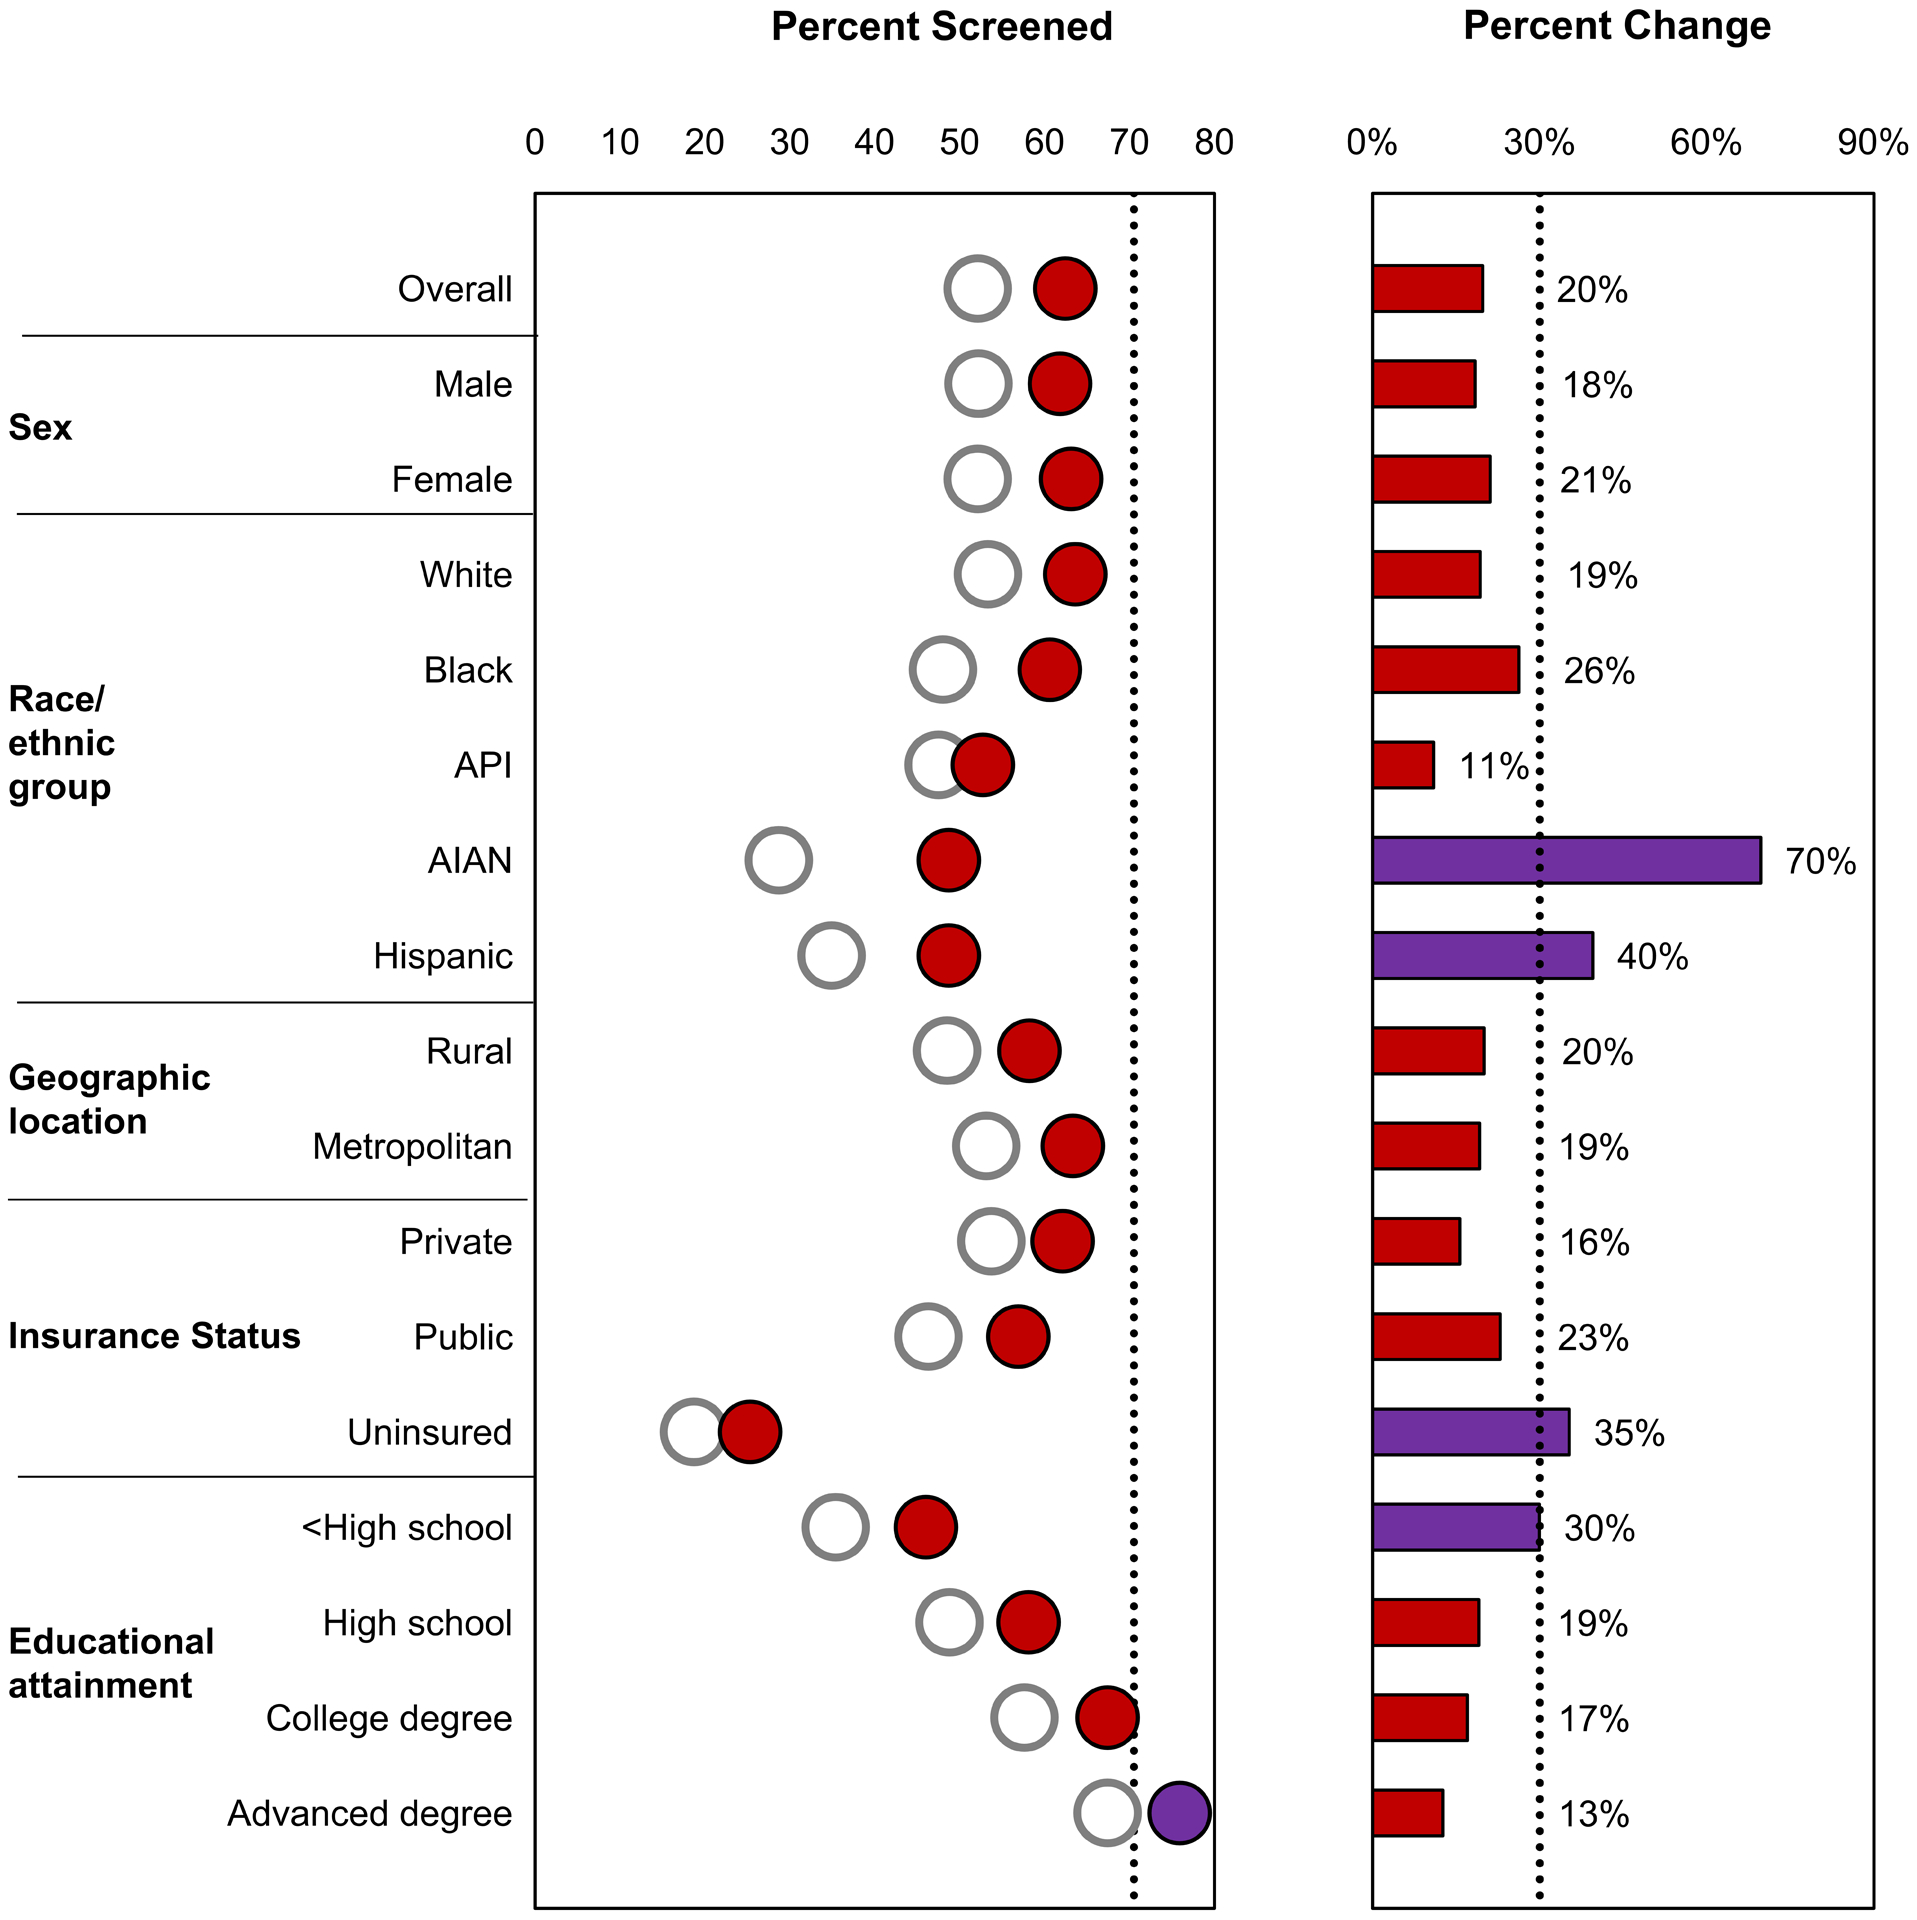
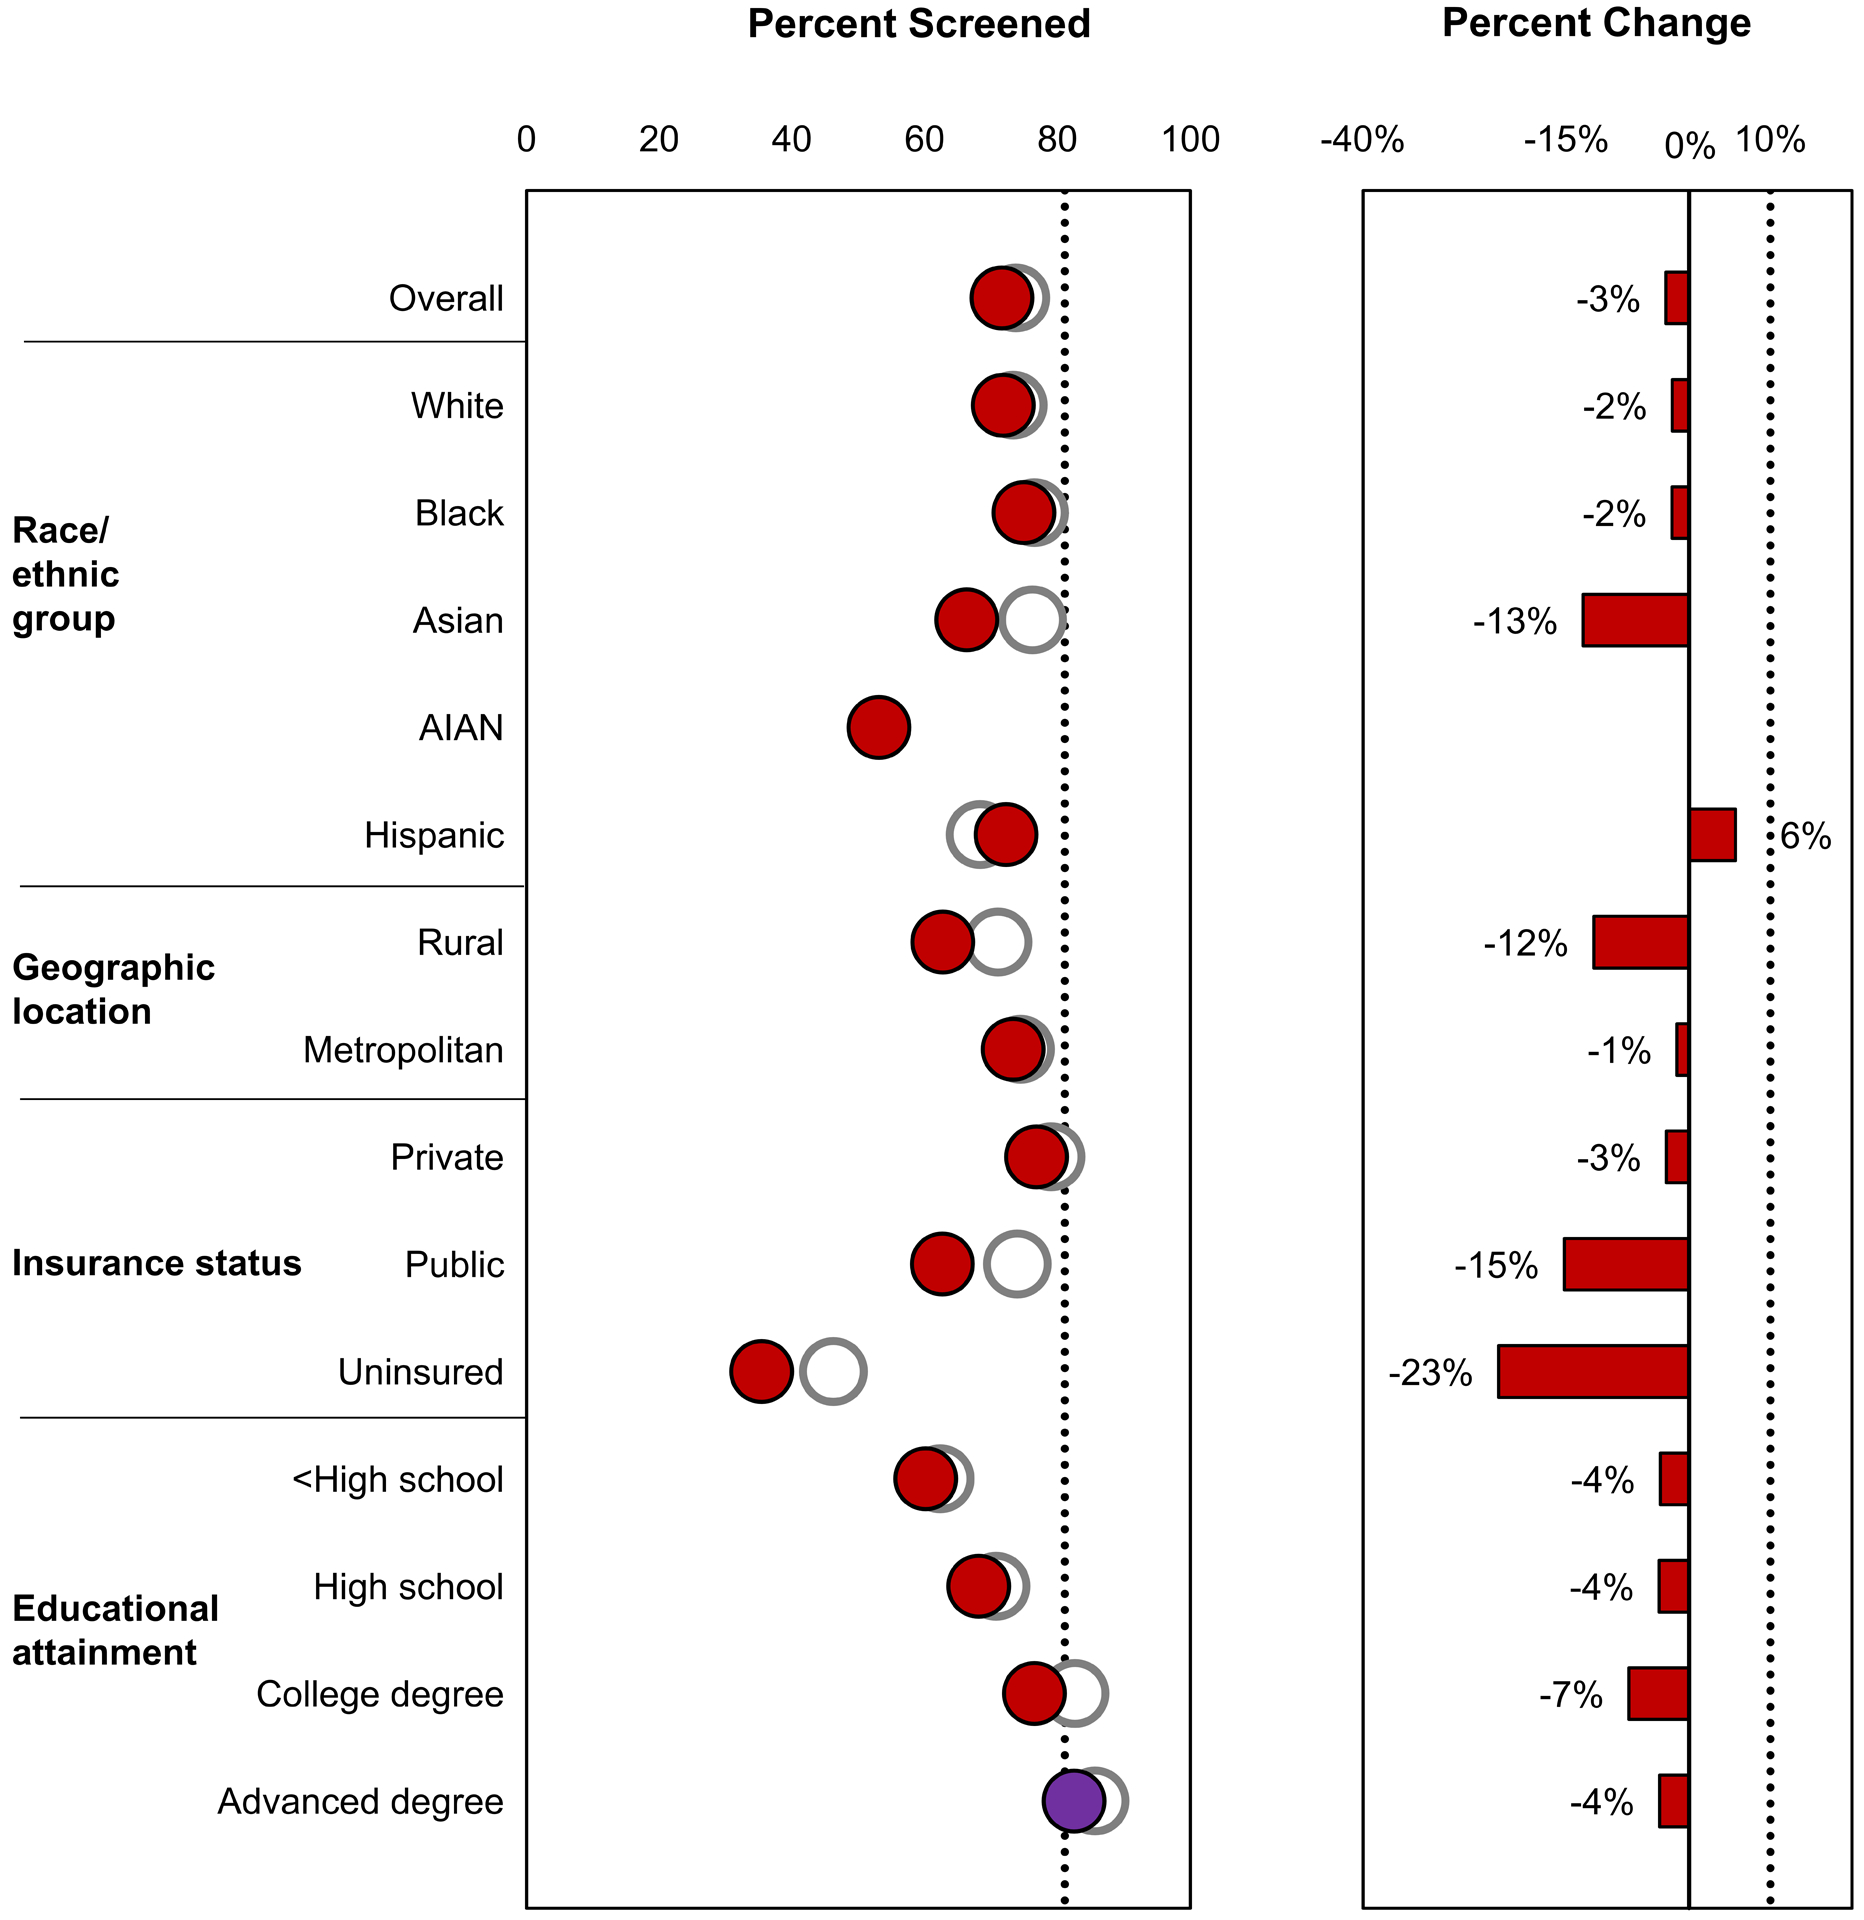
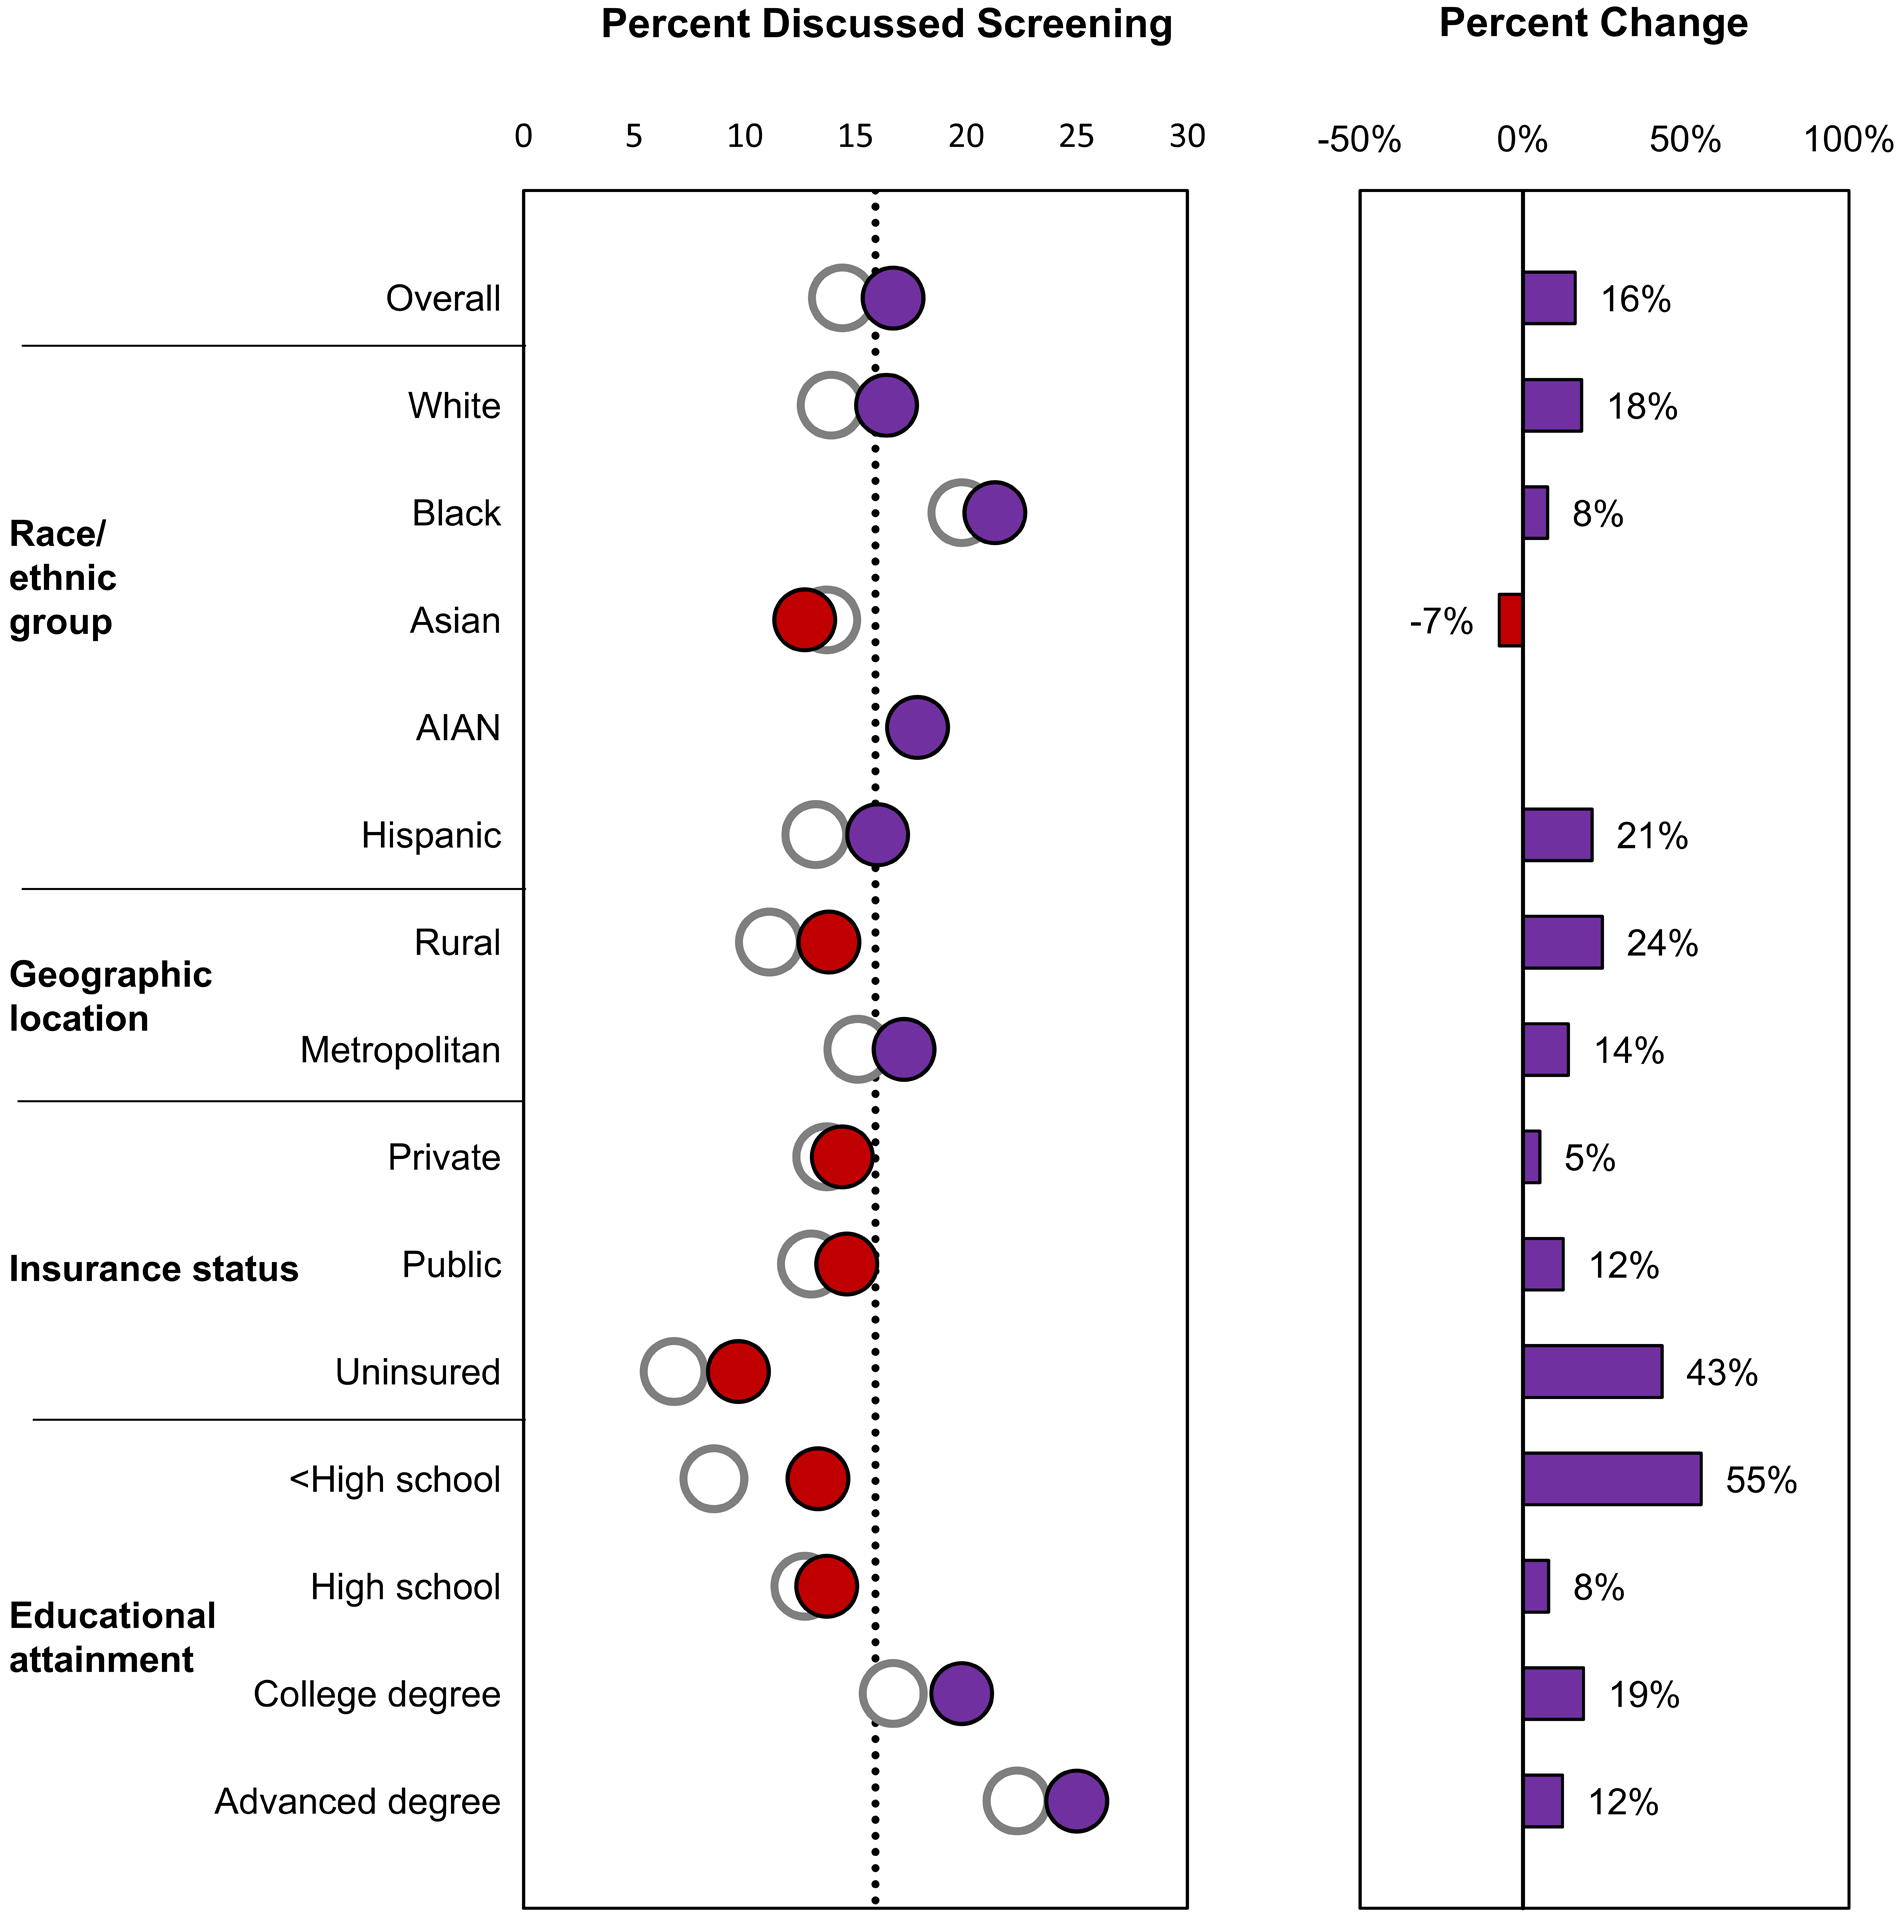
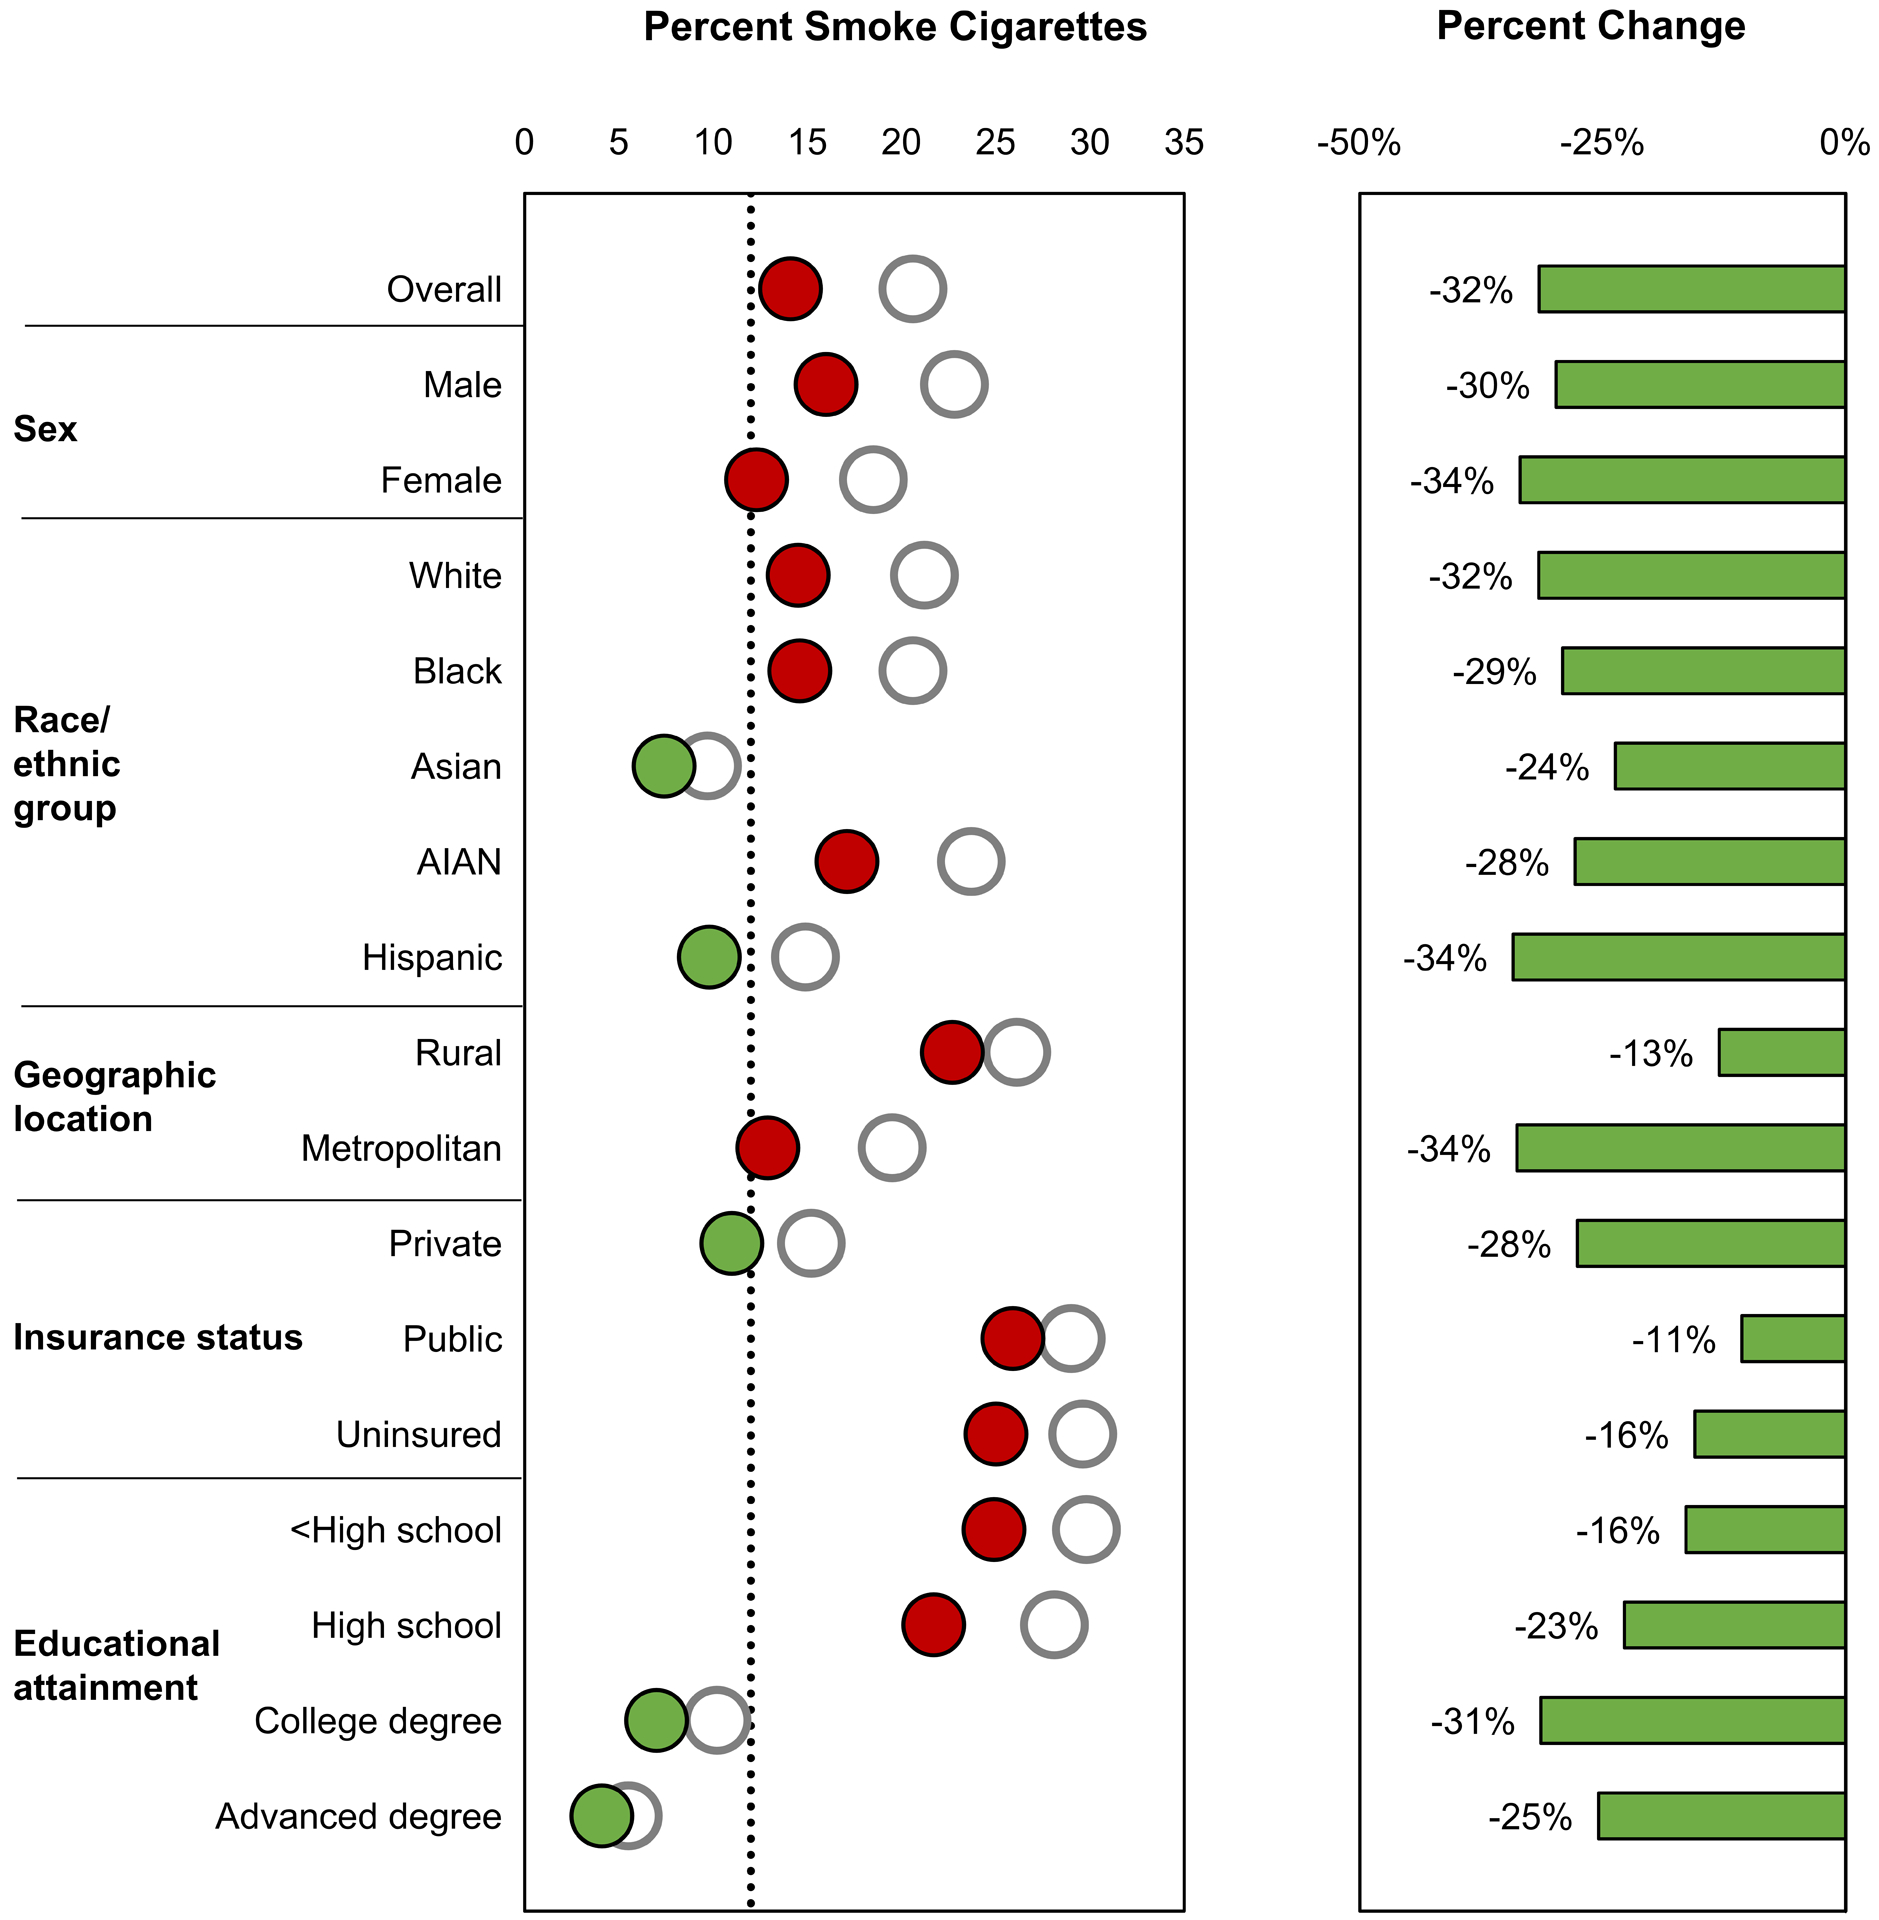
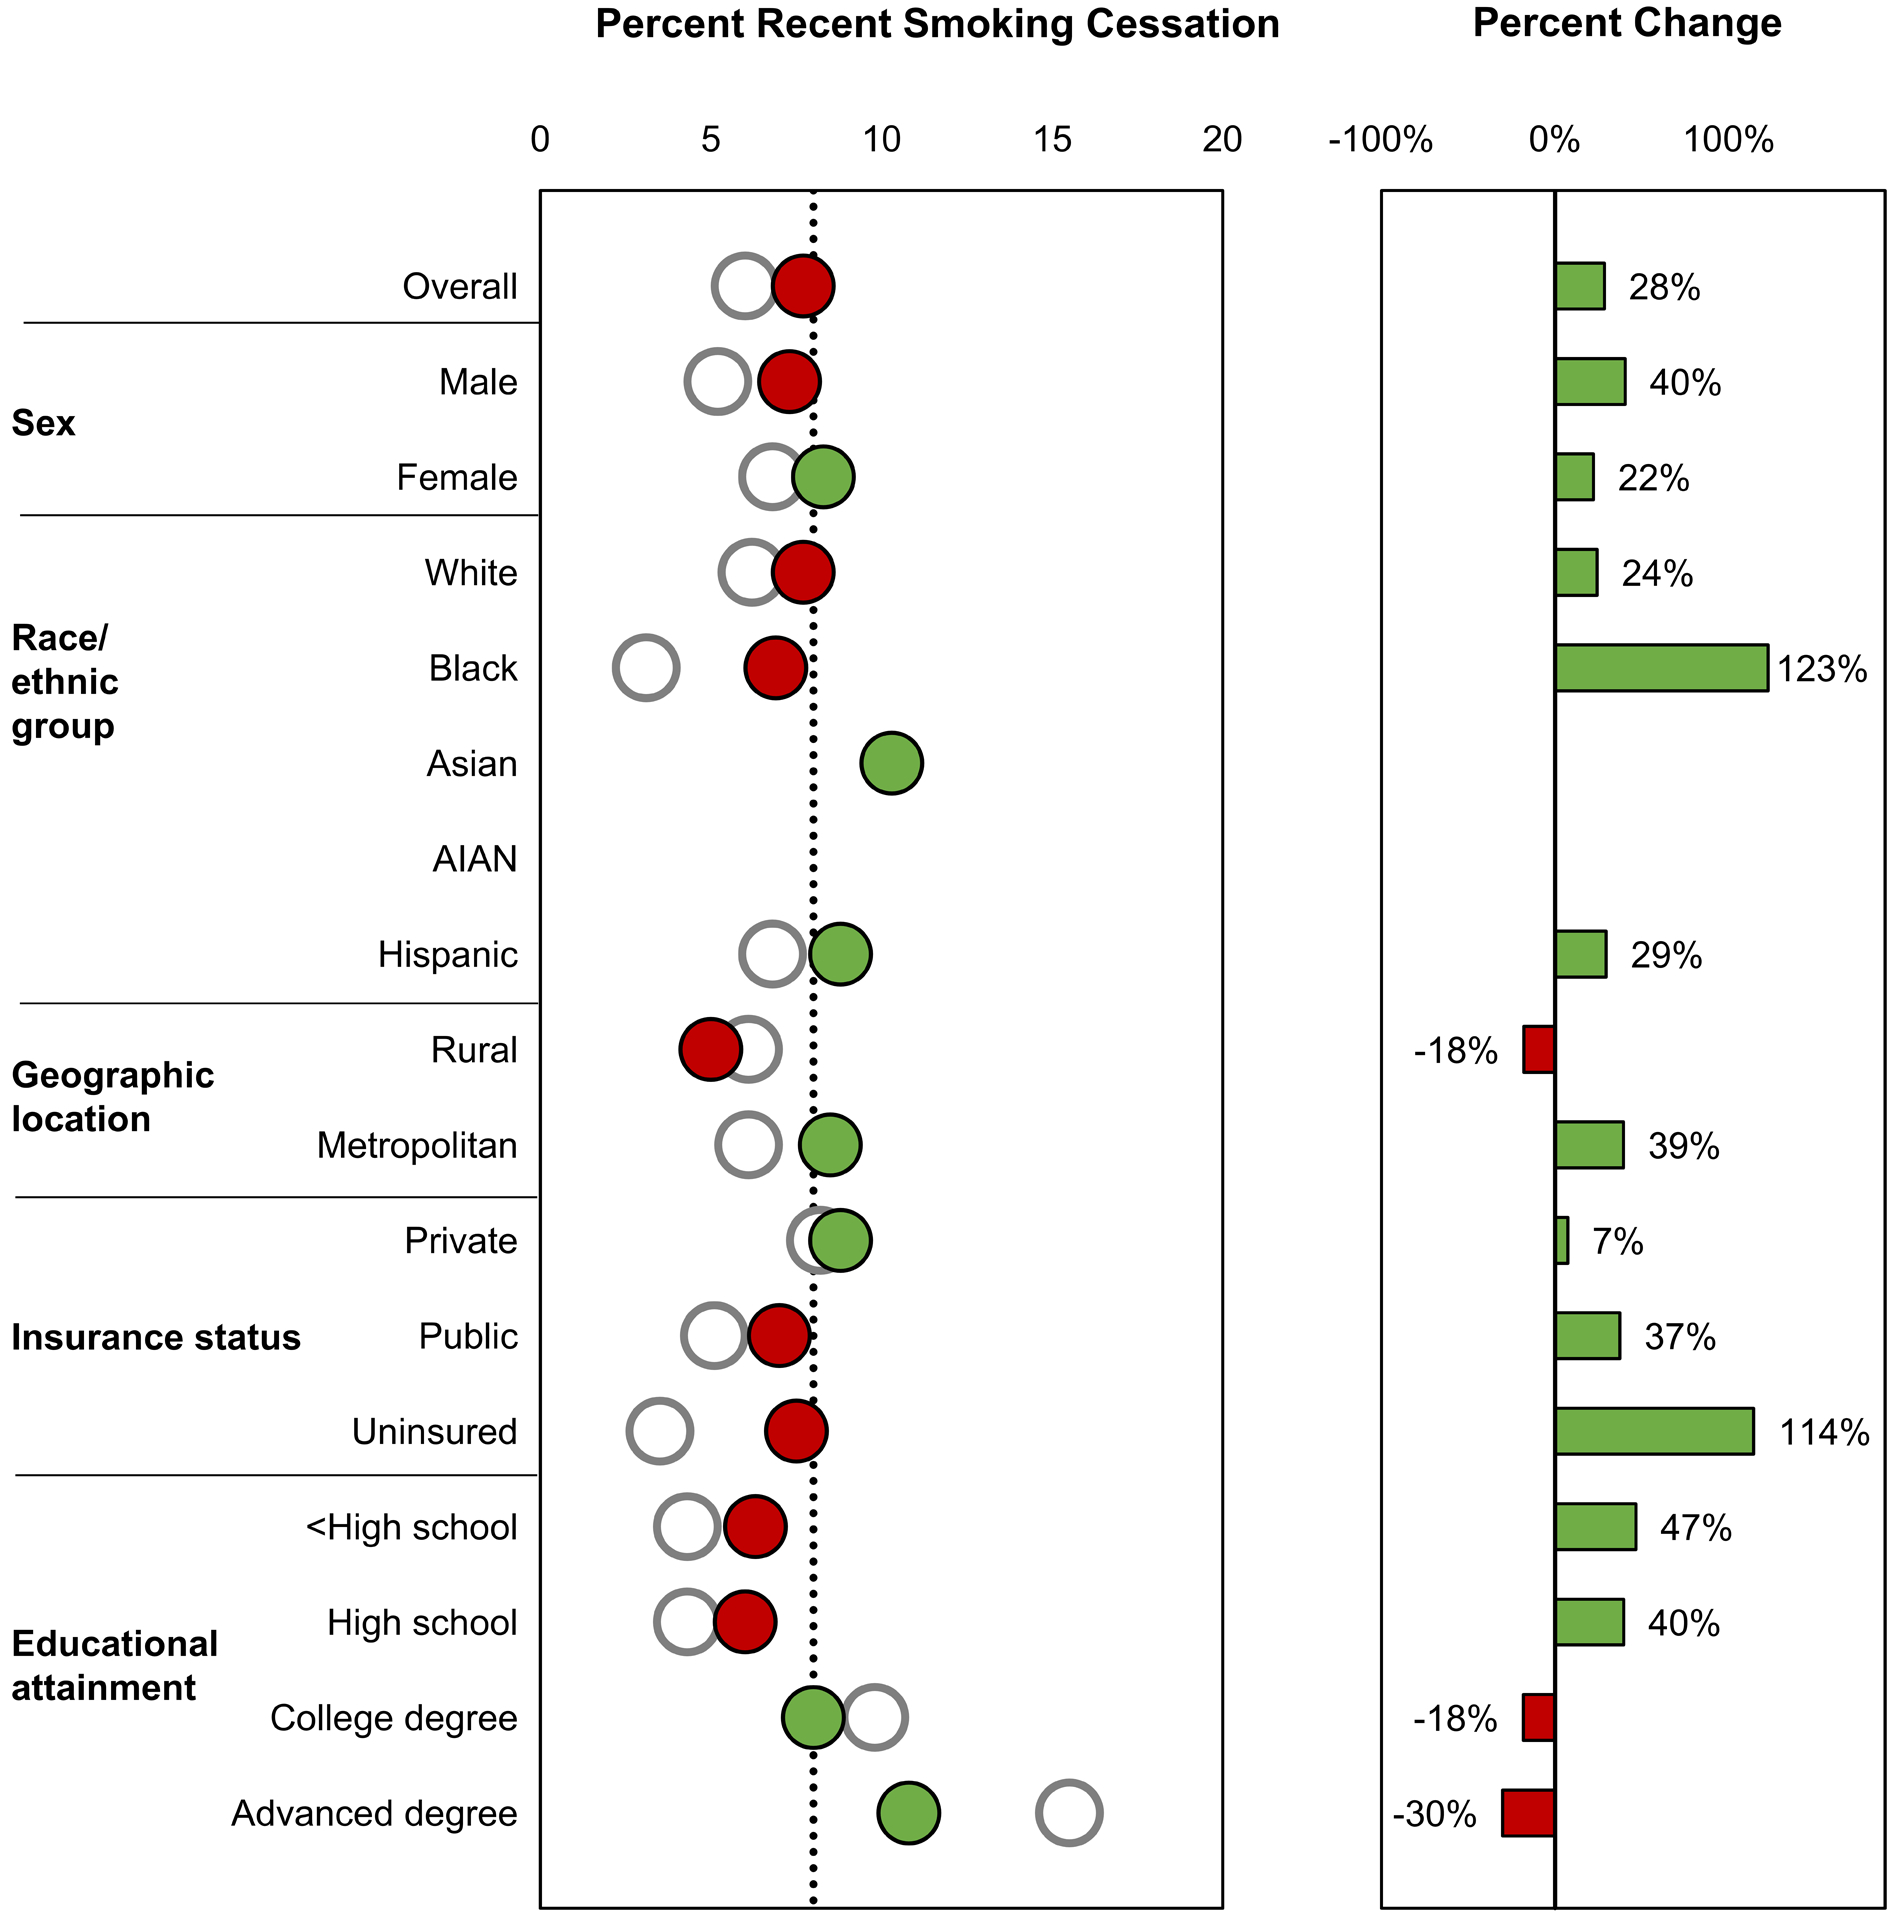
Methods: For this report, the authors selected objectives-including death rates, cancer screening, and major risk factors-related to 4 common cancers (lung, colorectal, female breast, and prostate). Baseline values, recent values, and the percentage change from baseline to recent values were examined overall and by select sociodemographic characteristics. Data from national surveillance systems were obtained from the Healthy People 2020 website.

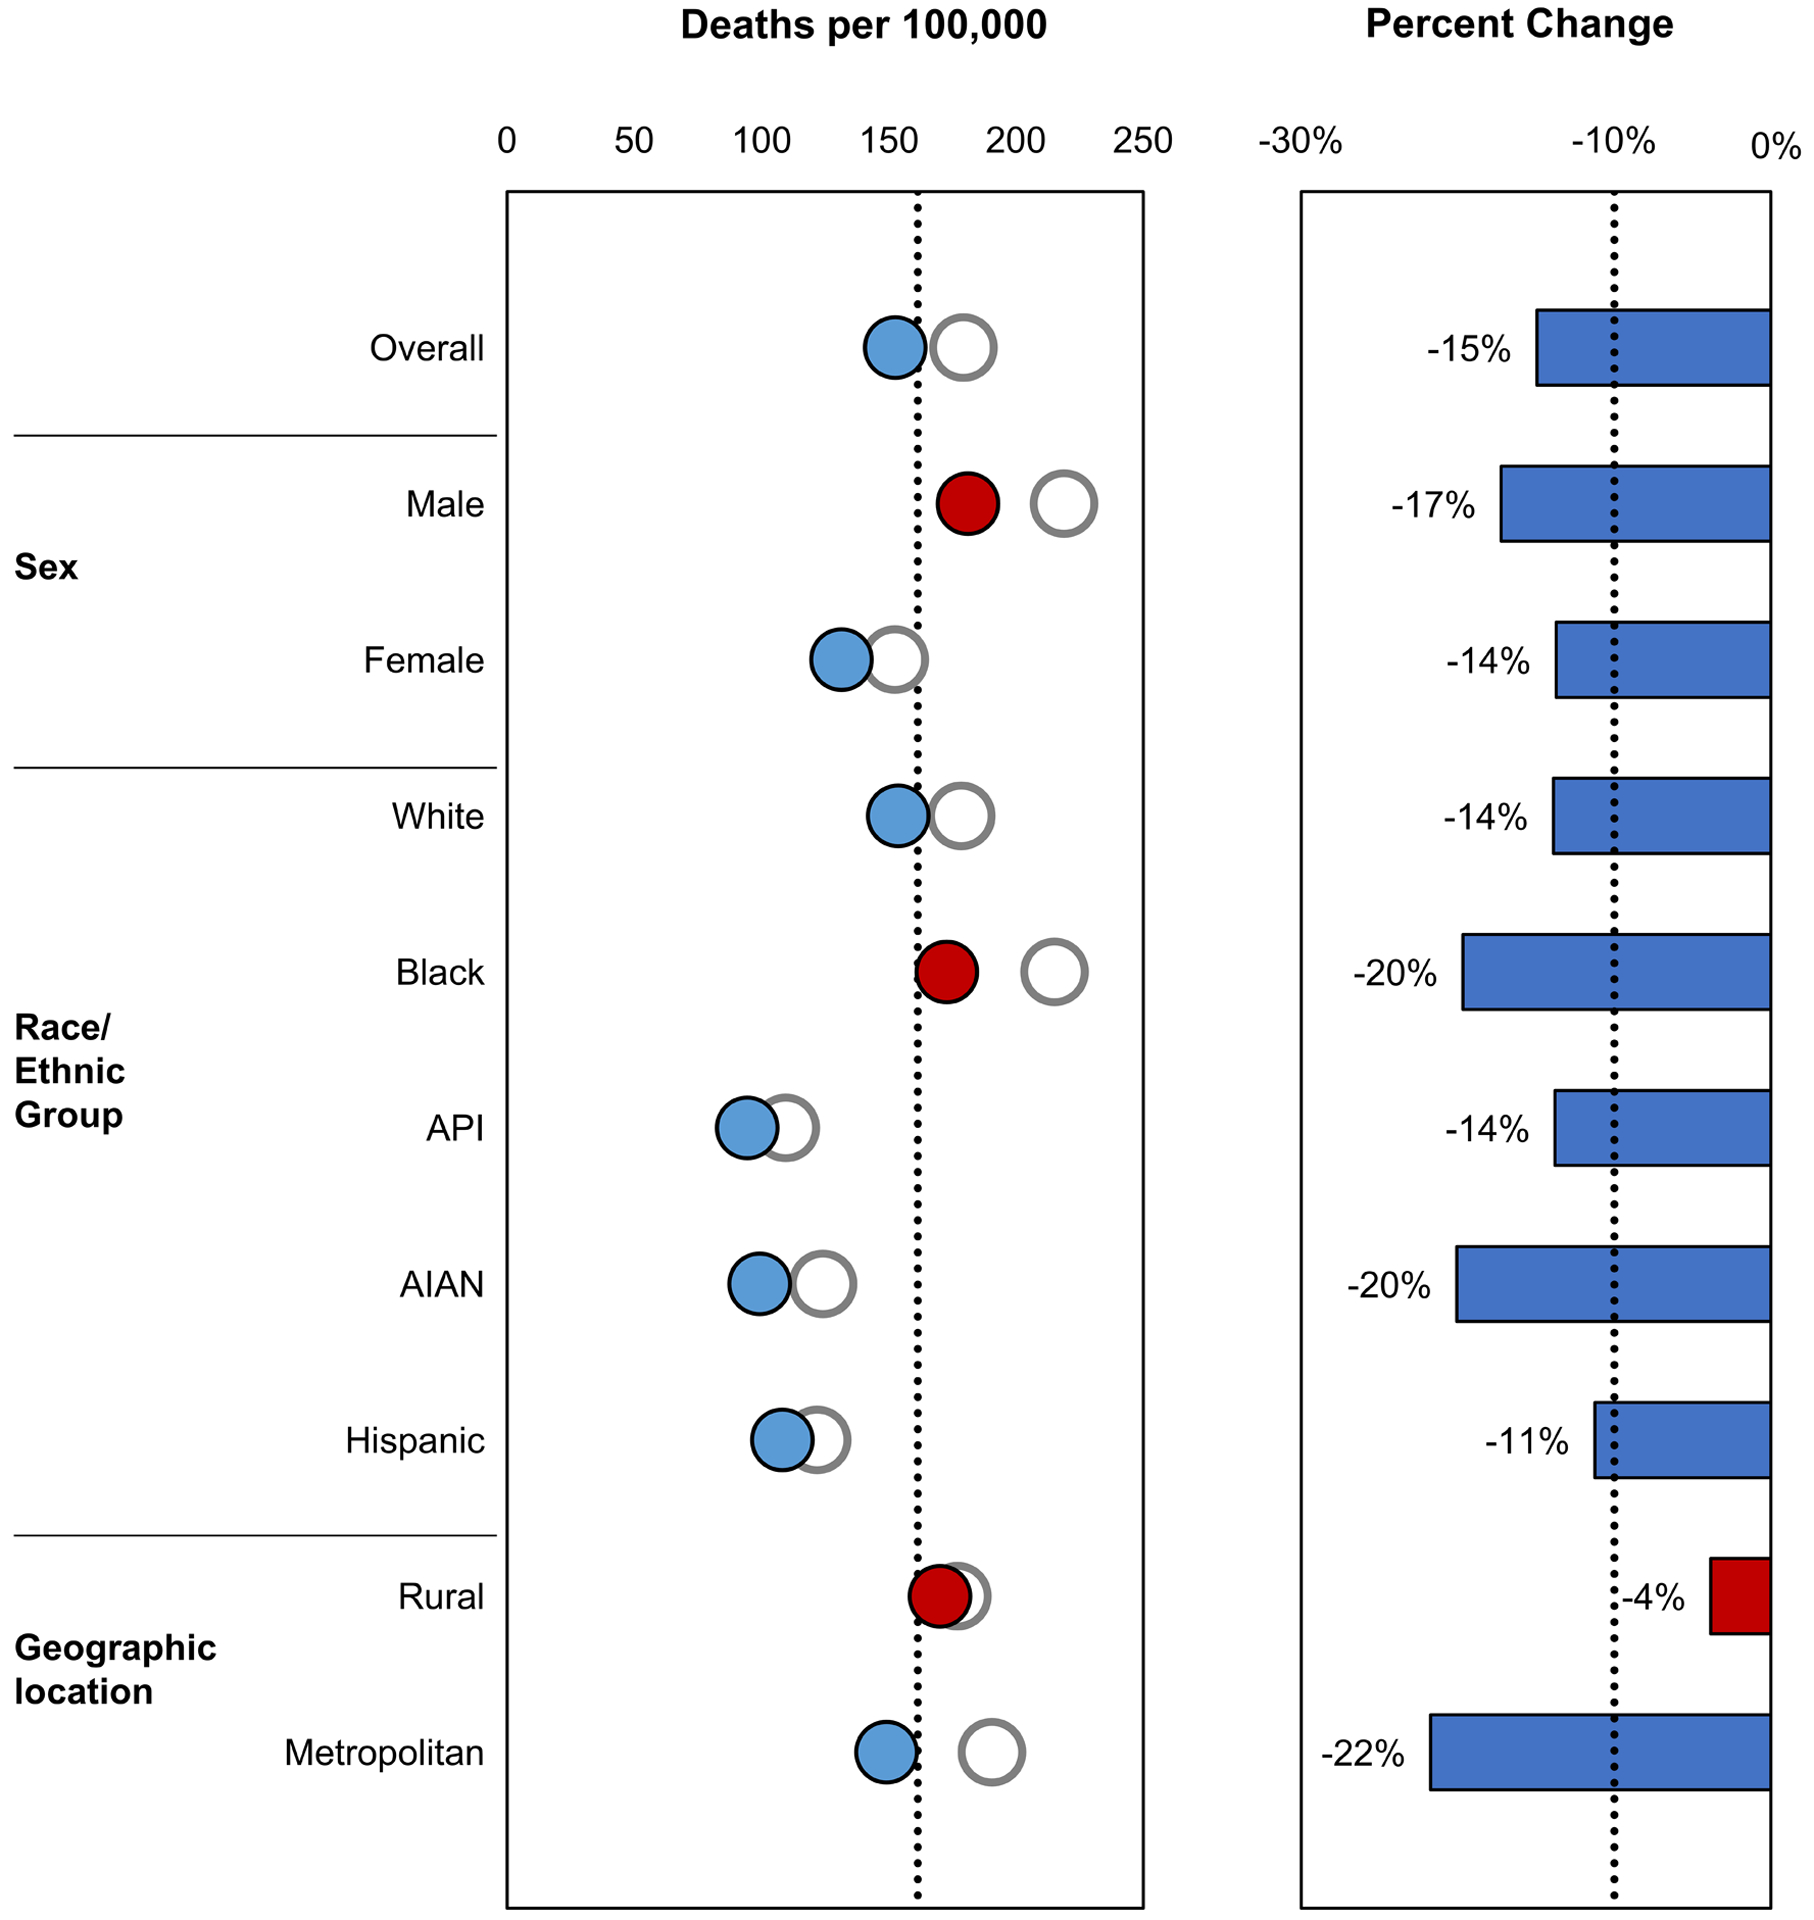
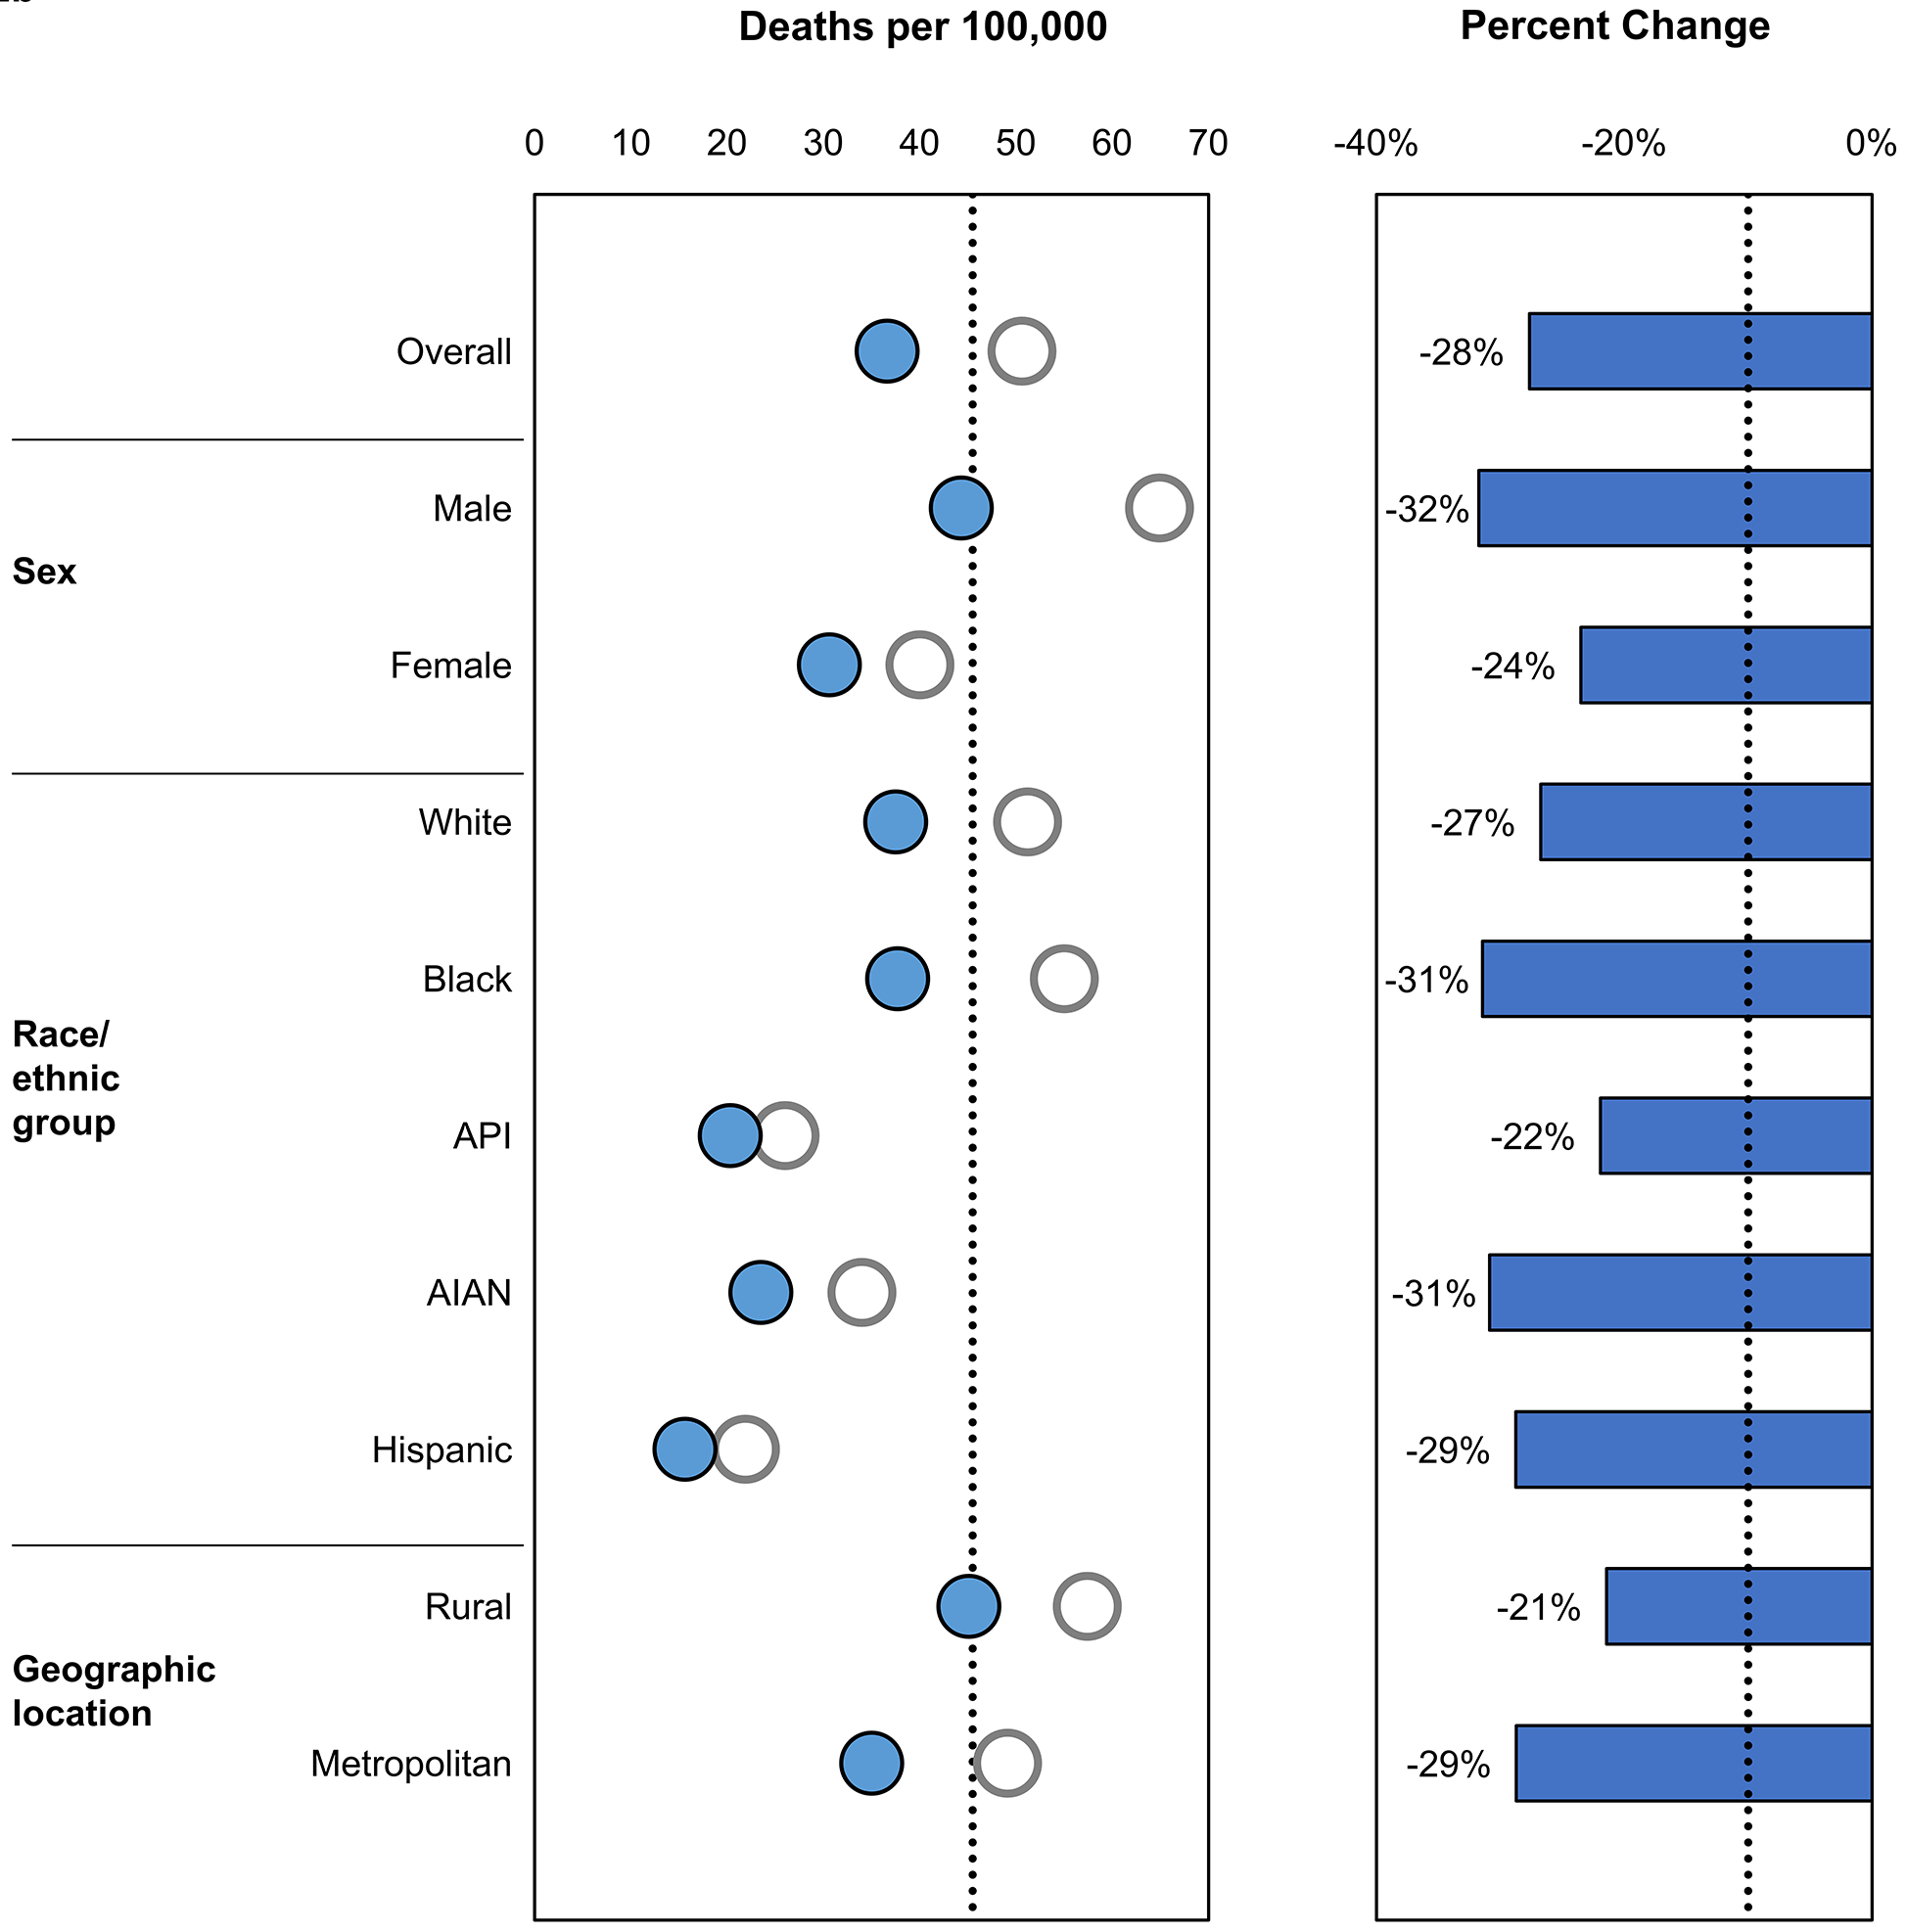
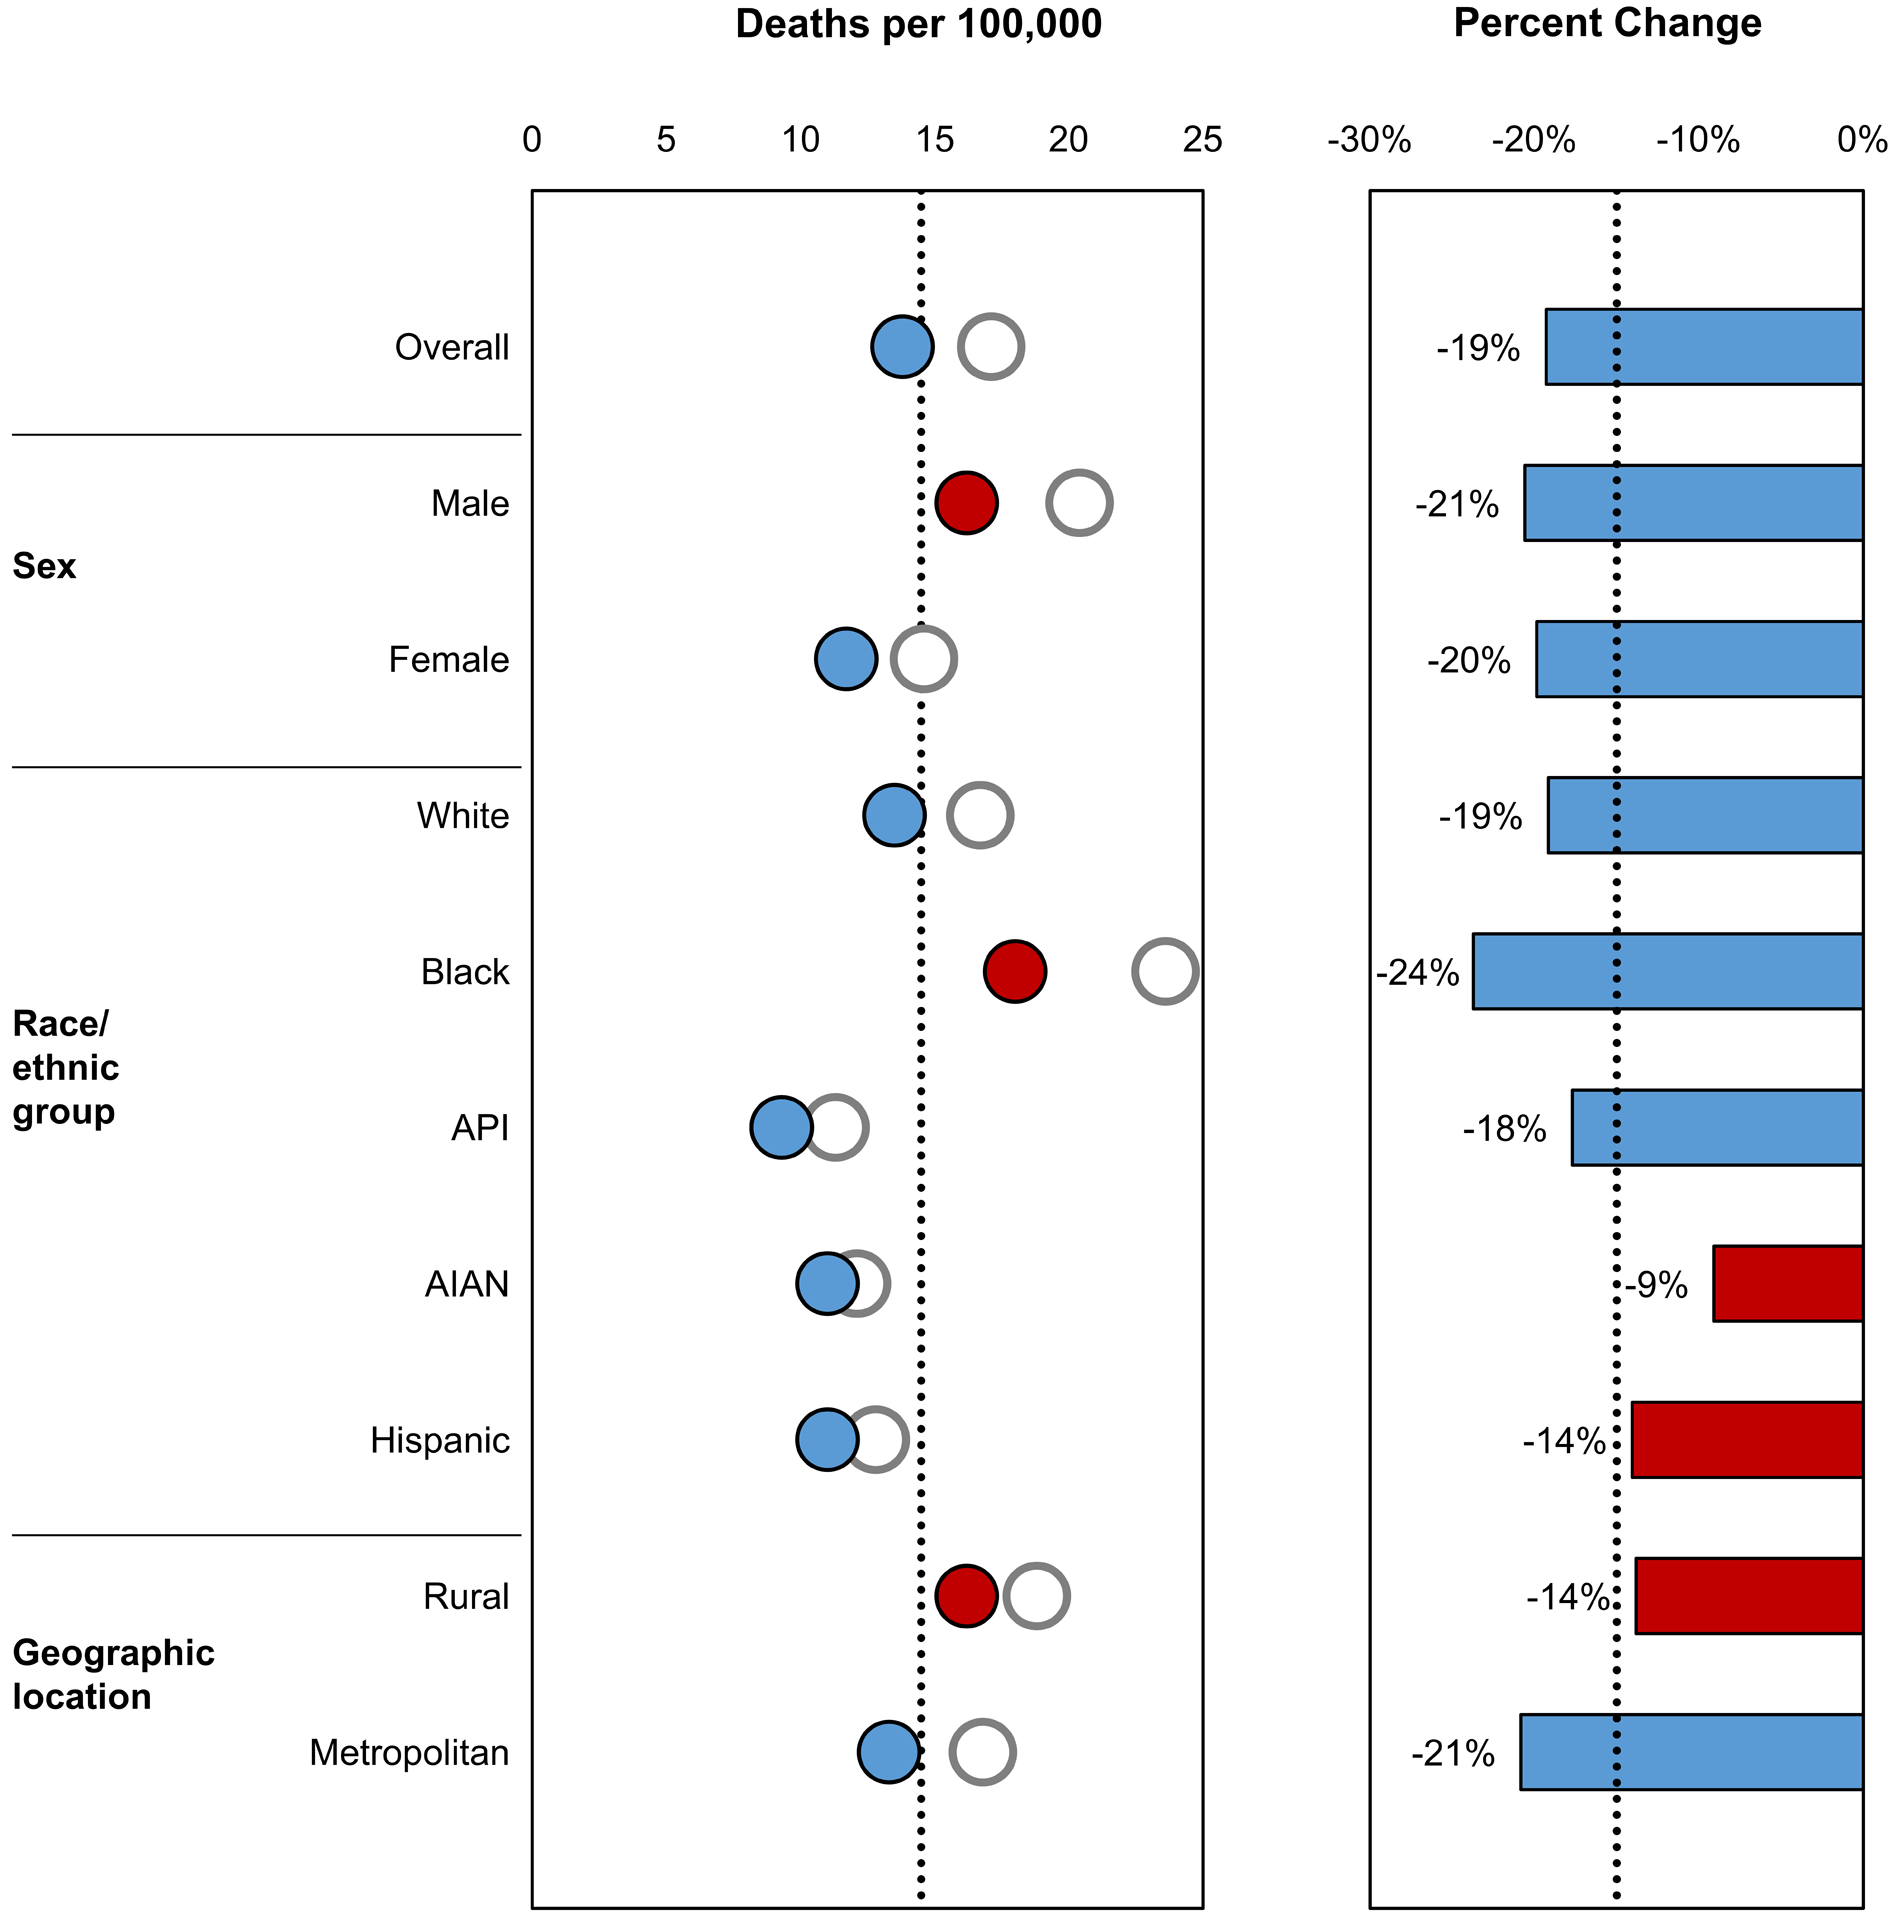
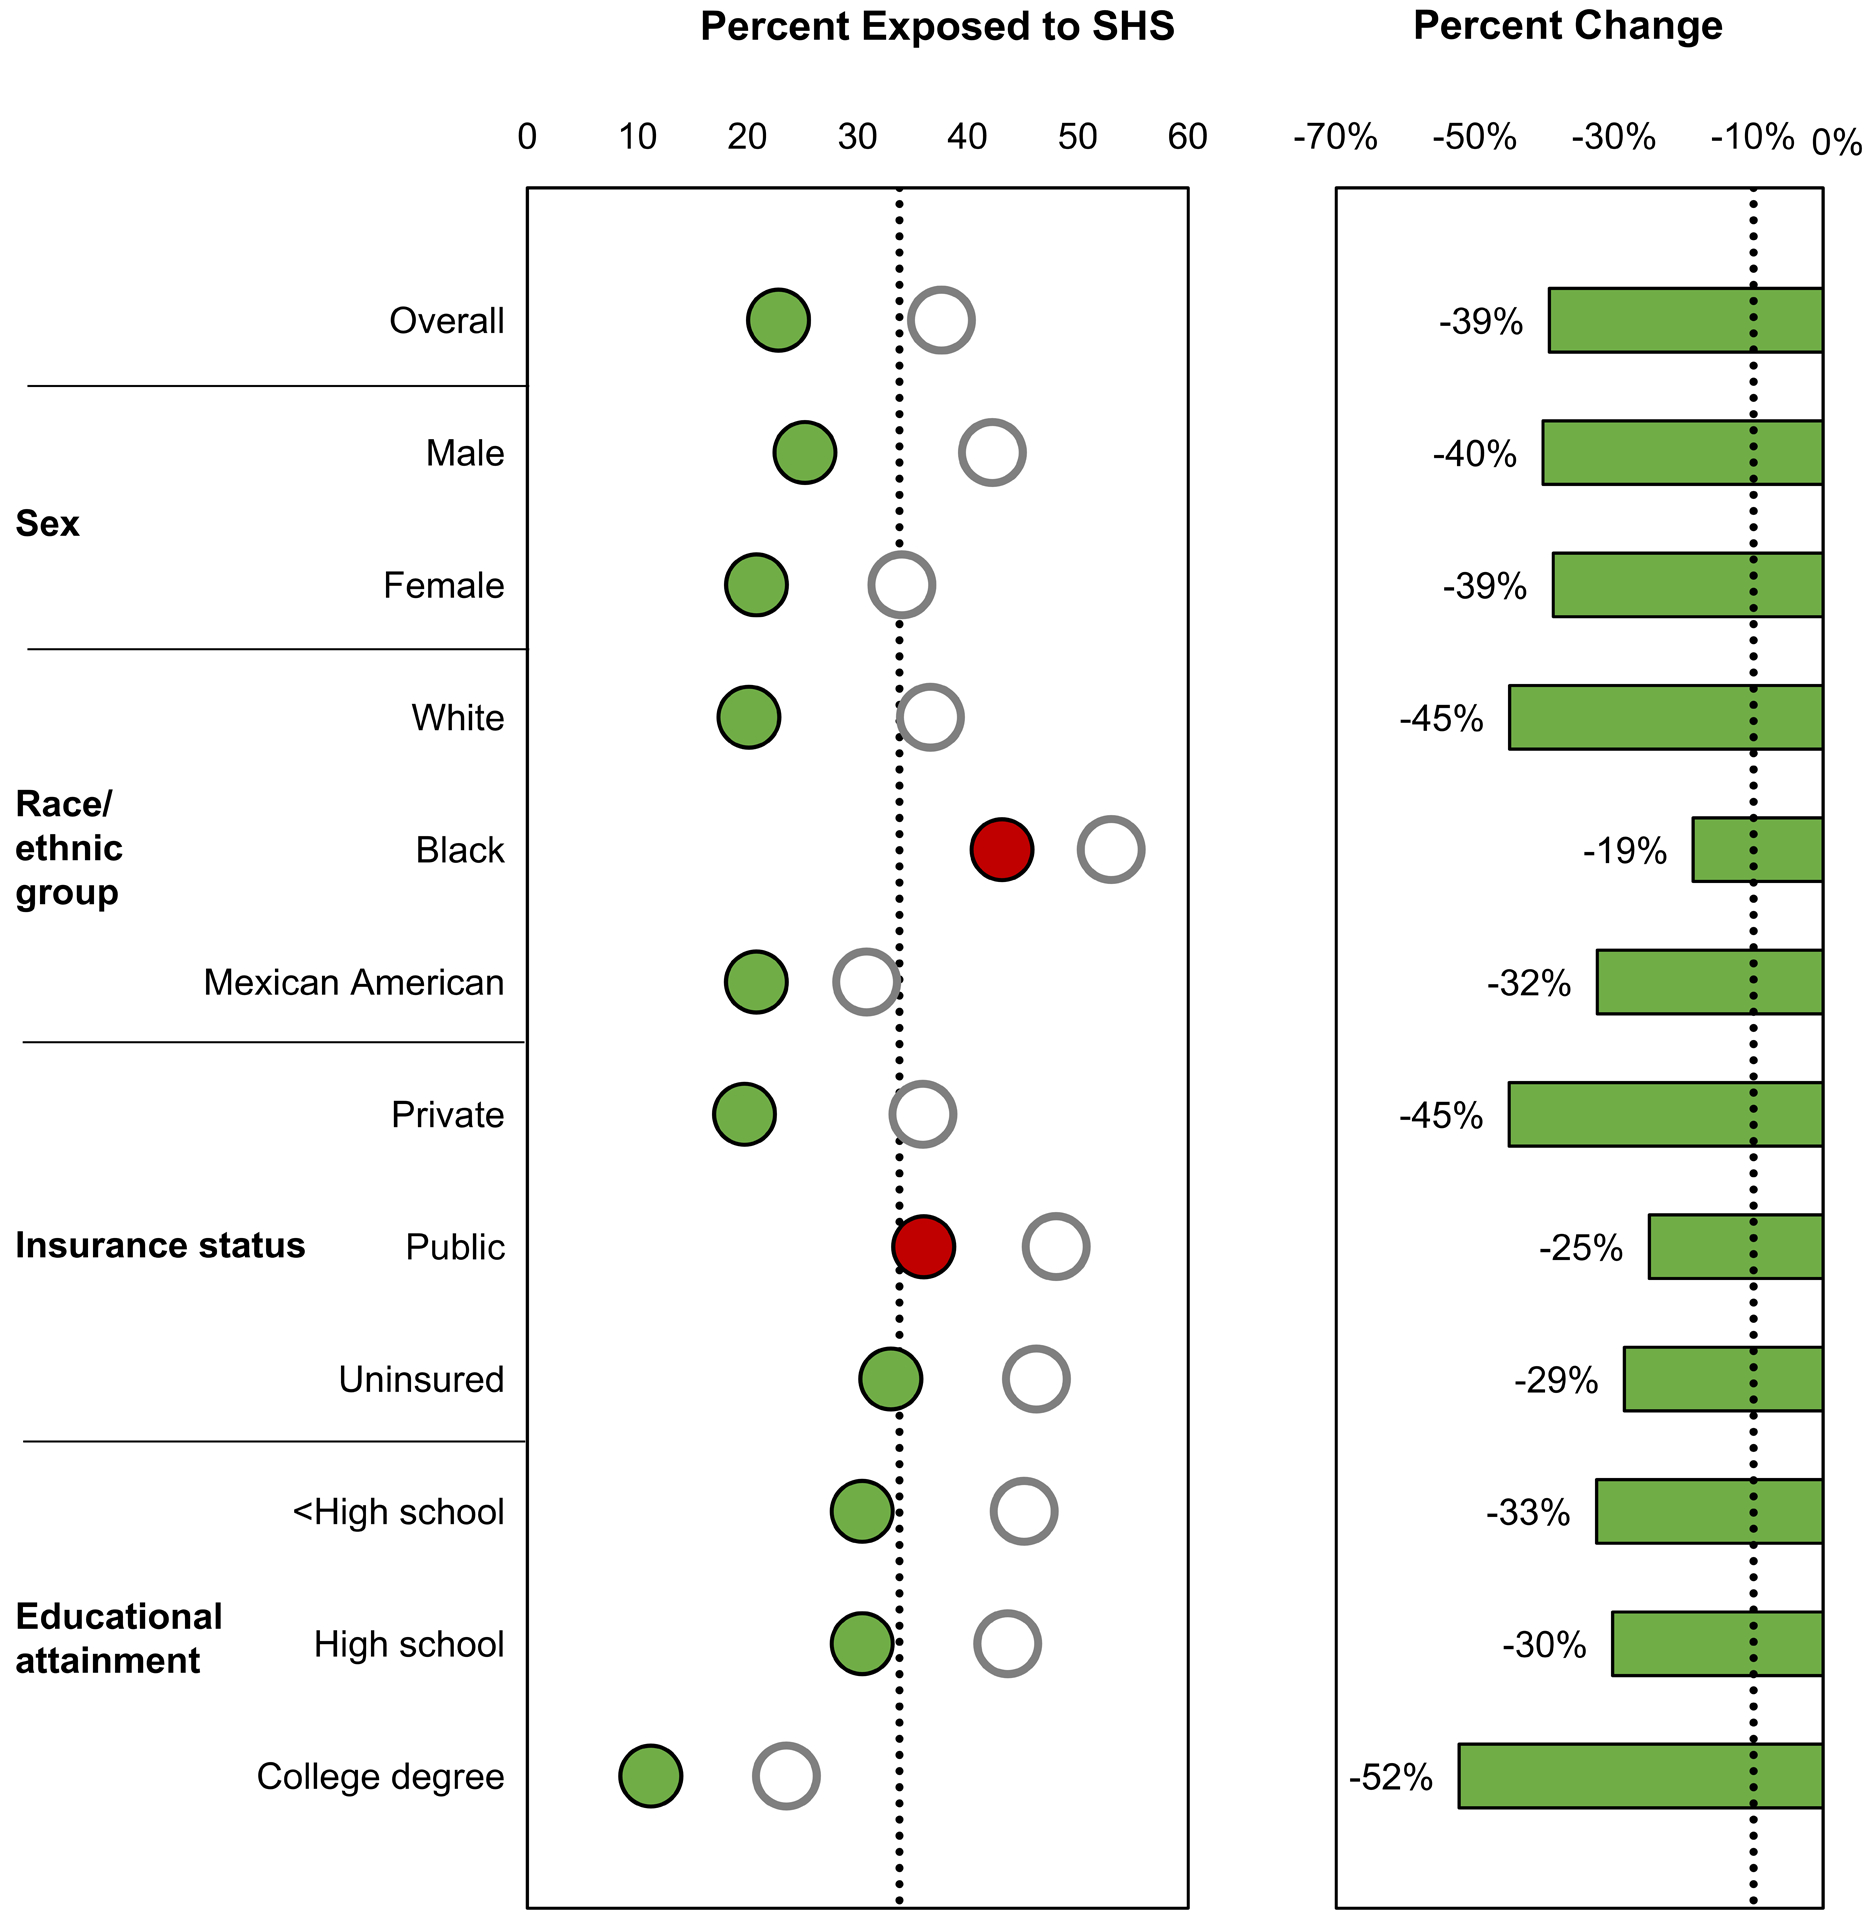
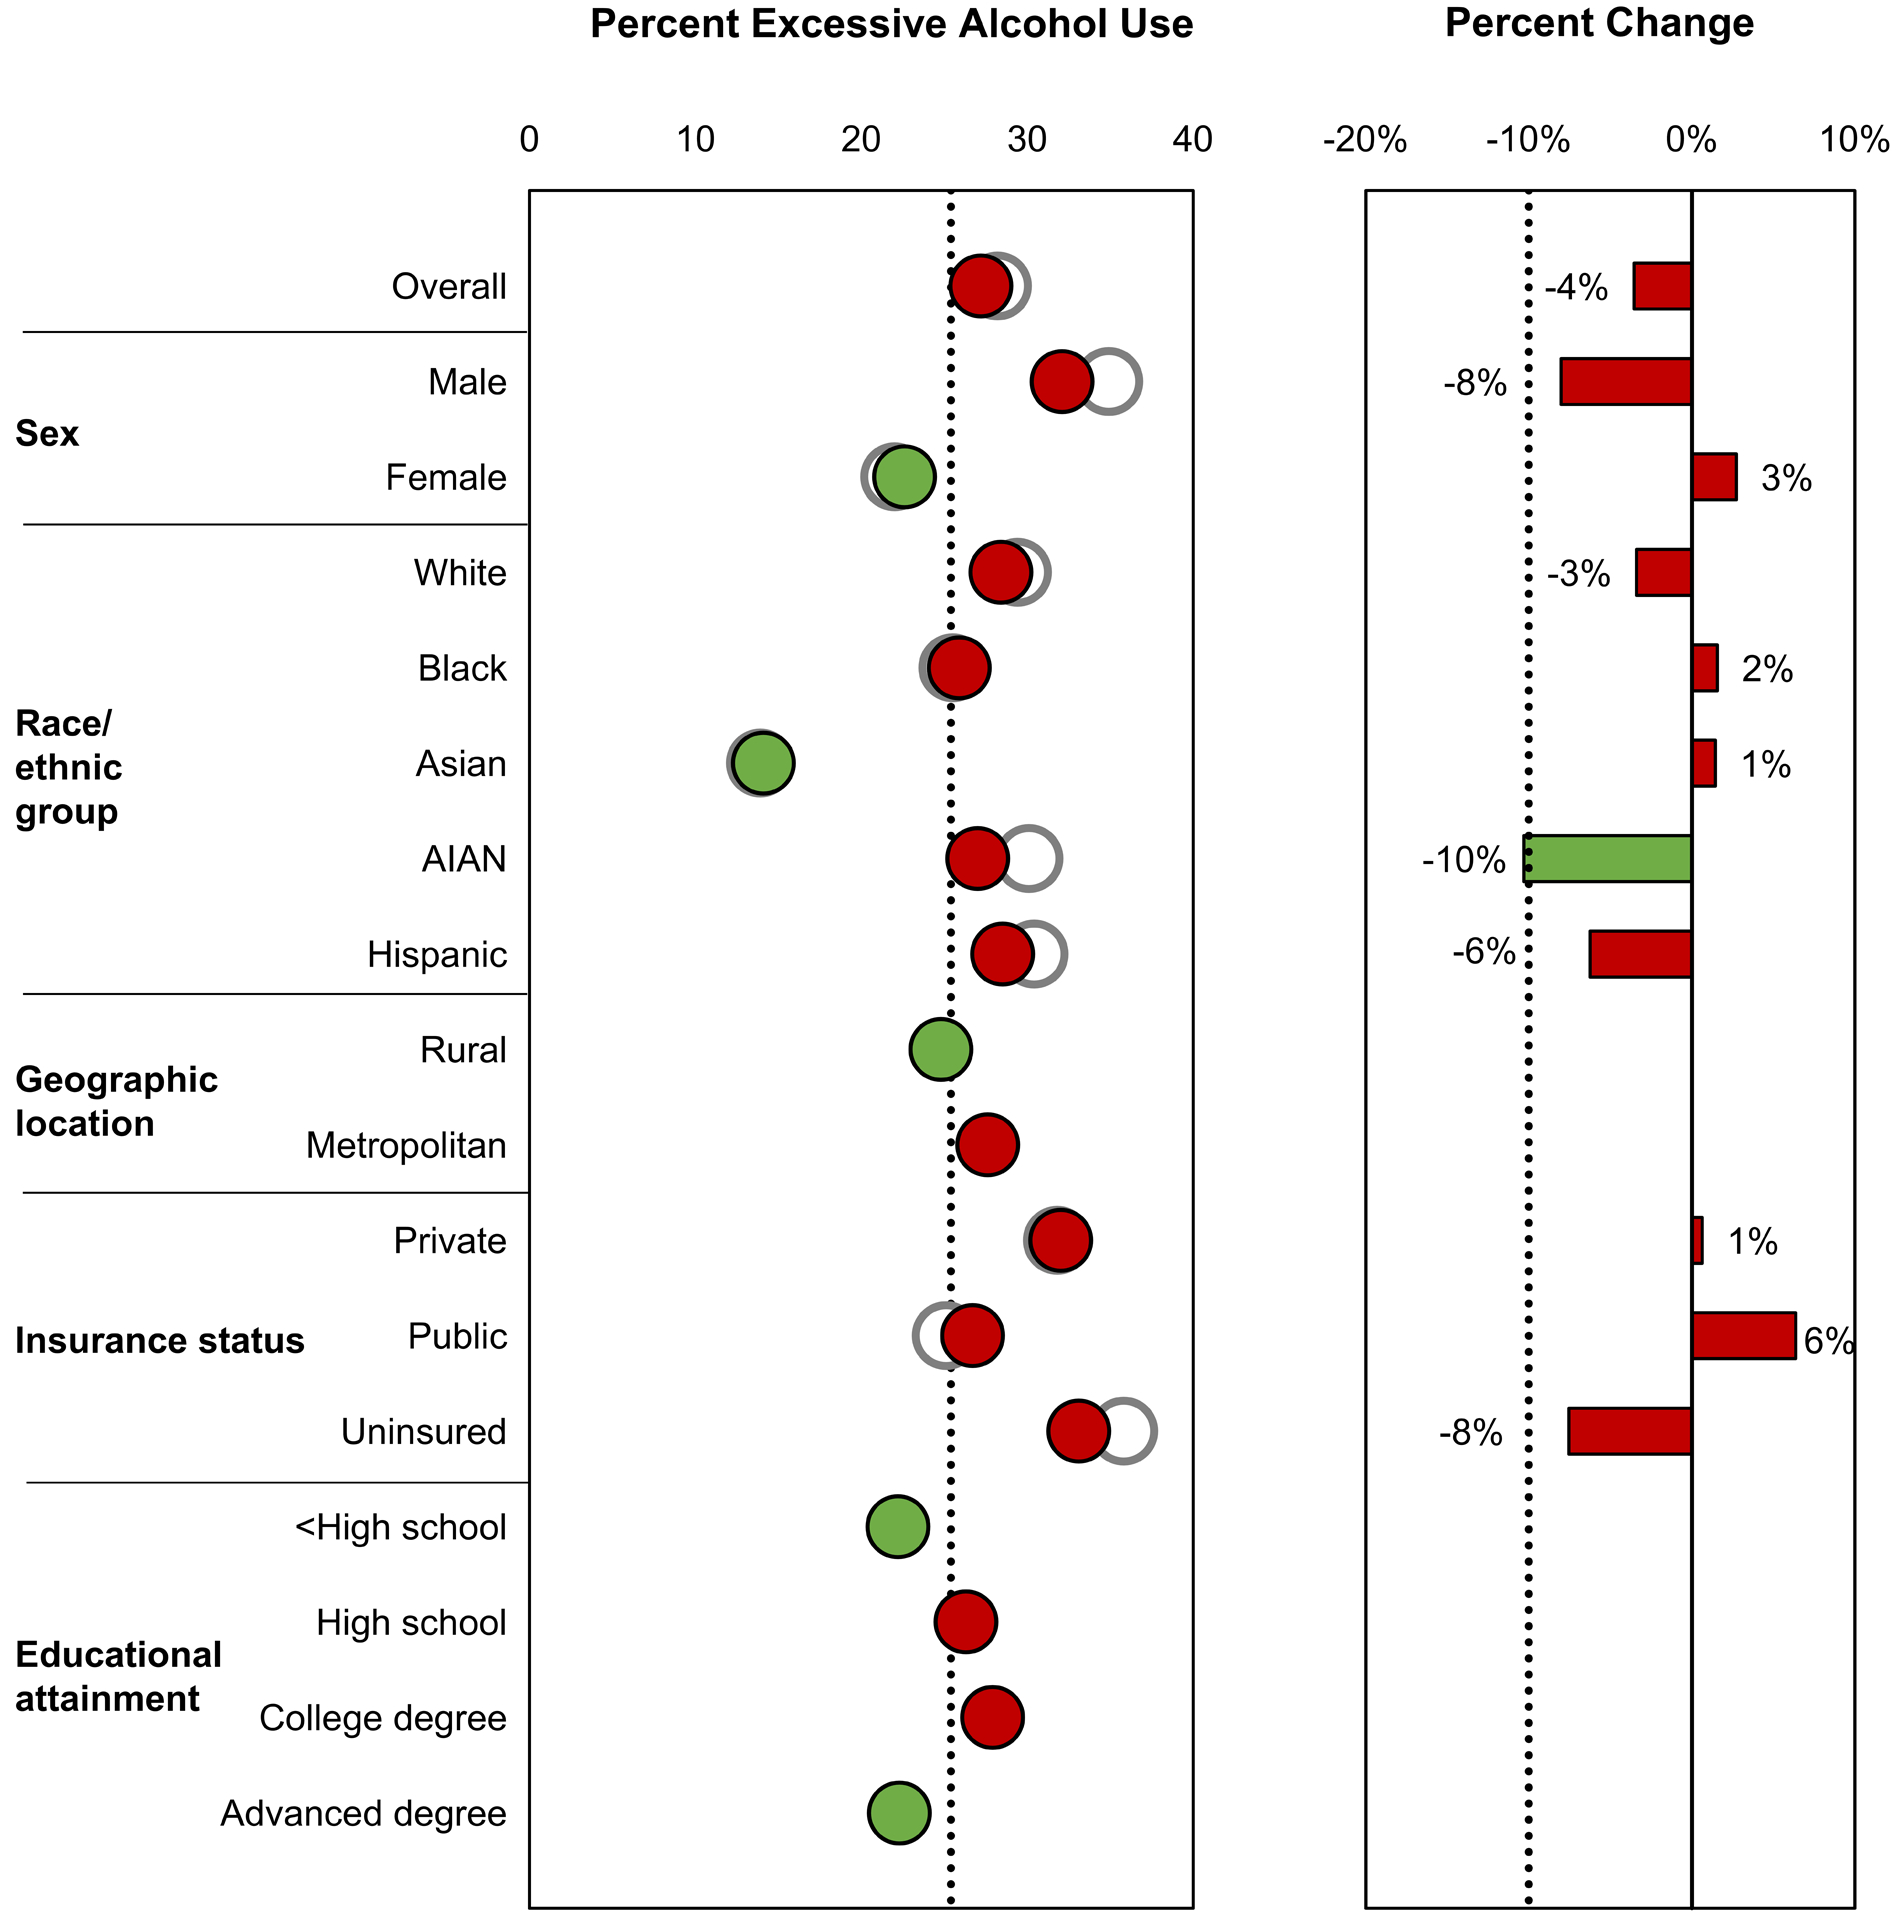
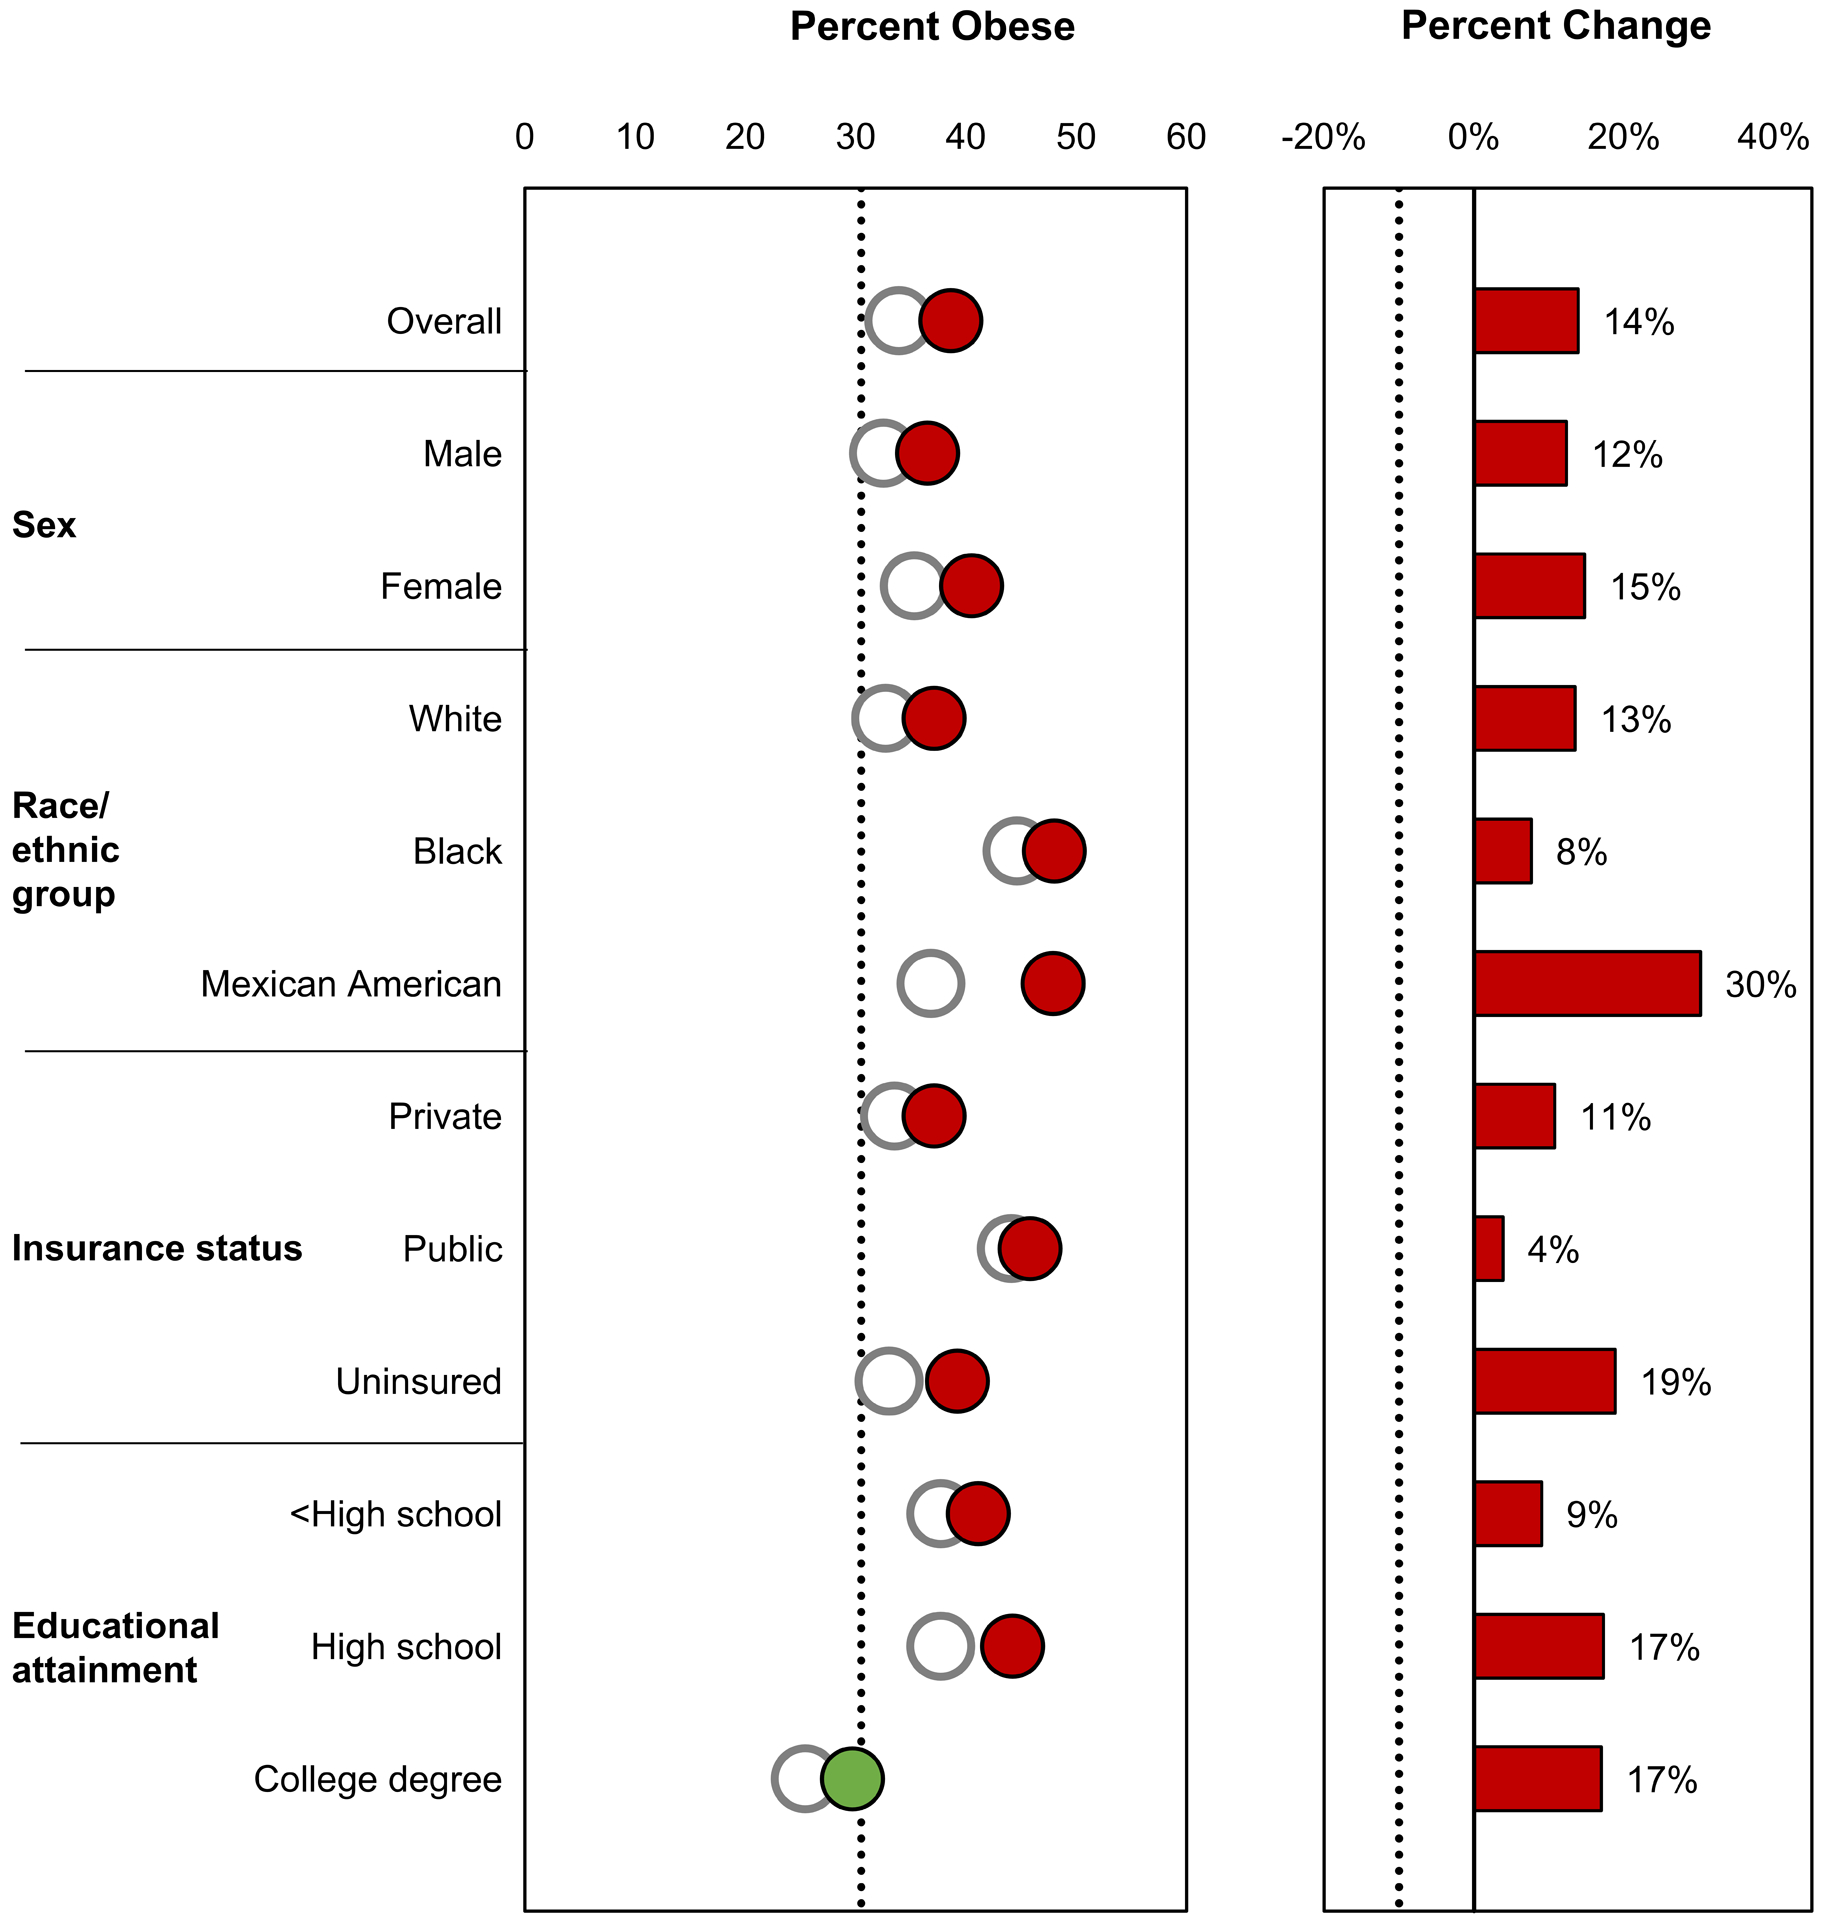
Results: Targets for death rates were met overall and in most sociodemographic groups, but not among males, blacks, or individuals in rural areas, although these groups did experience larger decreases in rates compared with other groups. During 2007 through 2017, cancer death rates decreased 15% overall, ranging from -4% (rural) to -22% (metropolitan). Targets for breast and colorectal cancer screening were not yet met overall or in any sociodemographic groups except those with the highest educational attainment, whereas lung cancer screening was generally low (<10%). Targets were not yet met overall for cigarette smoking, recent smoking cessation, excessive alcohol use, or obesity but were met for secondhand smoke exposure and physical activity. Some sociodemographic groups did not meet targets or had less improvement than others toward reaching objectives.

Conclusions: Monitoring trends in cancer risk factors, screening test use, and mortality can help assess the progress made toward decreasing the cancer burden in the United States. Although many interventions to reduce cancer risk factors and promote healthy behaviors are proven to work, they may not be equitably applied or work well in every community. Implementing cancer prevention and control interventions that are sustainable, focused, and culturally appropriate may boost success in communities with the greatest need, ensuring that all Americans can access a path to long, healthy, cancer-free lives.

Keywords: Healthy People 2020; cancer; epidemiology; surveillance.


Conflict of interest statement

CONFLICT OF INTEREST DISCLOSURES

The authors have no conflicts of interest related to this work to disclose.

Figures

Figure 1.
Figure 1.
The distribution of cancer deaths is illustrated by cancer type for both sexes, all ages, and all races/ethnicities combined—United States, 2017.
Figure 2.
Figure 2.
Healthy People 2020 objectives related to cancer death rates are illustrated. Data are from the National Vital Statistics System, baseline values are from 2007, and the most recent estimates are from 2017. Healthy People 2020 targets are indicated by black dotted lines. The baseline value is indicated as a white circle, and the most recent estimate is indicated as a blue circle if the target was met and as a red circle if the target was not met. The percentage change from the baseline value to the most recent estimate is indicated as a blue bar if the percentage improvement target was met and as a red bar if the percentage improvement target was not met. The Healthy People 2020 targets are: (A) reduce overall cancer deaths per 100,000 population from 179.3 in 2007 to 161.4 in 2020, a 10% improvement; (B) reduce lung cancer deaths per 100,000 population from 50.6 in 2007 to 45.5 in 2020, a 10% improvement; (C) reduce colorectal cancer deaths per 100,000 population from 17.1 in 2007 to 14.5 in 2020, a 15% improvement; (D) reduce female breast cancer deaths per 100,000 female population from 23.0 in 2007 to 20.7 in 2020, a 10% improvement; and (E) reduce prostate cancer deaths per 100,000 male population from 24.2 in 2007 to 21.8 in 2020, a 10% improvement. AIAN indicates American Indian/Alaska Native; API, Asian or Pacific Islander.
Figure 2.
Figure 2.
Healthy People 2020 objectives related to cancer death rates are illustrated. Data are from the National Vital Statistics System, baseline values are from 2007, and the most recent estimates are from 2017. Healthy People 2020 targets are indicated by black dotted lines. The baseline value is indicated as a white circle, and the most recent estimate is indicated as a blue circle if the target was met and as a red circle if the target was not met. The percentage change from the baseline value to the most recent estimate is indicated as a blue bar if the percentage improvement target was met and as a red bar if the percentage improvement target was not met. The Healthy People 2020 targets are: (A) reduce overall cancer deaths per 100,000 population from 179.3 in 2007 to 161.4 in 2020, a 10% improvement; (B) reduce lung cancer deaths per 100,000 population from 50.6 in 2007 to 45.5 in 2020, a 10% improvement; (C) reduce colorectal cancer deaths per 100,000 population from 17.1 in 2007 to 14.5 in 2020, a 15% improvement; (D) reduce female breast cancer deaths per 100,000 female population from 23.0 in 2007 to 20.7 in 2020, a 10% improvement; and (E) reduce prostate cancer deaths per 100,000 male population from 24.2 in 2007 to 21.8 in 2020, a 10% improvement. AIAN indicates American Indian/Alaska Native; API, Asian or Pacific Islander.
Figure 3.
Figure 3.
Healthy People 2020 objectives related to cancer screening are illustrated. Data are from the National Health Interview Survey; baseline values are from 2008 (except for lung cancer screening estimates, which are from 2010), and most recent estimates are from 2015. Healthy People 2020 targets are indicated by black dotted lines. The baseline value is indicated as a white circle, and the most recent estimate is indicated as a purple circle if the target was met and as a red circle if the target was not met. The percentage change from the baseline value to the most recent estimate is indicated as a purple bar if the percentage improvement target was met (or if the percentage change was in the indicated direction when a percentage improvement target was not specified) and as a red bar if the percentage improvement target was not met (or if the percentage change was not in the indicated direction when a percentage improvement target was not specified). The Healthy People 2020 targets are: (A) increase the proportion of adults aged 55 to 80 years at high risk of lung cancer based on smoking history who receive lung cancer screening based on the most recent US Preventive Services Task Force (USPSTF) recommendations (note that targets are not indicated because lung cancer screening was not included as a Healthy People 2020 objective); (B) increase the proportion of adults aged 50 to 75 years who receive colorectal cancer screening based on the most recent USPSTF recommendations from 52.1% in 2008 to 70.5% in 2020, a 30% improvement; (C) increase the proportion of women aged 50 to 74 years who receive breast cancer screening based on the most recent USPSTF recommendations from 73.7% in 2008 to 81.1% in 2020, a 10% improvement; and (D) increase the proportion of men aged ≥40 years who discuss the advantages and disadvantages of the prostate-specific antigen test to screen for prostate cancer with their health care provider from 14.4% in 2010 to 15.9% in 2020. AIAN indicates American Indian/Alaska Native; API, Asian or Pacific Islander.
Figure 3.
Figure 3.
Healthy People 2020 objectives related to cancer screening are illustrated. Data are from the National Health Interview Survey; baseline values are from 2008 (except for lung cancer screening estimates, which are from 2010), and most recent estimates are from 2015. Healthy People 2020 targets are indicated by black dotted lines. The baseline value is indicated as a white circle, and the most recent estimate is indicated as a purple circle if the target was met and as a red circle if the target was not met. The percentage change from the baseline value to the most recent estimate is indicated as a purple bar if the percentage improvement target was met (or if the percentage change was in the indicated direction when a percentage improvement target was not specified) and as a red bar if the percentage improvement target was not met (or if the percentage change was not in the indicated direction when a percentage improvement target was not specified). The Healthy People 2020 targets are: (A) increase the proportion of adults aged 55 to 80 years at high risk of lung cancer based on smoking history who receive lung cancer screening based on the most recent US Preventive Services Task Force (USPSTF) recommendations (note that targets are not indicated because lung cancer screening was not included as a Healthy People 2020 objective); (B) increase the proportion of adults aged 50 to 75 years who receive colorectal cancer screening based on the most recent USPSTF recommendations from 52.1% in 2008 to 70.5% in 2020, a 30% improvement; (C) increase the proportion of women aged 50 to 74 years who receive breast cancer screening based on the most recent USPSTF recommendations from 73.7% in 2008 to 81.1% in 2020, a 10% improvement; and (D) increase the proportion of men aged ≥40 years who discuss the advantages and disadvantages of the prostate-specific antigen test to screen for prostate cancer with their health care provider from 14.4% in 2010 to 15.9% in 2020. AIAN indicates American Indian/Alaska Native; API, Asian or Pacific Islander.
Figure 4.
Figure 4.
Healthy People 2020 objectives related to cancer risk factors are illustrated. Healthy People 2020 targets are indicated by black dotted lines. The baseline value is indicated as a white circle, and the most recent estimate is indicated as a green circle if the target was met and as a red circle if the target was not met. The percentage change from the baseline value to the most recent estimate is indicated as a green bar if the percentage improvement target was met (or if the percentage change was in the indicated direction when a percentage improvement target was not specified) and as a red bar if the percentage improvement target was not met (or if the percentage change was not in the indicated direction when a percentage improvement target was not specified). The Healthy People 2020 targets are: (A) reduce adult cigarette smoking prevalence from 20.6% in 2008 to 12.0% in 2020 (data are from the National Health Interview Survey; most recent estimates are from 2017); (B) increase recent smoking-cessation success among adult smokers from 6.0% in 2008 to 8.0% in 2020, a 2 percentage point improvement (data are from the National Health Interview Survey; most recent estimates are from 2017); (C) reduce the proportion of adults aged ≥18 years who are exposed to secondhand smoke from 37.6% in 2005 to 2008 to 33.8% in 2020, a 10% improvement (data are from the National Health and Nutrition Examination Survey; most recent estimates are from 2011–2014); (D) reduce the proportion of adults who drank alcohol excessively in the previous 30 days from 28.2% in 2008 to 25.4% in 2020, a 10% improvement (data are from the National Survey on Drug Use and Health; most recent estimates are from 2016; note that baseline values were not available by educational attainment); (E) reduce the proportion of adults who have obesity from 33.9% in 2005 to 2008 to 30.5% in 2020, a 10% improvement (data are from the National Health and Nutrition Examination Survey; most recent estimates are from 2013–2016); and (F) increase the proportion of adults who meet the objectives for aerobic physical activity and for muscle-strengthening activity from 18.2% in 2008 to 20.1% in 2020, a 10% improvement (data are from the National Health Interview Survey; most recent estimates are from 2017). AIAN indicates American Indian/Alaska Native; SHS, secondhand smoke.
Figure 4.
Figure 4.
Healthy People 2020 objectives related to cancer risk factors are illustrated. Healthy People 2020 targets are indicated by black dotted lines. The baseline value is indicated as a white circle, and the most recent estimate is indicated as a green circle if the target was met and as a red circle if the target was not met. The percentage change from the baseline value to the most recent estimate is indicated as a green bar if the percentage improvement target was met (or if the percentage change was in the indicated direction when a percentage improvement target was not specified) and as a red bar if the percentage improvement target was not met (or if the percentage change was not in the indicated direction when a percentage improvement target was not specified). The Healthy People 2020 targets are: (A) reduce adult cigarette smoking prevalence from 20.6% in 2008 to 12.0% in 2020 (data are from the National Health Interview Survey; most recent estimates are from 2017); (B) increase recent smoking-cessation success among adult smokers from 6.0% in 2008 to 8.0% in 2020, a 2 percentage point improvement (data are from the National Health Interview Survey; most recent estimates are from 2017); (C) reduce the proportion of adults aged ≥18 years who are exposed to secondhand smoke from 37.6% in 2005 to 2008 to 33.8% in 2020, a 10% improvement (data are from the National Health and Nutrition Examination Survey; most recent estimates are from 2011–2014); (D) reduce the proportion of adults who drank alcohol excessively in the previous 30 days from 28.2% in 2008 to 25.4% in 2020, a 10% improvement (data are from the National Survey on Drug Use and Health; most recent estimates are from 2016; note that baseline values were not available by educational attainment); (E) reduce the proportion of adults who have obesity from 33.9% in 2005 to 2008 to 30.5% in 2020, a 10% improvement (data are from the National Health and Nutrition Examination Survey; most recent estimates are from 2013–2016); and (F) increase the proportion of adults who meet the objectives for aerobic physical activity and for muscle-strengthening activity from 18.2% in 2008 to 20.1% in 2020, a 10% improvement (data are from the National Health Interview Survey; most recent estimates are from 2017). AIAN indicates American Indian/Alaska Native; SHS, secondhand smoke.

References

    1. Koh HK, Blakey CR, Roper AY. Healthy People 2020: A report card on the health of the nation. JAMA 2014;311(24):2475–2476. 10.1001/jama.2014.6446 %J JAMA. - DOI - PubMed
    1. U.S. Department of Health and Human Services. Healthy people 2020. 2019; https://www.healthypeople.gov/2020/topics-objectives. [accessed January 17, 2020].
    1. Brown ML, Klabunde CN, Cronin KA, White MC, Richardson LC, McNeel TS. Challenges in meeting healthy people 2020 objectives for cancer-related preventive services, National Health Interview Survey, 2008 and 2010. Prev Chronic Dis 2014;11:E29 10.5888/pcd11.130174. - DOI - PMC - PubMed
    1. Siu AL. Screening for breast cancer: U.S. Preventive Services Task Force recommendation statement. Ann Intern Med 2016;164(4):279–296. 10.7326/M15-2886 %J Annals of Internal Medicine. - DOI - PubMed
    1. Bibbins-Domingo K, Grossman DC, Curry SJ, et al. Screening for colorectal cancer: US Preventive Services Task Force recommendation statement. JAMA 2016;315(23):2564–2575. 10.1001/jama.2016.5989. - DOI - PubMed

Publication types

MeSH terms