

Exposure-response characterisation of tildrakizumab in chronic plaque psoriasis: Pooled analysis of 3 randomised controlled trials
- PMID: 32162721
- PMCID: PMC7444761
- DOI: 10.1111/bcp.14280
Exposure-response characterisation of tildrakizumab in chronic plaque psoriasis: Pooled analysis of 3 randomised controlled trials
Abstract
Aims: In this exposure-response analysis, the dosing regimen for tildrakizumab, an antibody for treating moderate-to-severe chronic plaque psoriasis, was determined using data from 3 randomised controlled trials (P05495/NCT01225731: phase 2b, n = 355; reSURFACE 1/NCT01722331: phase 3, n = 772; reSURFACE 2/NCT01729754: phase 3, n = 1090).
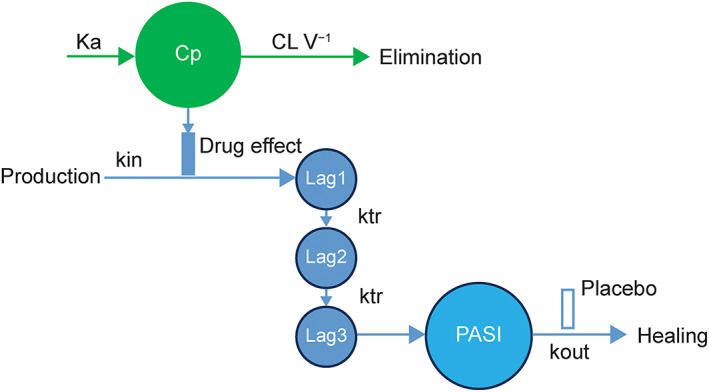
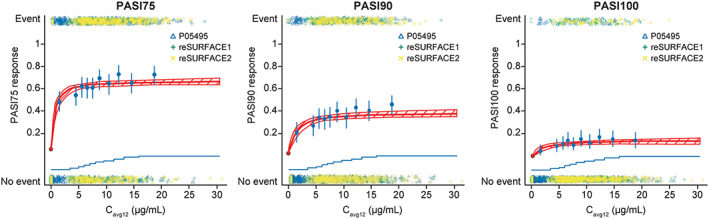
Methods: A maximum drug effect (Emax ) logistic-regression exposure-efficacy model was used to describe the week 12 Psoriasis Area and Severity Index (PASI) responses with average concentration of tildrakizumab during weeks 1-12 (Cavg12 ) as exposure metric. The impact of covariates (e.g., body weight, region) was tested. Exposure-safety, longitudinal pharmacokinetic-pharmacodynamic and risk-benefit analyses were also conducted.
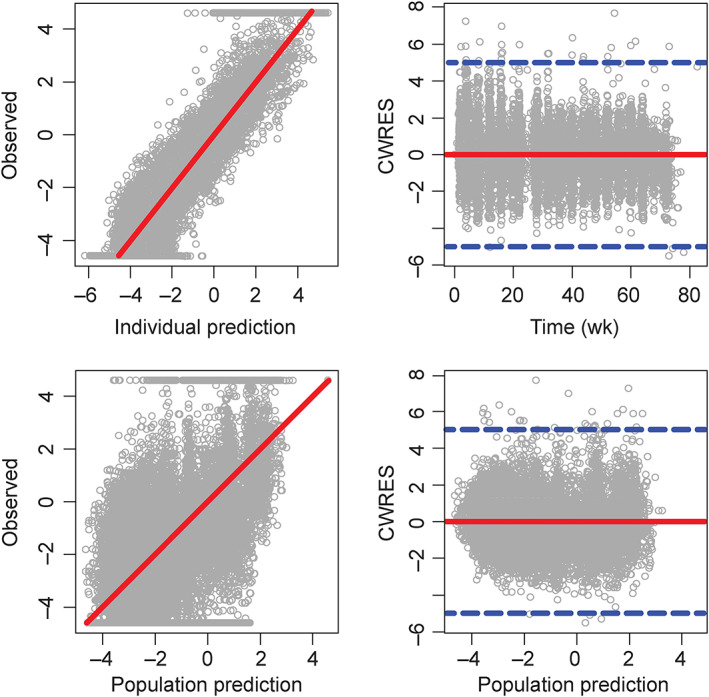
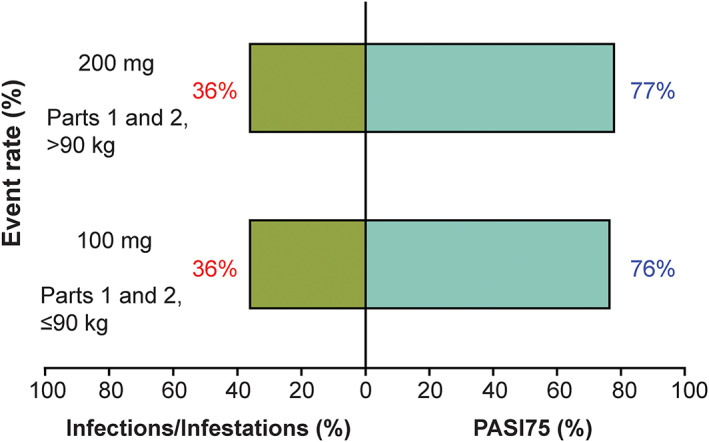
Results: At week 12, Emax was estimated at 62.2, 37.9 and 14.6% of responders for PASI75/90/100, respectively. Exposure-response curves plateaued at exposures >5 μg mL-1 . Heavier subjects had a lower response rate to placebo as measured by PASI75/90/100 than lighter subjects. PASI100 placebo response was less in subjects with higher baseline PASI score and older age. Simulated week 12 PASI75 increased by ≤4% on increasing the dose from 100 to 200 mg every 12 weeks (Q12W). The pharmacokinetic-pharmacodynamic model adequately described the time course of PASI change after treatment in the entire population and in each subject. Risk-benefit profiles were favourable for the 100- and 200-mg doses in different weight subgroups.
Conclusions: Patients with moderate-to-severe psoriasis should receive 100-mg subcutaneous tildrakizumab Q12W. Patients with high body weight (>90 kg) may benefit from a higher dose (200-mg Q12W).
Keywords: dermatology; modelling and simulation; pharmacodynamics; pharmacokinetic-pharmacodynamic; psoriasis.
© 2020 The British Pharmacological Society.
Conflict of interest statement
L.W. is an employee of Merck Sharp & Dohme Corp., a subsidiary of Merck & Co., Inc., Kenilworth, NJ, USA. P.J., T.K., R.W. and H.L. are consultants paid for by Merck Sharp & Dohme Corp., a subsidiary of Merck & Co., Inc., Kenilworth, NJ, USA. They also consult for numerous other pharmaceutical companies.
Figures
References
-
- Parisi R, Symmons DP, Griffiths CE, Ashcroft DM, on behalf of the Identification and Management of Psoriasis and Associated ComorbidiTy (IMPACT) project team . Global epidemiology of psoriasis: a systematic review of incidence and prevalence. J Invest Dermatol. 2013;133(2):377‐385. - PubMed
-
- Lewis‐Beck C, Abouzaid S, Xie L, Baser O, Kim E. Analysis of the relationship between psoriasis symptom severity and quality of life, work productivity, and activity impairment among patients with moderate‐to‐severe psoriasis using structural equation modeling. Patient Prefer Adherence. 2013;7:199‐205. - PMC - PubMed
Publication types
MeSH terms
Substances
Associated data
Grants and funding
LinkOut - more resources
Full Text Sources
Medical
