

Adeno-associated virus-vectored influenza vaccine elicits neutralizing and Fcγ receptor-activating antibodies
- PMID: 32163240
- PMCID: PMC7207162
- DOI: 10.15252/emmm.201910938
Adeno-associated virus-vectored influenza vaccine elicits neutralizing and Fcγ receptor-activating antibodies
Abstract
The current seasonal inactivated influenza vaccine protects only against a narrow range of virus strains as it triggers a dominant antibody response toward the hypervariable hemagglutinin (HA) head region. The discovery of rare broadly protective antibodies against conserved regions in influenza virus proteins has propelled research on distinct antigens and delivery methods to efficiently induce broad immunity toward drifted or shifted virus strains. Here, we report that adeno-associated virus (AAV) vectors expressing influenza virus HA or chimeric HA protected mice against homologous and heterologous virus challenges. Unexpectedly, immunization even with wild-type HA induced antibodies recognizing the HA-stalk and activating FcγR-dependent responses indicating that AAV-vectored expression balances HA head- and HA stalk-specific humoral responses. Immunization with AAV-HA partially protected also ferrets against a harsh virus challenge. Results from this study provide a rationale for further clinical development of AAV vectors as influenza vaccine platform, which could benefit from their approved use in human gene therapy.
Keywords: FcγR; HA stalk; adeno-associated virus vector; broadly reactive antibody; universal influenza vaccine.
© 2020 The Authors. Published under the terms of the CC BY 4.0 license.
Conflict of interest statement
The authors declare that they have no conflict of interest.
Figures
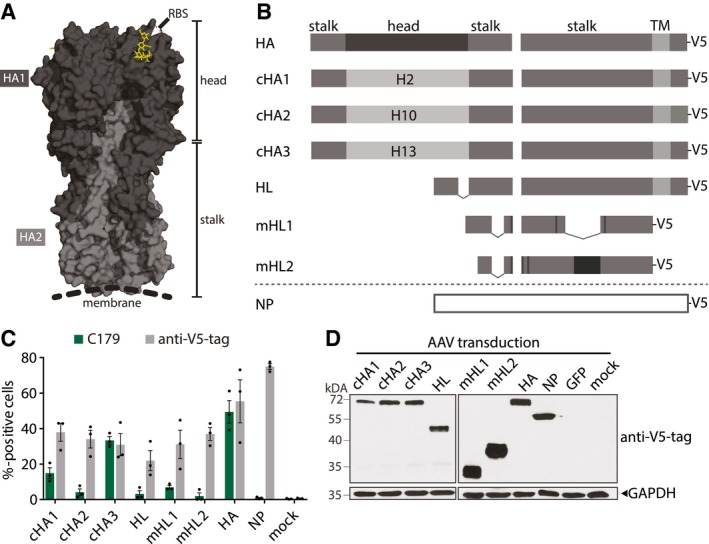
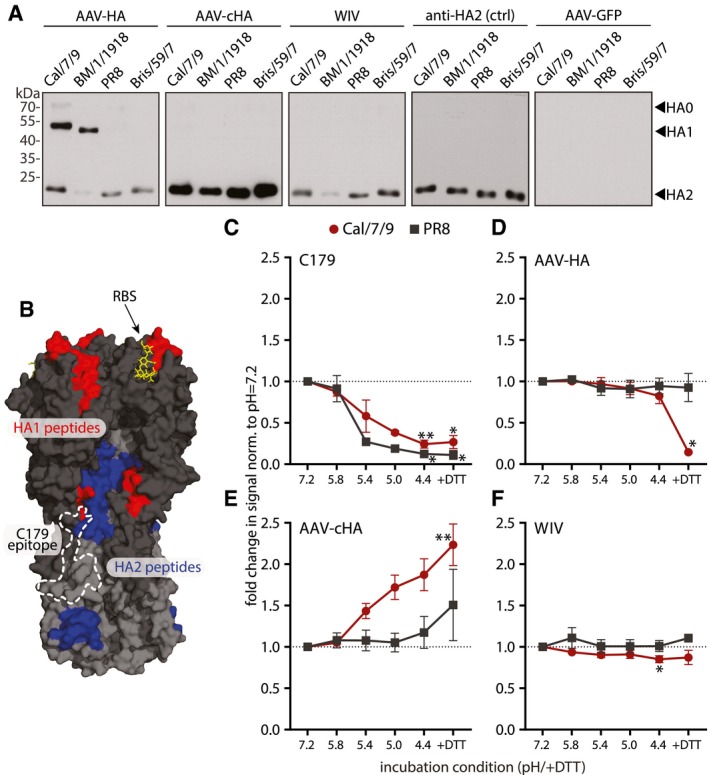
3D structure of a HA trimer (PDB 3UBE generated with PyMol). Each monomer consists of a HA1 (dark gray) and HA2 (light gray) subunit. The trimer can be divided into a membrane distal head which contains the RBS (yellow) and a proximal stalk region.
HA and NP represent the Cal/7/9 wild‐type proteins. Chimeric HA (cHA) 1 contains the head regions of H2 HA, cHA2 of H10 HA, and cHA3 of H13 HA, while they all contain the Cal/7/9 HA‐stalk region. Headless HA (HL) contains a deletion in the HA‐head region (dashed line). Modified headless HA (mHL1 and mHL2) contain stabilizing mutations (black boxes) and lack additional internal parts. All constructs were codon‐optimized and carry a V5‐tag at their C‐terminus.
Frequency of C179+ or V5‐tag+ 293T cells 24 h after transfection of AAV vector plasmids as measured by flow cytometry. Symbols represent single experiments and bars the mean ± SE (n = 3).
Immunoblot of 293T cells 72 h after transduction with AAV vectors at a MOI of 106. Antigen expression was detected with an anti‐V5‐tag antibody. Equal loading was controlled with a GAPDH antibody (n = 3).
- A
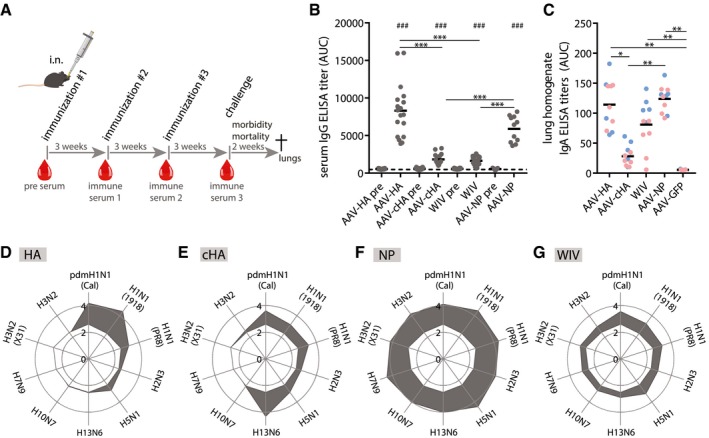
Mice were intranasally given 1011 vg of AAV vector in 50 μl volume three times in 3‐week intervals. 20 μg of Cal/7/9 WIV per 50 μl was given i.n. two times. Blood samples were taken at indicated time points (red drops). After influenza challenge, mice were monitored for survival and weight loss for 2 weeks before necropsy.
- B
Total IgG ELISA titers expressed as area under the curve (AUC) against homologous Cal/7/9 virus of pre‐immune and pre‐challenge sera of individual animals of the indicated vaccine groups (AAV‐HA, ‐cHA, ‐GFP, WIV n = 18, AAV‐NP n = 11). Background reactivity of pooled AAV‐GFP pre‐challenge serum is shown as dashed line. ELISAs were performed in technical duplicates.
- C
IgA ELISA titers in post‐challenge lung homogenates against Cal/7/9 of individual mice of the indicated vaccine groups (AAV‐HA, ‐cHA, ‐GFP, ‐NP, WIV n = 11). of the Cal/7/9 (blue symbols) and PR8 low‐dose (red symbols) challenge groups. ELISAs were performed in technical duplicates.
- D–G
Total IgG ELISA titers expressed as log10 of the mean AUC against indicated viruses in pre‐challenge sera in AAV‐HA (D, n = 18)‐, AAV‐cHA (E, n = 18)‐, AAV‐NP (F, n = 11)‐, or WIV (G, n = 18)‐immunized animals (gray area). Reactivity of sera of AAV‐GFP‐immunized animals is indicated as white area in the center of each web diagram. ELISAs were performed in technical duplicates.
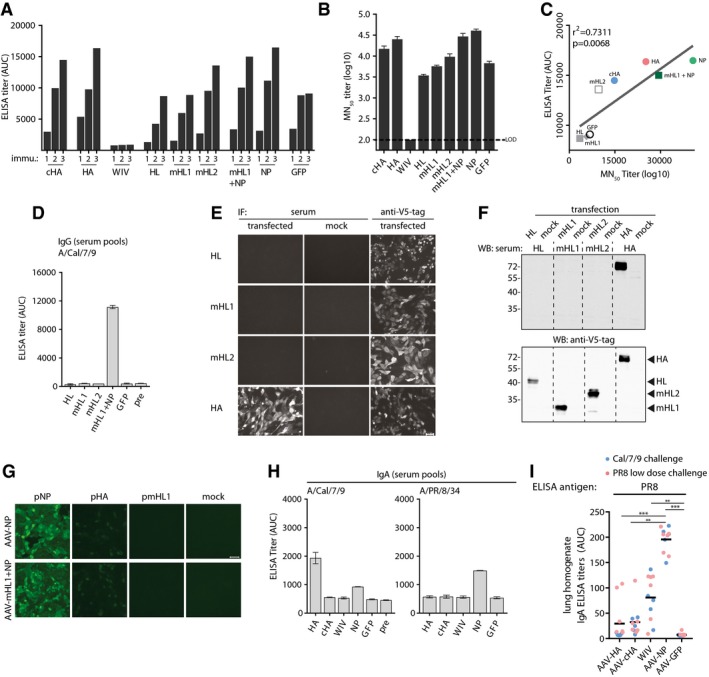
Total IgG ELISA titer induction over vaccination period against AAV9‐vector capsids in pooled sera (AAV‐HA, ‐cHA, ‐GFP, WIV n = 18; AAV‐NP n = 11; AAV‐HL, ‐mHL1, ‐mHL2 n = 7 mice per group) at indicated time points.
AAV9‐vector‐neutralizing antibody titers in pooled pre‐challenge sera (AAV‐HA, ‐cHA, ‐GFP, WIV n = 18; AAV‐NP n = 11; AAV‐HL, ‐mHL1, ‐mHL2 n = 7 mice per group, technical duplicates). Dotted line indicates the limit of detection (LOD) at a dilution of 1:100. Mean ± SD.
Regression analysis of total AAV9‐vector IgG ELISA titers and MN50 titers. Coefficient of correlation (r 2) and P‐value are shown.
Total IgG ELISA titers expressed as AUC against homologous Cal/7/9 virus in pre‐challenge serum pools (AAV‐HA, ‐cHA, ‐GFP, WIV n = 18; AAV‐NP n = 11; AAV‐HL, ‐mHL1, ‐mHL2 n = 7 mice per group, technical duplicates) of the indicated vaccine groups. Mean ± SD.
Immunofluorescence microscopy staining of MDCKII cells 48 h after transfection with pAAV plasmids expressing the indicated constructs. Cells were fixed, permeabilized, and stained with the indicated mouse pre‐challenge serum pools or with anti‐V5‐tag antibody groups (n = 2, technical duplicates) (bar, 50 μm).
Immunoblot analysis with lysates obtained from 293T 48 h after transfection with pAAV plasmids expressing the indicated constructs. Immunoblot was performed with the indicated pre‐challenge mouse serum pools (top, AAV‐HA n = 18, AAV‐HL, ‐mHL1, ‐mHL2 n = 7 mice per group). Hereafter, membranes were stripped and stained with anti‐V5‐tag antibody (bottom). Position of detected protein bands is indicated to the right (bottom).
Immunofluorescence microscopy staining of MCDKII cells 24 h after transfection with wild‐type Cal/7/9 NP or HA and mHL1 plasmids with pre‐challenge serum from AAV‐NP or AAV‐mHL1 + NP immunization groups (n = 2, technical duplicates) (bar, 50 μm).
IgA ELISA titers against Cal/7/9 or PR8 virus in pooled pre‐challenge sera (AAV‐HA, ‐cHA, ‐GFP, WIV n = 18; AAV‐NP n = 11 mice per group, technical duplicates). Mean ± SD.
IgA ELISA titers in post‐challenge lung homogenates of individual mice of the Cal/7/9 and PR8 low‐dose challenge groups of the indicated vaccine groups against PR8. Statistical significance between vaccine groups was determined using Kruskal–Wallis test with Dunn's multiple comparison testing (**P < 0.01, ***P < 0.001). Lines indicate mean. ELISAs were done in technical duplicates.
- A
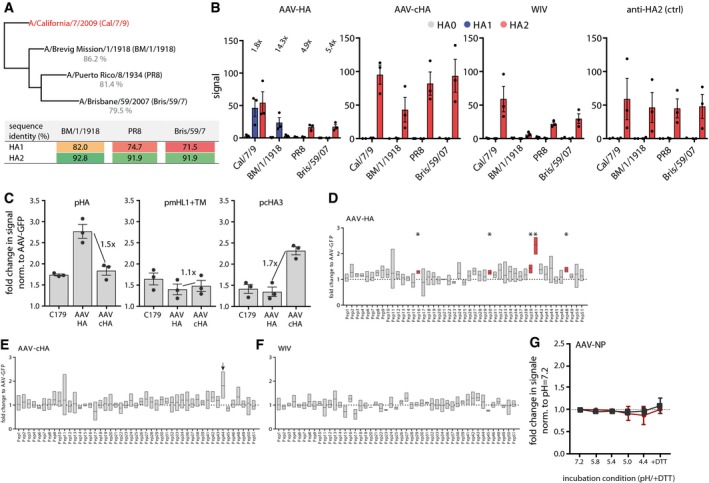
Phylogenetic tree of the complete HA sequences of the four H1N1 viruses used for immunoblot analysis with mouse serum. The table shows the amino acid identities of the H1N1 viruses HA1 or HA2 subdomain compared to Cal/7/9 HA1 and HA2, respectively, as determined with Geneious 11.1.5 software.
- B
Quantification of immunoblot data as shown in Fig 3A. Intensities of bands were analyzed using ImageJ. Dots indicate individual experiments, bars mean ± SE (n = 3). Numbers in the AAV‐HA panel indicate fold‐change of signal of the HA2 band of the AAV‐HA compared to the AAV‐cHA group.
- C
In‐cell ELISA with transfected MDCKII cells expressing either Cal/7/9 full‐length HA (pAAV‐HA), the HA‐stalk (pAAV‐mHL1 + transmembrane region), or chimeric HA consisting of the Cal/7/9 HA stalk and the H13 HA head (pcHA3). Detection of the HA constructs was done with indicated mouse serum at a 1:250 dilution or with the conformational stalk antibody C179. Dots indicate individual experiments, bars mean ± SE (n = 3, technical triplicates). Numbers indicated the fold‐change of signal between AAV‐HA and AAV‐cHA groups tested against the indicated HA construct.
- D
Results of 15‐mer Cal/7/9 peptide screen with AAV‐HA pooled pre‐challenge serum (n = 18 mice). Peptides were coated in 96‐well plates, incubated with serum before binding was detected with a HRP‐coupled secondary antibody. Data are shown as fold induction over AAV‐GFP signal intensity (n = 3, technical duplicates). Statistical significance between each peptide signal and the baseline value 1 (dotted line) was determined using one‐sample t‐test (*P < 0.05). Floating bars represent mean ± range.
- E, F
Results of epitope screen with 15‐mer peptides with pooled AAV‐cHA and WIV sera (n = 18 mice per group). For AAV‐cHA, peptide #44, showing increased but non‐significant binding, is indicated by an arrow. Statistical significance between each peptide signal and the baseline value 1 (dotted line) was determined using one‐sample t‐test. Floating bars represent mean ± range (n = 3, technical duplicates).
- G
Binding of AAV‐NP pre‐challenge sera (n = 11 mice) to Cal/7/9 or PR8 virus after incubation of the virions at pH = 7.2, 5.8, 5.4, 5.0, 4.4 or 4.4 + DTT. Bars represent mean ± SD (n = 3).
- A
Immunoblot analysis of purified H1N1 viruses A/California/7/2009 (Cal/7/9), A/Brevig Mission/1/1918 (BM/1/1918), A/Puerto Rico/8/1934 (PR8), or A/Brisbane/59/2007 (Bris/59/7) separated under reducing and denaturing conditions. Uncleaved HA0 and cleavage products HA1 and HA2 were detected with pooled pre‐challenge sera (AAV‐HA, ‐cHA, ‐GFP, WIV n = 18, AAV‐NP n = 11) as indicated (n = 3).
- B
Significant peptides identified in the epitope screen with AAV‐HA pooled pre‐challenge serum ((AAV‐HA, ‐cHA, ‐GFP, WIV n = 18, AAV‐NP n = 11; data shown in Fig EV2) were mapped onto HA1 (red) and HA2 (blue) of the trimeric HA (PDB 3UBE generated with PyMol) (n = 3, technical duplicates). The position of the RBS (yellow) and the C179 epitope (dashed line) is marked.
- C–F
Binding of C179 (C), or antibodies present in AAV‐HA (D), AAV‐cHA (E), or WIV (F) pooled pre‐challenge sera (n = 18 mice per group) to Cal/7/9 or PR8 virus after incubation of the virions at pH = 7.2, 5.8, 5.4, 5.0, 4.4 or 4.4 + DTT to induce conformational changes in HA or remove the HA1 subdomain. Mean ± SD (n = 3, in technical triplicates). Statistical significance between pH = 7.2 and other conditions was determined using Kruskal–Wallis test with Dunn's multiple comparison testing (*P < 0.05, **P < 0.01).
- A
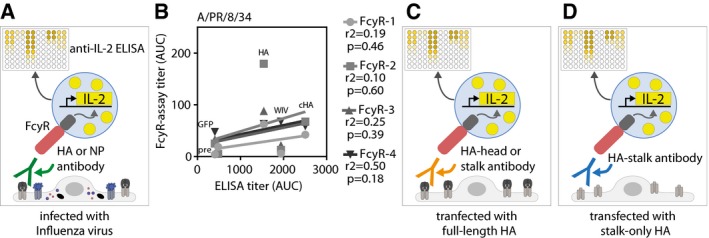
Scheme of FcγR assay setups used to detect FcγR‐activating antibodies against all viral proteins. MDCKII cells were either infected with influenza virus before pre‐challenge sera and FcγR‐reporter cells were added. Upon activation of the FcγR, IL‐2 is produced within the FcγR‐reporter cell, which is quantified by anti‐IL‐2 ELISA.
- B
Correlation between total influenza IgG ELISA titers and FcγR‐activating antibody titers against PR8 virus. Coefficient of correlation (r 2) and P‐value is shown for each receptor.
- C, D
Scheme of FcγR assay setups used to detect FcγR‐activating antibodies against the complete HA protein (C) or the HA‐stalk domain (D). Uninfected MDCKII cells were transfected with wild‐type HA (pAAV‐HA) or a stalk‐only construct (pAAV‐mHL1 + transmembrane region) before pre‐challenge sera and FcγR‐reporter cells were added. Upon activation of the FcγR, IL‐2 is produced within the FcγR‐reporter cell, which is quantified by anti‐IL‐2 ELISA.
- A, B
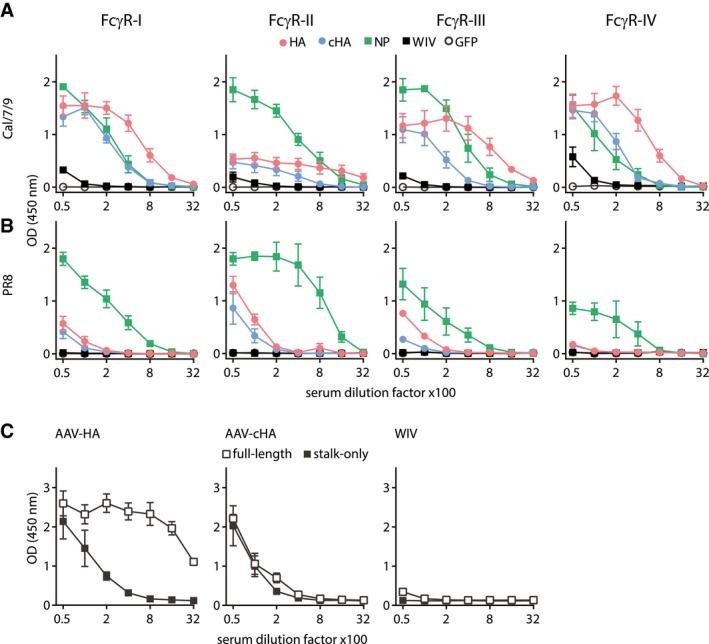
Influenza virus‐specific activation of the murine FcγRI, FcγRII, FcγRIII, and FcγRIV by antibodies in pooled pre‐challenge sera (AAV‐HA, ‐cHA, ‐GFP, WIV n = 18, AAV‐NP n = 11 mice per group). MDCKII cells were infected with Cal/7/9 (A) or PR8 (B) before mouse serum and FcγR‐expressing reporter cells were added. Influenza‐specific Fc‐FcγR interaction induces the production of IL‐2 in the FcγR‐expressing reporter cell, which was measured by anti‐IL2 ELISA (n = 3, technical duplicates). Mean ± SE.
- C
HA‐specific activation of FcγR by AAV‐HA, AAV‐cHA, or WIV pooled pre‐challenge sera (n = 18 mice per group). MDCKII cells were transfected with wild‐type HA (pAAV‐HA) or a stalk‐only HA (pAAV‐mHL1) before mouse serum and FcγR‐I‐expressing reporter cells were added (n = 2, technical duplicates). Mean ± SE.
- A–F
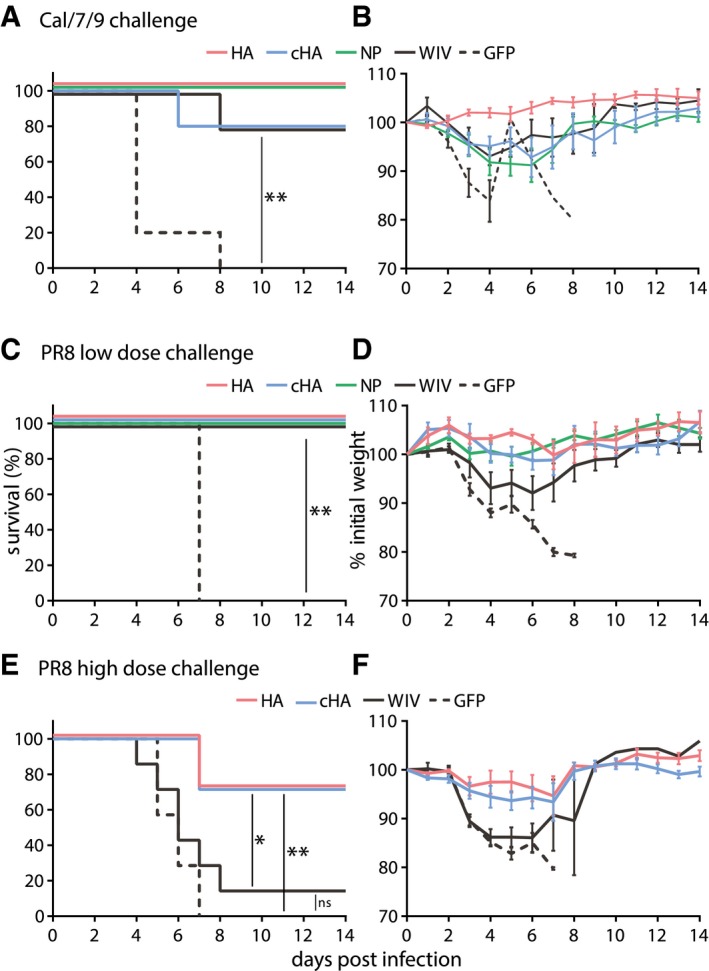
Mice were vaccinated three times with AAV vectors or two times with WIV and then challenged with a lethal dose of homologous influenza virus (Cal/7/9) (A, B; n = 5) or two different lethal doses of the heterologous PR8 strain (C, D; n = 6 and E, F; n = 7). Survival was monitored over a 14‐day period and is depicted as Kaplan–Meier plot (A, C, E). Weight loss was determined during the 14‐day period, which is shown in relation to the weight at day 0 (B, D, F). Mean ± SE. Statistical significance between negative control group (AAV‐GFP) or WIV group (E), and each vaccine group was determined using log‐rank (Mantel–Cox) test (*P < 0.05, **P < 0.01).
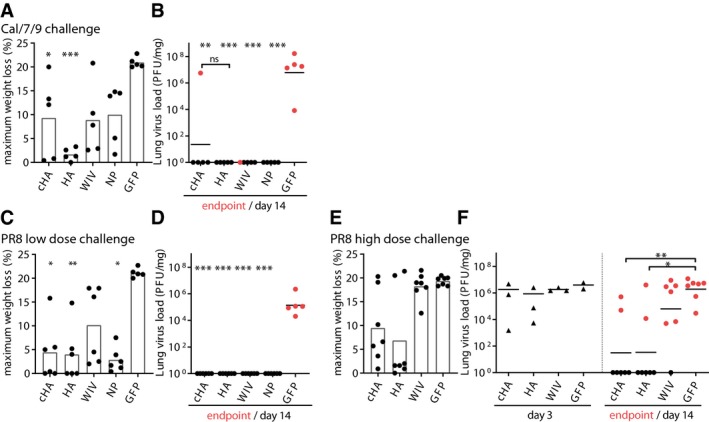
- A, B
Maximum weight loss during challenge period, and lung virus load at the individual endpoint (red points) or 14 days post‐infection (black points) with Cal/7/9 (n = 5 mice per group).
- C, D
Maximum weight loss during challenge period (C), and lung virus load at the individual endpoint (red points) or day 14 post‐infection (black points) (D) with the lower dose of PR8 9 (n = 6 mice per group).
- E, F
Maximum weight loss during challenge period (E, n = 7 mice per group), and lung virus load at day 3 post‐infection (black triangles) or at the individual endpoint (red points) or 14 days post‐infection (black points) (F, day 3 n = 3 mice per group, endpoint/day 14 n = 7 mice per group) with the higher dose of PR8.
- A
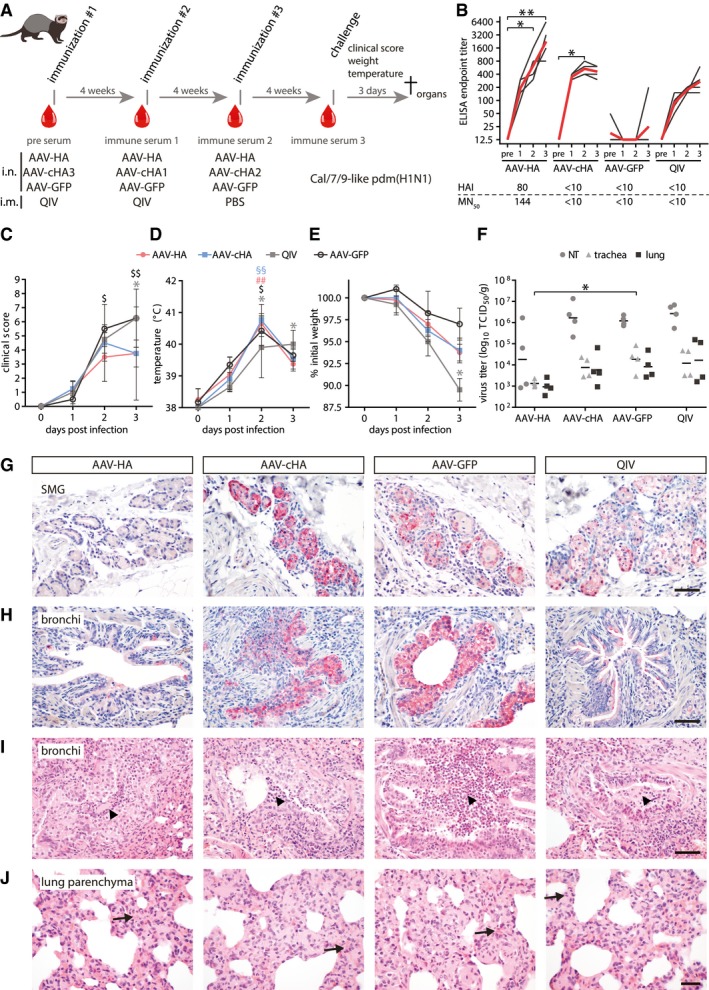
Ferrets (n = 4 per group) were immunized with AAV vectors or quadrivalent inactivated vaccine (QIV). Serum was obtained at indicated time points (red drops). After challenge with a Cal/7/9‐like (H1N1)pdm strain clinical signs, temperature and weight loss were monitored. At 3 dpi, animals were sacrificed and necropsied.
- B
Cal/7/9‐specific serum antibody titers in individual sera at indicated time points. Black lines: individual animals, red lines: mean titer. Statistical significance between pre‐immune and immune sera was determined using Friedman test with Dunn's multiple comparison testing (*P < 0.05, **P < 0.01). The lower table indicates Cal/7/9‐specific MN50 and HAI mean titers. Assays were performed in technical duplicates.
- C–E
Clinical score (C), body temperature (D), and relative weight (E) during challenge period. Statistical significance between pre‐immune and immune sera was determined using Friedman test with Dunn's multiple comparison testing (AAV‐HA ## P < 0.01; AAV‐cHA §§ P < 0.01; AAV‐GFP $ P < 0.05; $$ P < 0.01; QIV *P < 0.05). Mean ± SD.
- F
Virus titers in nasal turbinates (NT), trachea, or lung homogenates. Statistical significance between AAV‐GFP and vaccine groups was determined using Kruskal–Wallis test with Dunn's multiple comparison testing (*P < 0.05). Lines indicate the GMT. Assays were performed in technical duplicates.
- G, H
IHC staining of submucosal glands (SMG) (G) or bronchi (H) with an anti‐H1N1 polyclonal antibody (bar: 100 μm; red: influenza antigen (Neufuchsin); blue: nuclei (hematoxylin)).
- I, J
H&E‐stained histological sections of bronchi (I) and lung parenchyma with alveolar epithelial cells (AEC, J). Arrowheads: areas of suppurative bronchitis/bronchiolitis; arrows: interstitial pneumonia, necrosis of AEC (bar: (I) 100 μm; (J) 50 μm).
- A
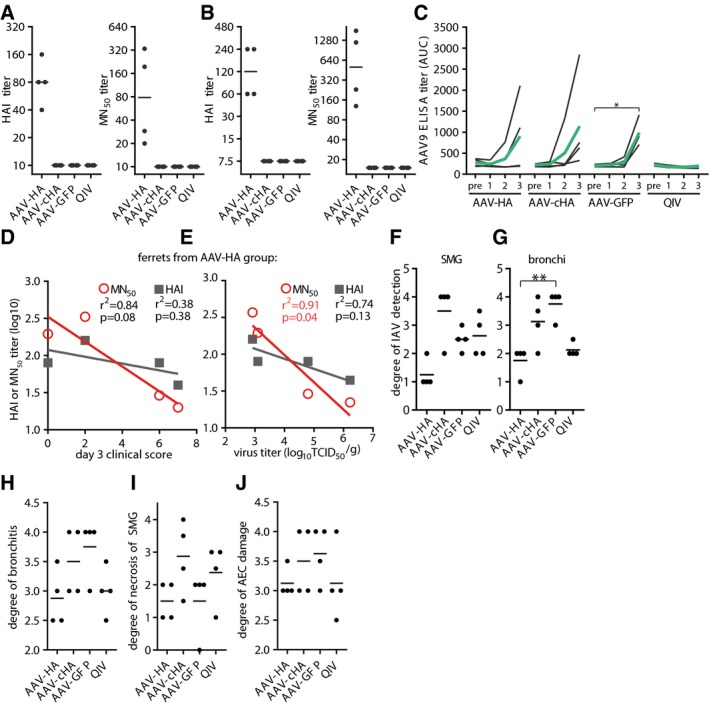
HAI and MN50 titers in individual ferret sera against Cal/7/9. Assay done in technical duplicates.
- B
HAI and MN50 titers of individual ferret sera against Michigan/45/2015 (H1N1)pdm. Assay done in technical duplicates.
- C
AAV9‐specific serum antibody titers in individual ferret sera at indicated time points. Black lines: individual animals, green lines: mean titer. Statistical significance between pre‐serum and immune serum 1, 2, or 3 was determined using Friedman test with Dunn's multiple comparison testing (*P < 0.05). Assay done in technical duplicates.
- D
Association between clinical score at 3 dpi and MN50 or HAI antibody titers of ferret of the AAV‐HA group.
- E
Association between virus titer in nasal turbinates and MN50 or HAI antibody titers of ferrets of the AAV‐HA group. Coefficient of correlation (r 2) and P‐value for correlations is shown. Symbols represent individual animals and the lines the linear regression curve.
- F, G
Scoring of IHC staining of influenza A virus antigen expression in submucosal glands (SMG) or bronchi of ferrets. Lines indicate mean. Statistical significance between AAV‐GFP group and other groups determined using Kruskal–Wallis test with Dunn's multiple comparison testing (**P < 0.01).
- H–J
Scoring of histo‐pathologic assessment of fixed lung tissue. Degree of bronchiolitis, necrosis of submucosal glands (SMG). and alveolar epithelial cells (AEC) were examined by board‐certified pathologists.
Comment in
-
Viruses to fight other viruses: the influenza vaccine case.EMBO Mol Med. 2020 May 8;12(5):e12059. doi: 10.15252/emmm.202012059. Epub 2020 Apr 22. EMBO Mol Med. 2020. PMID: 32320128 Free PMC article.
References
Publication types
MeSH terms
Substances
Grants and funding
LinkOut - more resources
Full Text Sources
Medical
