. 2020 Jun 1;130(6):3158-3171.
doi: 10.1172/JCI135460.

Inherited human IFN-γ deficiency underlies mycobacterial disease

Affiliations

Inherited human IFN-γ deficiency underlies mycobacterial disease

Gaspard Kerner et al. J Clin Invest. .

Abstract

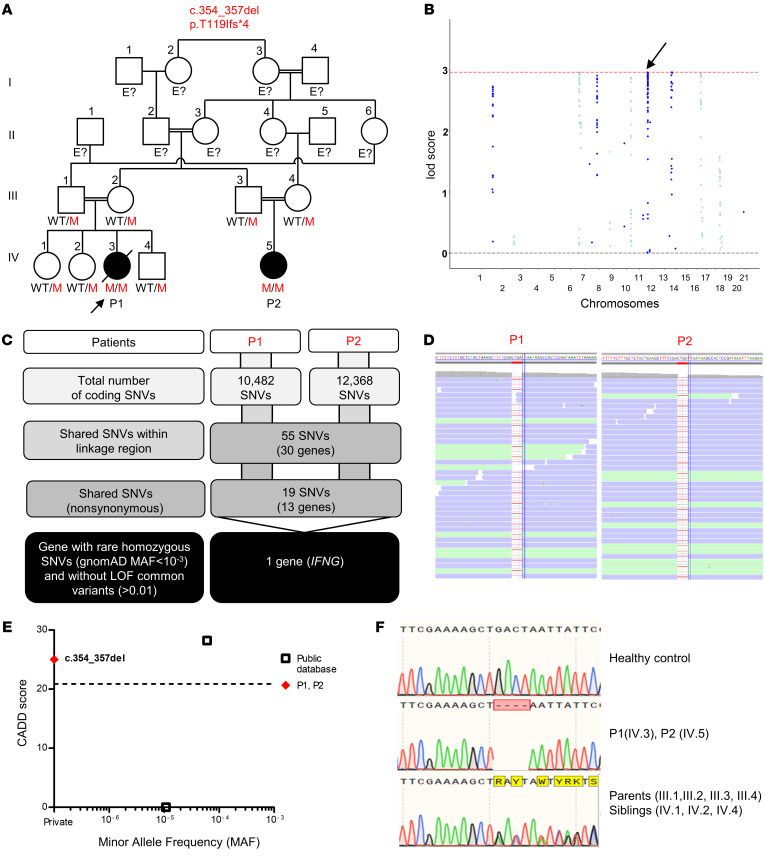
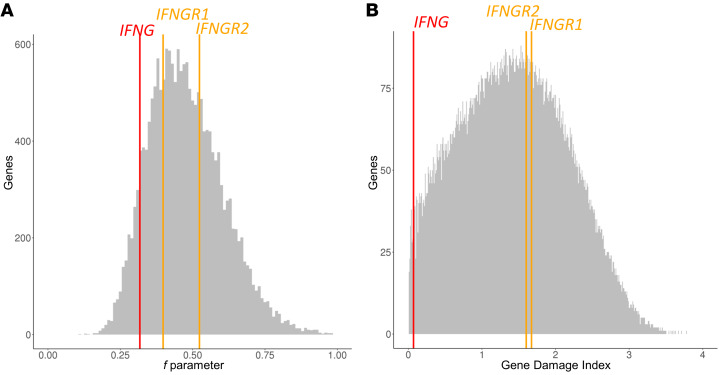
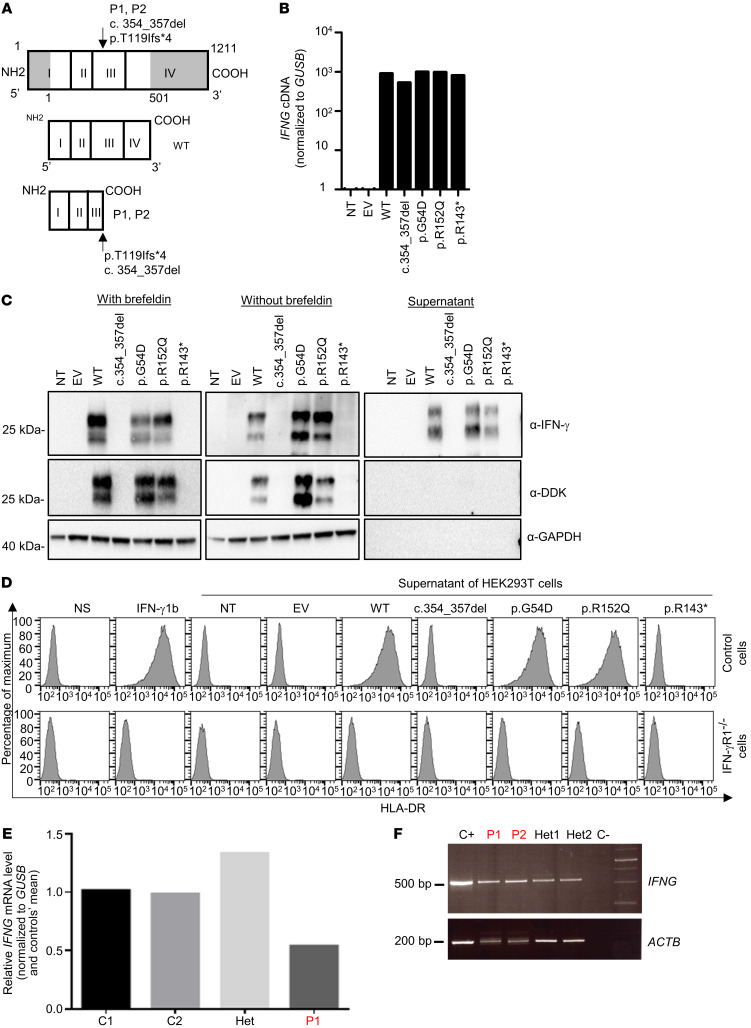
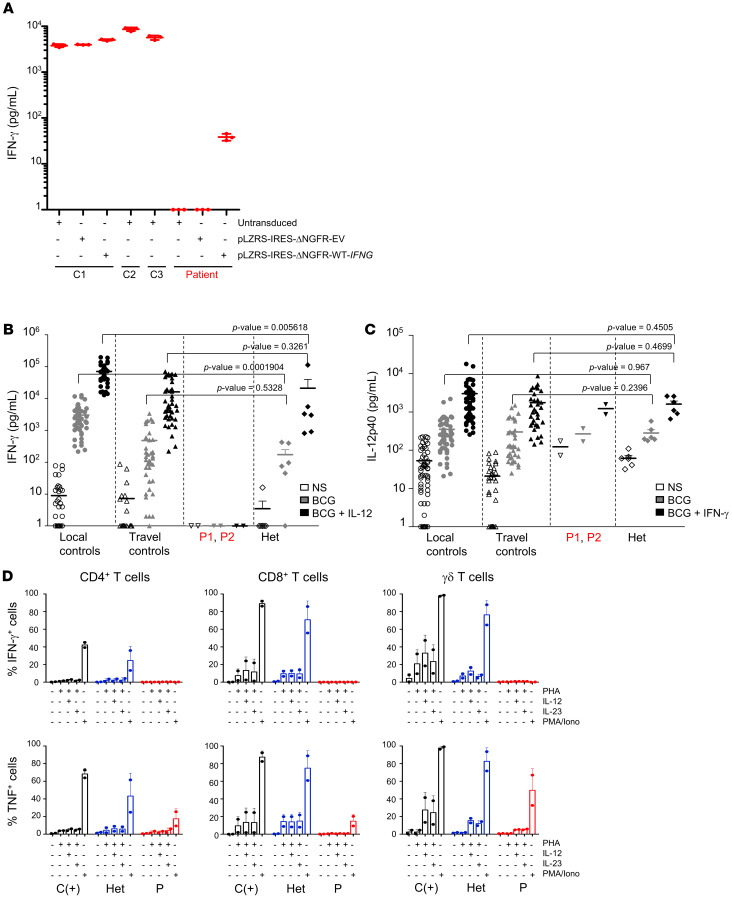
Mendelian susceptibility to mycobacterial disease (MSMD) is characterized by a selective predisposition to clinical disease caused by the Bacille Calmette-Guérin (BCG) vaccine and environmental mycobacteria. The known genetic etiologies of MSMD are inborn errors of IFN-γ immunity due to mutations of 15 genes controlling the production of or response to IFN-γ. Since the first MSMD-causing mutations were reported in 1996, biallelic mutations in the genes encoding IFN-γ receptor 1 (IFN-γR1) and IFN-γR2 have been reported in many patients of diverse ancestries. Surprisingly, mutations of the gene encoding the IFN-γ cytokine itself have not been reported, raising the remote possibility that there might be other agonists of the IFN-γ receptor. We describe 2 Lebanese cousins with MSMD, living in Kuwait, who are both homozygous for a small deletion within the IFNG gene (c.354_357del), causing a frameshift that generates a premature stop codon (p.T119Ifs4*). The mutant allele is loss of expression and loss of function. We also show that the patients' herpesvirus Saimiri-immortalized T lymphocytes did not produce IFN-γ, a phenotype that can be rescued by retrotransduction with WT IFNG cDNA. The blood T and NK lymphocytes from these patients also failed to produce and secrete detectable amounts of IFN-γ. Finally, we show that human IFNG has evolved under stronger negative selection than IFNGR1 or IFNGR2, suggesting that it is less tolerant to heterozygous deleterious mutations than IFNGR1 or IFNGR2. This may account for the rarity of patients with autosomal-recessive, complete IFN-γ deficiency relative to patients with complete IFN-γR1 and IFN-γR2 deficiencies.

Keywords: Genetic diseases; Genetics; Immunology.


Conflict of interest statement

Conflict of interest: The authors have declared that no conflict of interest exists.

Figures

Figure 1
Figure 1. IFN-γ deficiency.
(A) Pedigree of 2 related kindreds, showing familial segregation of the c.354_357del (p.T119Ifs*4) mutant (M) IFNG allele. The affected patients are represented by black circles, and an arrow indicates the proband. Each generation is designated by a roman numeral (I–IV). E?, individuals of unknown genotype. (B) Linkage analysis. (C) An analysis of WES data identified IFNG as a candidate MSMD gene carrying a rare homozygous mutation common to P1 and P2 within the linkage regions. SNVs, single nucleotide variants. (D) Alamut viewer presentation of the region of the genome containing the mutation, in the sense orientation, for P1 and P2. (E) CADD score and MAF of all homozygous coding variants previously reported in public databases (gnomAD v2.1 and TOPMED/BRAVO) (http://gnomad.broadinstitute.org; https://bravo.sph.umich.edu) and in our in-house (HGID) database. The dotted line corresponds to the MSC with its 95% CI. The c.354_357del mutation is shown as a red diamond. (F) Sanger sequencing of the region containing the IFNG mutation from a healthy control, patients, and the patients’ heterozygous relatives.
Figure 2
Figure 2. List of variants and strength of the purifying selection acting on IFNG.
Genome-wide distribution of the strength of purifying selection acting on genes, estimated by (A) the f parameter, for which lower values in the interval [0,1] correspond to stronger purifying selection, and (B) GDI rank, for which higher values correspond to highly tolerant genes, on bar plots for the IFNG, IFNGR1, and IFNGR2 genes. The positions of IFNG, IFNGR1, and IFNGR2 are indicated by 1 red arrow and 2 orange vertical bars, respectively.
Figure 3
Figure 3. Levels of RNA and protein produced from the IFNG allele in an overexpression system and in vitro characterization.
(A) Schematic representation of the WT protein and predicted proteins for P1 and P2. (B) qPCR on cDNA from HEK293T cells nontransfected (NT) or transfected with an empty plasmid (EV), WT-IFNG, or mutated IFNG. GUSB was used for normalization. The results shown are representative of 2 independent experiments. (C) Western blot analysis of IFN-γ in HEK293T cells left NT or that were transfected with an EV, WT-IFNG, or mutated IFNG, all inserted into p.CMV6 with a C-terminal DDK tag, with (left) or without (middle) brefeldin treatment and the addition of supernatants from HEK293T-transfected cells (right). The anti–IFN-γ antibodies used were a monoclonal mouse anti-IFN-γ antibody recognizing an N-terminal epitope between amino acids 20 and 50, and an antibody directed against the C-terminal DDK tag. An antibody against GAPDH (α-GAPDH) was used as a protein-loading control. The results shown are representative of 2 independent experiments. Different exposure times were used for each Western blot. (D) Induction of HLA-DR on SV-40 fibroblasts from a healthy control and from a patient with AR complete IFN-γR1 deficiency. Cells were activated with commercial IFN-γ or supernatants obtained from HEK293T cells transfected with different constructs. The results shown are representative of 2 independent experiments. (E) qPCR on cDNA from the HVS-T cells from healthy travel controls (C1 and C2), a heterozygous individual, and P1. GUSB was used for normalization. The results shown are representative of 2 independent experiments. (F) RT-PCR of exons 1–4 of the IFNG cDNA in PHA blasts from a healthy control (C+), 2 patients (P1 and P2), their relatives (Het1 and Het2), and a negative control (C–). The ACTB gene was used as a cDNA loading control.
Figure 4
Figure 4. Abolition of the production and secretion of IFN-γ by cells from the IFN-γ–deficient patients.
(A) IFN-γ secretion by controls (C1, C2, C3) and patient HVS-T cell lines untransduced or transduced with empty plasmid (pLZRS-IRES-ΔNGFR-EV) or WT-IFNG plasmid (pLZRS-IRES-ΔNGFR-WT-IFNG). The results shown are representative of 2 independent experiments. (B) Induction of IFN-γ secretion in a whole-blood assay for in-house (local) controls, travel controls, patients (P1 and P2), and heterozygous relatives (Het), following stimulation with live BCG alone or in combination with IL-12. (C) Induction of IL-12p40 secretion in a whole-blood assay for local controls, travel controls, patients (P1 and P2), and heterozygous relatives, following stimulation with live BCG alone or in combination with IFN-γ. NS, no stimulation. A nonparametric Wilcoxon test was performed for the data in B and C to calculate the P value between heterozygous relatives and controls (local or travel controls). (D) IFN-γ production by PHA-activated CD3+, CD4+, and CD8+ T cells from P1 and P2 and from a healthy donor in the absence of stimulation or following stimulation with PHA alone, PHA plus IL-12 or IL-23, or PMA-ionomycin (PMA/Iono) in the presence of brefeldin A.
Figure 5
Figure 5. Microbial exposure in the IFN-γ–deficient patients.
Antibody profiles of patients (P1, P2) and unrelated control subjects (HC2 and HC3 are healthy adult controls, whereas HC1 is a healthy pediatric control). Pooled plasma used for intravenous immunoglobulin (IVIg) therapy and IgG-depleted serum served as additional controls and were used for comparison. (A) Heatmap plot depicting score values equivalent to the count of significantly enriched peptides for a given species sharing less than a continuous 7-residue subsequence, the estimated size of a linear epitope. The species shown are those for which at least 1 of the patients had a score above the threshold set for this analysis (≥3). The color indicates the score values, with scores above the threshold shown in darker shades of blue. Max, maximum. (B) Result from a PCA of peptide enrichment score values above the significance threshold for at least 1 of the patients. More than 70% of the variance was accounted for by the first 2 components and separated the various controls (mockIP, IVIg, IgG-depleted), healthy controls (HC1, HC2, and HC3), and patients (P1 and P2, shown in red). PC1, principal component 1; PC2, principal component 2. (C) Scatter plots showing the contribution of the enriched peptides to the principal components (PC1 and PC2). Peptide groups from microbial species containing at least 3 differentially enriched nonhomologous peptides are shown in color.

References

    1. Casanova JL, Abel L. Genetic dissection of immunity to mycobacteria: the human model. Annu Rev Immunol. 2002;20:581–620. doi: 10.1146/annurev.immunol.20.081501.125851. - DOI - PubMed
    1. Bustamante J, Boisson-Dupuis S, Abel L, Casanova JL. Mendelian susceptibility to mycobacterial disease: genetic, immunological, and clinical features of inborn errors of IFN-γ immunity. Semin Immunol. 2014;26(6):454–470. doi: 10.1016/j.smim.2014.09.008. - DOI - PMC - PubMed
    1. Boisson-Dupuis S, et al. Inherited and acquired immunodeficiencies underlying tuberculosis in childhood. Immunol Rev. 2015;264(1):103–120. doi: 10.1111/imr.12272. - DOI - PMC - PubMed
    1. Zahid MF, et al. Recurrent salmonellosis in a child with complete IL-12Rβ1 deficiency. J immunodefic Disord. 2014;3:1000109. - PMC - PubMed
    1. de Beaucoudrey L, et al. Revisiting human IL-12Rβ1 deficiency: a survey of 141 patients from 30 countries. Medicine (Baltimore) 2010;89(6):381–402. doi: 10.1097/MD.0b013e3181fdd832. - DOI - PMC - PubMed

Publication types