. 2020 Mar 12;18(3):e3000647.
doi: 10.1371/journal.pbio.3000647. eCollection 2020 Mar.

Endosomal Wnt signaling proteins control microtubule nucleation in dendrites

Affiliations

Endosomal Wnt signaling proteins control microtubule nucleation in dendrites

Alexis T Weiner et al. PLoS Biol. .

Abstract

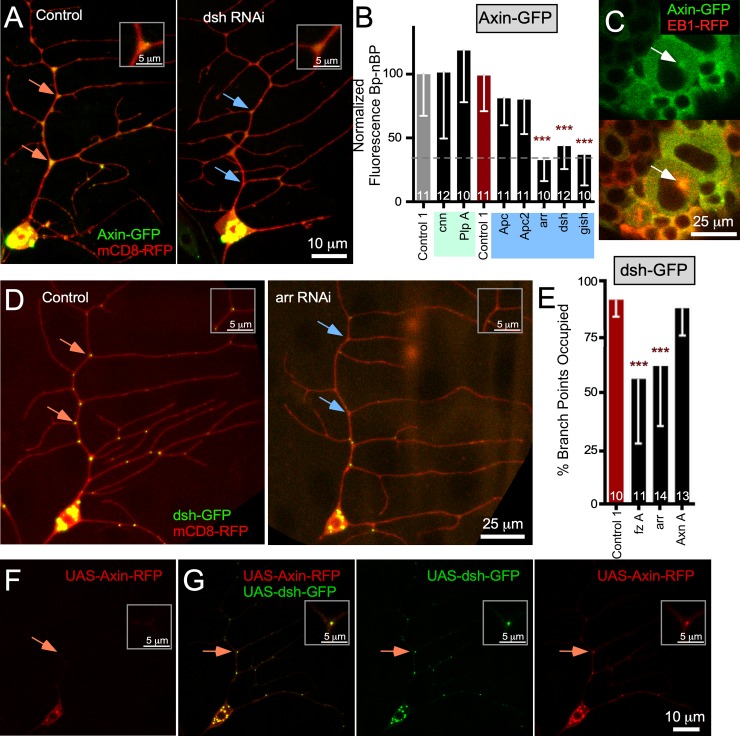
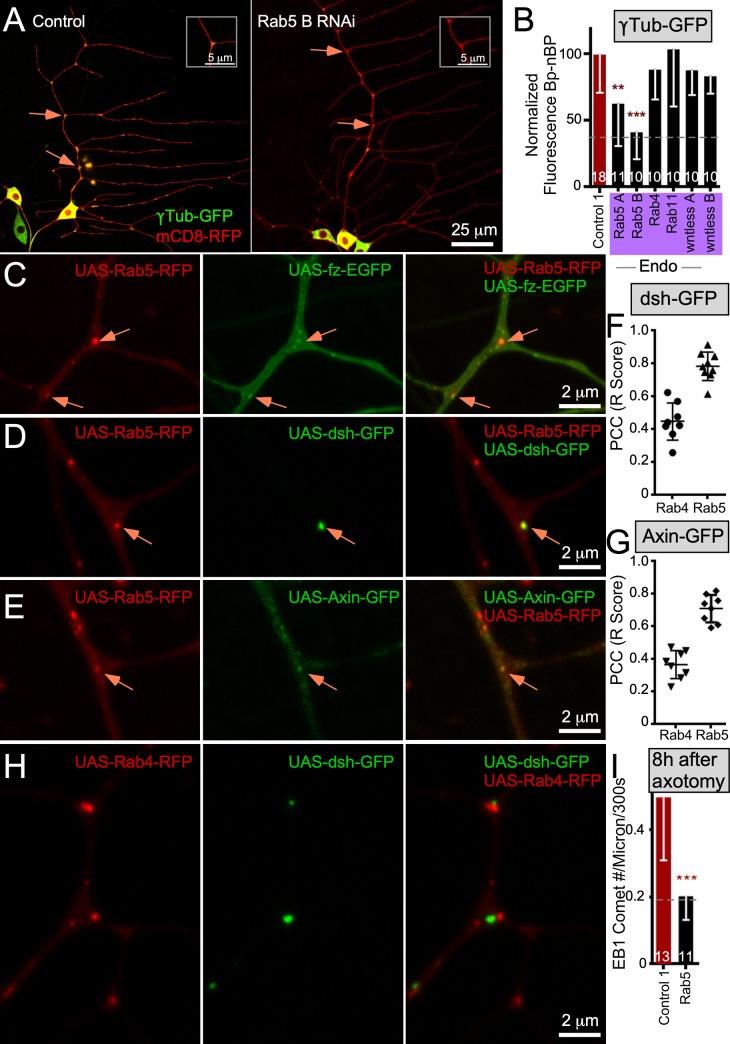
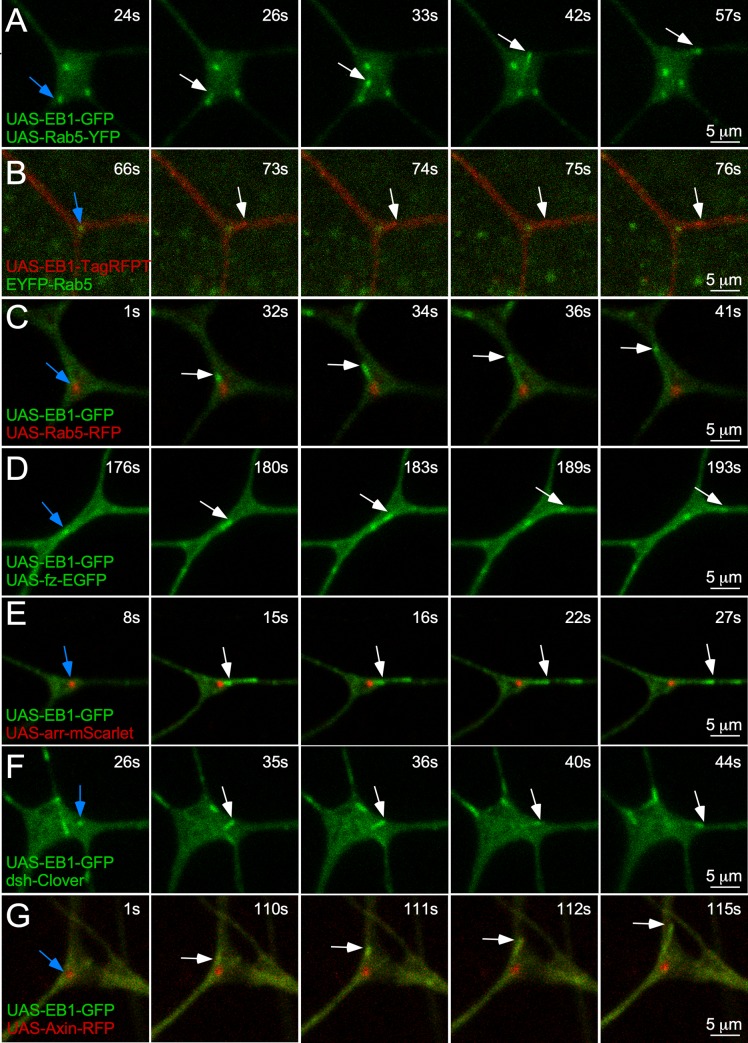
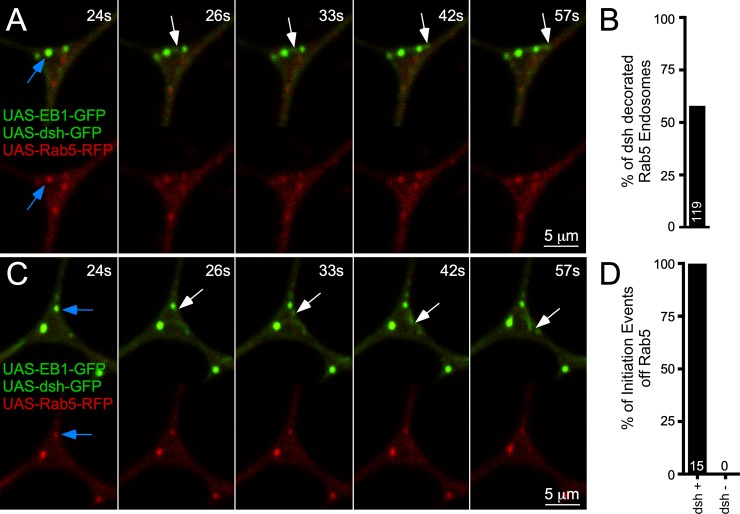
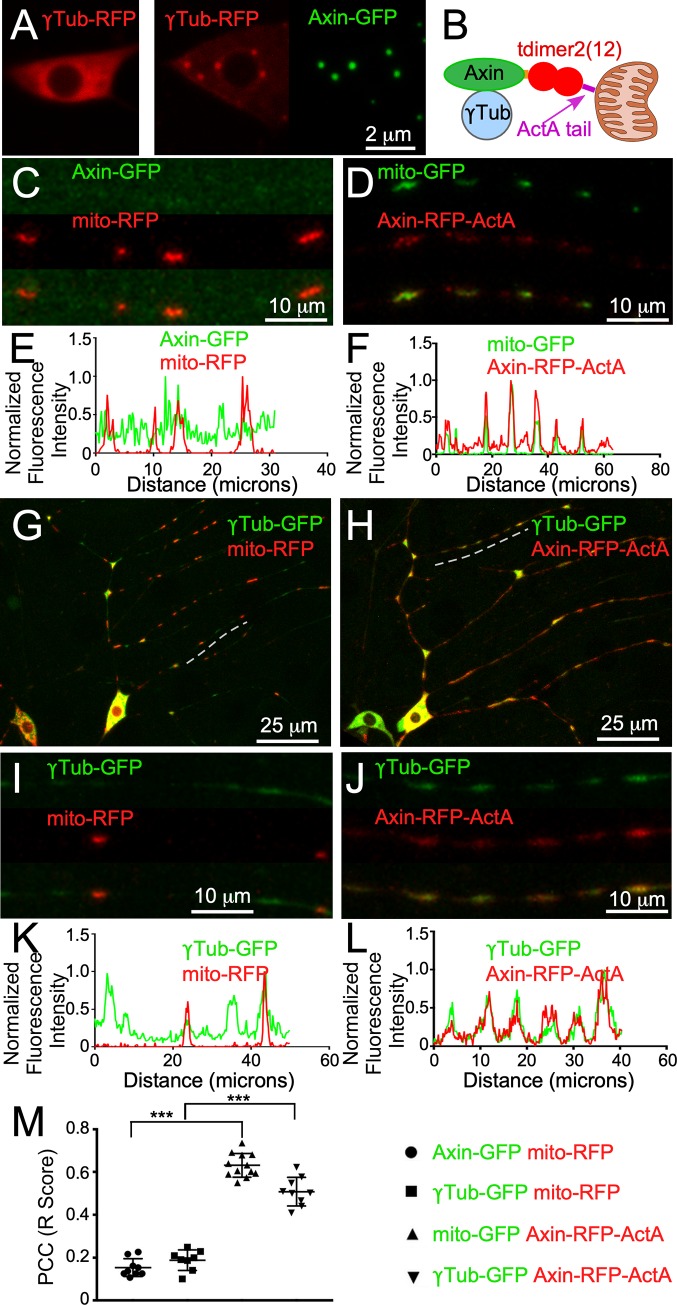
Dendrite microtubules are polarized with minus-end-out orientation in Drosophila neurons. Nucleation sites concentrate at dendrite branch points, but how they localize is not known. Using Drosophila, we found that canonical Wnt signaling proteins regulate localization of the core nucleation protein γTubulin (γTub). Reduction of frizzleds (fz), arrow (low-density lipoprotein receptor-related protein [LRP] 5/6), dishevelled (dsh), casein kinase Iγ, G proteins, and Axin reduced γTub-green fluorescent protein (GFP) at branch points, and two functional readouts of dendritic nucleation confirmed a role for Wnt signaling proteins. Both dsh and Axin localized to branch points, with dsh upstream of Axin. Moreover, tethering Axin to mitochondria was sufficient to recruit ectopic γTub-GFP and increase microtubule dynamics in dendrites. At dendrite branch points, Axin and dsh colocalized with early endosomal marker Rab5, and new microtubule growth initiated at puncta marked with fz, dsh, Axin, and Rab5. We propose that in dendrites, canonical Wnt signaling proteins are housed on early endosomes and recruit nucleation sites to branch points.


Conflict of interest statement

The authors have declared that no competing interests exist.

Figures

Fig 1
Fig 1. A candidate screen to identify proteins that target γTub-GFP to dendrite BPs.
(A) Example images of UAS-γTub-GFP localization in ddaE neurons expressing UAS-Rtnl2 RNAi (control 1) (VDRC 33320) and UAS-fz B RNAi (VDRC 43075) hairpins. Membranes were marked with UAS-mCD8-RFP to see cell shape. Orange arrows indicate BPs with high γTub-GFP signal, and blue arrows indicate BPs with low γTub-GFP signal. Insets in the top corner of each image show the top BP highlighted with an arrow in each image (B) Diagram summarizing data in the figure is shown. See also S1 Fig for information about BP and nBP quantitation. (C) Quantification of γTub-GFP at BPs is shown in larvae expressing different RNAi hairpins. Control 1 is Rtnl2 RNAi because Rtnl2 is thought to be a pseudogene. Control 2 is γTub37C RNAi. This isoform of γTub is maternally deposited and not expressed in somatic cells like neurons. Values were generated by subtracting mean nBP fluorescence from BP fluorescence for each cell; normalized fluorescence values are shown. Normalization values were generated by making the control value equal to 100. The normalization constant was then used to normalize each sample from every other genotype. Additionally, each sample in the control is also normalized to this value. A dashed line indicates where a soluble GFP control is used to show baseline BP localization due to the difference in size and shape from nBB regions. This dashed line will continue throughout the rest of the figures that show γTub-GFP or Axin-GFP. Shaded colors over x-axis names indicate which functional groups the RNAi lines belong to and are noted as pink for mitochondria (S1 Fig), yellow for Ankyrin2 and Neuroglian (S1 Fig), purple for branched-actin regulators (S1 Fig), blue for wnt signaling, and green for centrosomal proteins. Color codes will follow throughout the rest of the figures. Gray bars are controls done on an Olympus FluoView1000; the same control data sets are shown in S1 Fig for reference. The red bars indicate a control performed on a Zeiss LSM800; the same control data set is shown in S1 Fig. (D) Example images of yw (control) and fzF31/fzP21 animals expressing UAS-γTub-GFP and UAS-mCD8-RFP with the promoter IGI-Gal4 to drive expression in class I da neurons. Orange arrows indicate BPs with high γTub-GFP signal, and blue arrows indicate BPs with low γTub-GFP signal. Insets in the top corner of each image indicate the top BP marked in each image. (E) Quantification of BP-nBP fluorescence as carried out before. Throughout the figures, data from the Olympus are on the left, and data from the Zeiss are on the right. Refer to S1 Table for all genotypes and S1 Data for data used to generate graphs in (C) and (E). Sample sizes are shown within the bars. Error bars indicate standard deviation. A linear regression was used to determine statistical significance. *p < 0.05, **p < 0.01, ***p < 0.001. γTub, γTubulin; Apc, adenomatous polyposis coli; arm, armadillo; arr, arrow; Axn, Axin; BP, branch point; CK1, casein kinase I; cnn, centrosomin; Cyto, cytoplasmic; da neuron; dendritic arborization neuron; dda, dorsal dendritic arborization; Df, deficiency; dsh, dishevelled; fz, frizzled; Gα, G protein alpha subunit; GFP, green fluorescent protein; gish, gilgamesh; nBP, non–branch point; Plp, Pericentrin-like protein; RFP, red fluorescent protein; RNAi, RNA interference; Rtnl2, reticulon 2; sgg, shaggy; stan, starry night; UAS, upstream activating sequence; Vang, Van Gogh; VDRC, Vienna Drosophila Resource Center; yw, yellow, white.
Fig 2
Fig 2. arr and fz act upstream of dsh, which is sufficient to recruit Axin to BPs.
(A) Example images of ddaE neurons expressing UAS-Axin-GFP, UAS-mCD8-RFP, and either UAS-Rtnl2 RNAi (control 1) (VDRC 33320) or UAS-dsh RNAi (VDRC 101525) transgenes. Orange arrows indicate BPs with high Axin-GFP signal, and blue arrows indicate BPs with low signal. Insets in the top corner of each image indicate the top BP indicated in each image (B) Quantification Axin-GFP BP-nBP normalized fluorescence in ddaE neurons expressing different RNAi hairpins. (C) UAS-Axin-GFP and UAS-EB1-RFP were expressed using the pan neuronal driver elav Gal4. Live first instar larvae were mounted for imaging, and movies of neuroblasts in the brain were acquired (see S1 Movie). Still images from movies are shown. Centrosomes were identified as the site of EB1-GFP comet initiation and are identified with white arrows. (D) Example images of dsh-GFP and mCD8-RFP in neurons also expressing UAS-Rtnl2 RNAi (control 1) (VDRC 33320) and UAS-arr RNAi (BDSC 31473) transgenes. Orange arrows indicate BPs with high signal, and blue arrows indicate BPs with low signal; insets are as in other figures. (E) Quantification of dsh-GFP localization at BPs. BP occupancy was scored if there was a discrete dsh punctum present at each BP along the main branch of the comb dendrite. The number of cells (one per animal) is shown on the bars. Error bars indicate standard deviation. A linear regression was used to determine statistical significance. *p < 0.05, **p < 0.01, ***p < 0.001. (F) Representative image of UAS-Axin-RFP. (G) Panel of images showing UAS-Axin-RFP expressed with UAS-dsh-GFP using 221 Gal4. Refer to S1 Table for all genotypes and S1 Data for data used to generate graphs in (B) and (E). arr, arrow; Axn, Axin; BDSC, Bloomington Drosophila Stock Center; BP, branch point; dda, dorsal dendritic arborization; dsh, dishevelled; EB1, end-binding protein 1; fz, frizzled; GFP, green fluorescent protein; gish, gilgamesh; nBP, non–branch point; RFP, red fluorescent protein; RNAi, RNA interference; Rtnl2, reticulon 2; UAS, upstream activating sequence; VDRC, Vienna Drosophila Resource Center.
Fig 3
Fig 3. Wnt signaling proteins are required for minus-end-out microtubule polarity in dendrites.
(A) An overview of the ddaE neuron dendrite arbor is shown. The main trunk of the ddaE neuron used for EB1-GFP movies is highlighted. (B) The 300-second movies of EB1-GFP were acquired in the ddaE dorsal dendrites, and kymographs were generated in Fiji. Cells also expressed either UAS-Rtnl2 RNAi (control 1) (VDRC 33320) (left) or UAS-Axin RNAi (VDRC 7748) (right). (C) A summary of data in earlier figures as well as some previous data [27] is shown. (D) Quantification of EB1-GFP comet direction in the main trunk of the ddaE dendrite in animals expressing hairpin RNAi’s. The percentage of microtubules oriented plus-end-out is plotted as a summed value across all cells for each genotype. The numbers on each bar are total EB1-GFP comets counted, and at least 15 cells were analyzed for each genotype, with one cell per animal. Data in panel D were collected by two different individuals; the gray bar shows control data from one individual, and the red bar is from the other individual. Experimental genotypes analyzed by an individual were compared with their own control data, and significance stars are color-coded to indicate the comparisons. (E) Quantification of microtubule polarity from mutant and dominant-negative strains compared with control data without an RNAi transgene. A logistic regression was used to determine significance. *p < 0.05, **p < 0.01, ***p < 0.001. Refer to S1 Table for all genotypes and S1 Data for data used to generate graphs in (D) and (E). Ank2, Ankyrin 2; Arp2, actin related protein 2; Arpc4; actin related protein c4; arr, arrow; Axn, Axin; dda, dorsal dendritic arborization; EB1, end-binding protein 1; Gα, G protein alpha subunit; GDP, guanosine diphosphate; GFP, green fluorescent protein; Miro, mitochondrial rho; MT, microtubule; Nrg, Neuroglian; Plp, Pericentrin-like protein; RNAi, RNA interference; Rtnl2, reticulon 2; sgg, shaggy; UAS, upstream activating sequence; VDRC, Vienna Drosophila Resource Center.
Fig 4
Fig 4. Wnt signaling proteins are required for microtubule dynamics induced by axon injury.
(A) UAS-EB1-GFP was expressed in ddaE neurons with different RNAi hairpins. Axons were severed with a pulsed UV laser, and 400-second (1 frame per 2 seconds) movies were acquired immediately after injury and 24 hours after injury in the dendrite. These values were normalized to 300 seconds so as to more accurately compare them with data shown in (E) and (F). However, the quantification in (E) and (F) differs slightly than this set because of the set 10-μm length for each video. In (E) and (F), there is a variable 20- to 30-μm distance. With a set short distance of 10 μm, the probability of more comets passing through in the same given time is increased because of EB1 sustained run length. Individual frames from the movies are shown. (B) Quantification of EB1-GFP comets per micrometer and 300 seconds for all knockdowns immediately following injury and 24 hours after injury are shown in different RNAi backgrounds. The dashed line separates 0-hour from 24-hour measurements. The number of cells analyzed is noted on each bar. A linear regression was used to determine statistical significance. *p < 0.05, **p < 0.01, ***p < 0.001. (C) An overview of a ddaE neuron 8 hours after axon injury is shown. The axon stump is indicated with a red arrow. (D) Fiji-generated kymographs depicting microtubule dynamics 8 hours postaxotomy in UAS-Rtnl2 RNAi (control 1) (VDRC 33320) (left) and UAS-Axin RNAi (VDRC 7748) (right) are shown. (E) Quantification of microtubule dynamics (comet number per micrometer and 300 seconds) in animals in different knockdown conditions is shown. A dashed line indicates baseline, uninjured, control microtubule dynamics. This dashed line will continue throughout the figures that show microtubule dynamics. Gray and red control data were generated by two different individuals, and experimental data were compared with the control by the same individual as indicated by star color. (F) Quantification of microtubule dynamics in non-RNAi genetic backgrounds is shown. Error bars indicate standard deviation. A linear regression was used to determine statistical significance. *p < 0.05, **p < 0.01, ***p < 0.001. (G) A schematic summarizing the data in panels E and F is shown. Refer to S1 Table for all genotypes and S1 Data for data used to generate graphs in (B), (E), and (F). Ank2, Ankyrin 2; Arpc4, actin related protein c4; arr, arrow; ATPsynβ, ATP Synthase β; Axn, Axin; cnn, centrosomin; dda, dorsal dendritic arborization; dsh, dishevelled; EB1, end-binding protein 1; fz, frizzled; GFP, green fluorescent protein; Miro, mitochondrial rho; MT, microtubule; Nrg, Neuroglian; Plp, Pericentrin-like protein; RNAi, RNA interference; Rtnl2, reticulon 2; sgg, shaggy; UAS, upstream activating sequence; VDRC, Vienna Drosophila Resource Center.
Fig 5
Fig 5. Wnt signaling proteins localize to Rab5 endosomes.
(A) Example images of UAS-γTub-GFP localization in ddaE neurons expressing UAS-Rtnl2 RNAi (control 1) (VDRC 33320) and UAS-Rab5 RNAi (VDRC 34096) hairpins. Membranes were marked with UAS-mCD8-RFP to see cell shape. Orange arrows indicate BPs with high γTub-GFP signal, and blue arrows indicate BPs with low γTub-GFP signal. Insets in the top corner of each image show the top BPs highlighted with an arrow in each image. (B) Quantification of γTub-GFP at BPs is shown in larvae expressing different RNAi hairpins targeting endosomal proteins or a wnt secretion protein wntless. Values were generated by subtracting mean nBP fluorescence from BP fluorescence for each cell; normalized fluorescence values are shown. Sample sizes are shown within the bars. Error bars indicate standard deviation. A linear regression was used to determine statistical significance. *p < 0.05, **p < 0.01, ***p < 0.001. (C–E) Example colocalization image of UAS-Rab5-RFP coexpressed with UAS-fz-eGFP, UAS-dsh-GFP, or UAS-Axin-GFP. The orange arrows point to puncta of colocalization between the two markers in each case. For all colocalization experiments, sequential scanning was used to ensure no bleed through between the markers. (F and G) Plot of PCC between UAS-Rab4-RFP or UAS-Rab5-RFP with either UAS-dsh-GFP or UAS-Axin-GFP. The y-axis indicates the R score, with 1 being positive correlation, 0 meaning no correlation, and −1 meaning negative correlation. (H) Examples images of UAS-Rab4-RFP coexpressed with UAS-dsh-GFP. (I) Quantification of microtubule dynamics (comet number per micrometer and 300 seconds) following laser axotomy in control animals or animals expressing UAS-Rab5 RNAi (VDRC 34096). Error bars indicate standard deviation. A linear regression was used to determine statistical significance. *p < 0.05, **p < 0.01, ***p < 0.001. Refer to S1 Table for all genotypes and S1 Data for data used to generate graphs in (B), (F), (G), and (I). γTub, γTubulin; BP, branch point; dda, dorsal dendritic arborization; dsh, dishevelled; EB1, end-binding protein 1; eGFP, enhanced green fluorescent protein; fz, frizzled; GFP, green fluorescent protein; nBP, non–branch point; PCC, Pearson’s correlation coefficient; RFP, red fluorescent protein; RNAi, RNA interference; Rtnl2, reticulon 2; UAS, upstream activating sequence; VDRC, Vienna Drosophila Resource Center.
Fig 6
Fig 6. Microtubules can initiate growth from endosomes in dendrites.
(A–G) Example five-frame stills of microtubule comet formation off either Rab5 endosomes or wnt proteins. UAS-Rab5-GFP or UAS-Rab5-RFP are shown coexpressed with UAS-EB1-GFP. In addition, UAS-EB1-TagRFPT is shown expressed with endogenous EYFP-Rab5. UAS-fz-eGFP is shown coexpressed with UAS-EB1-TagRFPT. Finally, UAS-arr-RFP, endogenous dsh-Clover, and UAS-Axin-RFP are shown with UAS-EB1-GFP. In all examples, the first frame includes a blue arrow to show the endosome or wnt proteins off of which the microtubule comet will initiate. Subsequent frames track movement of the microtubule with a white arrow. The time stamp at the top-right corner correlates to the time point in the corresponding S4–S7, S10 and S11 Movies. arr, arrow; dsh, dishevelled; EB1, end-binding protein 1; eGFP, enhanced green fluorescent protein; EYFP, enhanced yellow fluorescent protein; fz, frizzled; GFP, green fluorescent protein; RFP, red fluorescent protein; UAS, upstream activating sequence.
Fig 7
Fig 7. Microtubules initiate from dsh-decorated early endosomes.
(A and C) Frames from two representative videos of a class I neuron expressing UAS-EB1-GFP, UAS-dsh-GFP, and UAS-Rab5-RFP. Top panels are the merged image, and bottom is the UAS-Rab5-RFP. A blue arrow is used to show the endosome from which an EB1 comet will initiate in subsequent frames, indicated with white arrows to track movement. The time stamp at the top-right corner correlates to the time point in the corresponding S13 and S14 Movies. (B) Quantification of the percentage of Rab5 endosomes that are labeled with UAS-dsh-GFP. Sample size is shown in the bar and indicates total number of Rab5-RFP puncta that were counted in branch points during 25 300-second videos. (D) Quantification of EB1 comet events that initiate from dsh-positive or dsh-negative Rab5 endosomes during the same 300-second videos. Sample size, which represents total comet number, is shown in the bar. Refer to S1 Table for all genotypes and S1 Data for data used to generate graphs in (B) and (D). dsh, dishevelled; EB1, end-binding protein 1; GFP, green fluorescent protein; RFP, red fluorescent protein; UAS, upstream activating sequence.
Fig 8
Fig 8. Axin is sufficient to localize γTub to ectopic cellular sites.
(A) Images show the localization of UAS-γTub-RFP in the cell body of a ddaE neuron when expressed alone (left) or when coexpressed with UAS-Axin-GFP (right) using the 221-Gal4 driver. (B) A diagram of the chimeric protein used to tag Axin with RFP (tdimer2[12]) and target it to mitochondria is shown. (C and D) Example images of enlarged regions within the secondary ddaE dendrites in cells expressing a mitochondrial marker and either UAS-Axin-GFP or UAS-Axin-RFP-ActA. (E and F) Fluorescence intensity measurements from line traces of the dendrite regions shown in (B) and (C). (G and H) UAS-γTub-GFP was coexpressed with either UAS-mito-RFP or UAS-Axin-RFP-ActA using 221Gal4. Overview images of the entire ddaE dendrite arbor are shown. (I and J) Enlarged images of the regions within the secondary ddaE dendrites, indicated by the dashed lines in (G) and (H). (K and L) Normalized fluorescence measurements from line tracings of the regions in (G) and (H). (M) A plot of the PCC for the four conditions (see the key to the right of the graph). The y-axis indicates the R score, with 1 being a positive correlation, 0 meaning no correlation, and −1 indicating a negative correlation. Refer to S1 Table for all genotypes and S1 Data for data used to generate graphs in (E), (F), (K), (L), and (M). γTub, γTubulin; ActA, actin assembly promoting protein A; dda, dorsal dendritic arborization; GFP, green fluorescent protein; Mito, mitochondrial; PCC, Pearson’s correlation coefficient; RFP, red fluorescent protein; UAS, upstream activating sequence.

Similar articles

Cited by

References

    1. Bartolini F, Gundersen GG. Generation of noncentrosomal microtubule arrays. Journal of cell science. 2006;119(Pt 20):4155–63. 10.1242/jcs.03227 . - DOI - PubMed
    1. Muroyama A, Lechler T. Microtubule organization, dynamics and functions in differentiated cells. Development. 2017;144(17):3012–21. 10.1242/dev.153171 - DOI - PMC - PubMed
    1. Sanchez AD, Feldman JL. Microtubule-organizing centers: from the centrosome to non-centrosomal sites. Curr Opin Cell Biol. 2017;44:93–101. 10.1016/j.ceb.2016.09.003 - DOI - PMC - PubMed
    1. Tillery MML, Blake-Hedges C, Zheng Y, Buchwalter RA, Megraw TL. Centrosomal and Non-Centrosomal Microtubule-Organizing Centers (MTOCs) in Drosophila melanogaster. Cells. 2018;7(9). 10.3390/cells7090121 - DOI - PMC - PubMed
    1. Gunawardena S, Goldstein LS. Cargo-carrying motor vehicles on the neuronal highway: transport pathways and neurodegenerative disease. Journal of neurobiology. 2004;58(2):258–71. 10.1002/neu.10319 . - DOI - PubMed

Publication types

MeSH terms