. 2020 Mar 12;18(3):e3000640.
doi: 10.1371/journal.pbio.3000640. eCollection 2020 Mar.

MKS-NPHP module proteins control ciliary shedding at the transition zone

Affiliations

MKS-NPHP module proteins control ciliary shedding at the transition zone

Delphine Gogendeau et al. PLoS Biol. .

Abstract

Ciliary shedding occurs from unicellular organisms to metazoans. Although required during the cell cycle and during neurogenesis, the process remains poorly understood. In all cellular models, this phenomenon occurs distal to the transition zone (TZ), suggesting conserved molecular mechanisms. The TZ module proteins (Meckel Gruber syndrome [MKS]/Nephronophtysis [NPHP]/Centrosomal protein of 290 kDa [CEP290]/Retinitis pigmentosa GTPase regulator-Interacting Protein 1-Like Protein [RPGRIP1L]) are known to cooperate to establish TZ formation and function. To determine whether they control deciliation, we studied the function of 5 of them (Transmembrane protein 107 [TMEM107], Transmembrane protein 216 [TMEM216], CEP290, RPGRIP1L, and NPHP4) in Paramecium. All proteins are recruited to the TZ of growing cilia and localize with 9-fold symmetry at the level of the most distal part of the TZ. We demonstrate that depletion of the MKS2/TMEM216 and TMEM107 proteins induces constant deciliation of some cilia, while depletion of either NPHP4, CEP290, or RPGRIP1L prevents Ca2+/EtOH deciliation. Our results constitute the first evidence for a role of conserved TZ proteins in deciliation and open new directions for understanding motile cilia physiology.


Conflict of interest statement

The authors have declared that no competing interests exist.

Figures
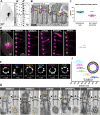
Fig 1
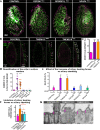
Fig 1. Localization of TZ proteins in Paramecium.
(A–C) Ciliation status in Paramecium. (A) Paramecia labelled by the monoclonal anti-glutamylated tubulin ID5 (decorating BB and cilia). Paramecium cortex presents different regions in which the BB pattern differs. BBs are organized in doublets in the invariant field region. The mixed field, highlighted here in light grey, presents interspersed BB singlets and doublets. The posterior region, in white, only possesses singlet BBs. A′ is a magnification of the surface view. A′′ is a transverse section showing that in the invariant field each BB of the doublet is ciliated, while in the mixed field only the posterior BB bears a cilium. Bars = 10 μm and 1 μm, respectively. (B) EM images showing a longitudinal section of two-BB units in the invariant field (left) and mixed field (right). The TZ (magenta arrow) is characterized by the presence of 3 successive layers indicated by yellow arrowheads. From bottom to top: the terminal plate, the intermediate plate, and the axosomal plate. Note that the unciliated BB in the mixed field shows a reduced TZ compared to ciliated ones. Bar = 200 nm. (C) Graph showing the mean length of the TZ of ciliated and unciliated basal bodies (>4 replicates). Ciliated BB counted: 100, nonciliated BB counted: 56. Ciliated TZ length: 136 nm and unciliated TZ length: 84 nm. Unpaired two-sided t test, ****p < 0.0001. Source data can be found in S1 Data. (D–G) Localization of Paramecium TZ proteins. (D) Paramecia expressing different TZ proteins fused with GFP. Cells were permeabilized before proceeding to immunostaining by ID5 (decorating BB and cilia in magenta) and a polyclonal anti-GFP (in green). Left panel: surface view of a Paramecium expressing TMEM216-GFP. Ciliated basal bodies of the invariant field (encircled in white) are stained by both GFP antibodies and ID5. In the other part of the cells, some basal bodies are labelled only by ID5. Right panels: confocal Z projections of ciliary rows, at the cell margin from TZ protein transformants. TMEM107-GFP, TMEM216-GFP, CEP290-GFP, and RPGRIP1L-GFP are localized only on the distal part of ciliated BBs. In addition, NPHP4-GFP can be observed at the BB proximal part. Note that ID5 antibodies better recognize short cilia. Bars = 10 μm and 1 μm. (E) Representative STED images revealing distinct localization patterns of several GFP-tagged TZ proteins. Cells were labelled with anti-GFP or ID5 (tubulin). A single ring differing in diameter is observed according to the observed protein. The mean diameters (distance between intensity maxima) and the number of BBs analyzed are given beneath each image, 2 replicates. (F) Graph (left) showing the mean diameter ± SD of each toroid labeled by each GFP tagged TZ protein (see B). Top right, schema representing the relative position of all toroids with respect to the position of tubulin and the ciliary membrane. Each TZ protein is shown in a different color. Source data can be found in S1 Data. (G) Representative EM images of the immunolocalization of the different GFP fusion proteins revealed by anti-GFP antibodies. Left panels: longitudinal views. Lower right panels: transverse sections of BBs at the level of the axosomal plate. Upper right panels: BB diagrams recapitulating the localization of gold beads. All these proteins, although they occupy different diameters in transverse views, are localized at the level of the axosomal plate indicated by a black arrowhead. TMEM107: 35 gold beads on 16 BB; TMEM216: 36 gold beads on 21 BB; CEP290: 11 gold beads on 10 BB; RPGRIP1L: 24 gold beads on 18 BB; NPHP4: 14 gold beads on 8 BB. Gold beads are highlighted in yellow. Bars: 200 nm. BB, basal body; CEP290, centrosomal protein of 290 kDa; EM, electron microscopy; GFP, green fluorescent protein; NPHP4, Nephronophtysis 4; RPGRIP1L, Retinitis pigmentosa GTPase regulator-Interacting Protein 1-Like Protein; STED, Stimulated Emission Depletion; TMEM216, Transmembrane protein 216; TZ, transition zone.
Fig 2
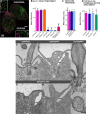
Fig 2. Ciliary pattern of paramecia depleted for TZ proteins.
(A) Ciliary pattern of paramecia treated with control RNAi or TZRNAi (CEP290, RPGRIP1L, and NPHP4). Cells were immunostained by the monoclonal anti-mono-glycylated tubulin TAP952 (magenta, cilia tip labelling) and the polyclonal anti-poly-glutamylated tubulin (polyE) antibodies (green, decorating BB and cilia). These TZ-protein–depleted paramecia display a ciliary pattern similar to that of control paramecia. (B) Control, TMEM107-depleted, and TMEM216-depleted paramecia stained for cilia using TAP952 (magenta) and the poly-E tubulin (green). Control paramecia show the usual ciliary pattern with long cilia (10 μm) and a few short growing cilia indicated by asterisks. A large increase in short (about 4 μm) or tiny cilia is observed in TMEM107- and TMEM216-depleted cells. Bar = 10 μm. (C) Bar plot showing the mean percentage of short cilia in Control (n = 60 cells, 3 independent replicates), TMEM107 (n = 50 cells, 3 independent replicates), and TMEM216-depleted (n = 42 cells, 3 independent replicates) cells. Error bars show the SEM. Statistical significance was assessed by an unpaired t test, two-sided p < 0.0001****. Source data can be found in S2 Data. (D–G) Ciliary shedding in TMEM107- or TMEM216-depleted cells. (D) Quantification of free cilia in culture medium: dot plot showing the number of free cilia found in the culture medium (about 10 microscope fields were analyzed per experiment; see Materials and Methods). Two independent replicates. Cilia were labelled using ID5 and poly-E antibodies. Error bars represent the standard deviation. Statistical significance was assessed by an unpaired t test. ***p = 0.0004, ****p < 0.0001. Source data can be found in S2 Data. (E) Effect of the increase of ciliary beating forces on ciliary shedding quantification of the mean number of bald cells (<25% cilia per cell) after 1 h in 10% PEG for control (n = 410 cells, 8 independent replicates), TMEM107RNAi (n = 316, 5 independent replicates), TMEM216RNAi (n = 303 cells, 5 independent replicates), CEP290RNAi (n = 291, 4 independent replicates), RPGRIP1LRNAi (n = 204, 3 independent replicates), and NPHP4RNAi (n = 196, 3 independent replicates). Errors bars represent the standard deviation. Statistical significance was assessed by unpaired two-sided χ2 test, ****p < 0.0001. Confidence interval 95% source data can be found in S2 Data. (F) Effect of inhibition of ciliary beating on ciliary shedding; quantification of the mean percentage of short cilia in Control (n = 60 cells, 2 independent replicates), TMEM216RNAi (n = 42 cells, 2 independent replicates), DNAH2RNAi (n = 15 cells, 2 independent replicates), and TMEM216-DNAH2RNAi (n = 16 cells, 2 independent replicates) paramecia. DNAH2RNAi cells present a percentage of short cilia slightly higher than the controls. Impairing ciliary beating of TMEM216RNAi cells by DNAH2 decreases this percentage. Statistical significance was assessed by unpaired two-sided t test. p-Values: *p = 0.0306, ****p < 0.0001. Source data can be found in S2 Data. (G) EM images of ciliary defects induced by TMEM107RNAi and TMEM216RNAi. ControlRNAi basal bodies showing a two-BB unit, with one unciliated and one ciliated BB. The length of the TZ is indicated by a red arrow. Cilia are either severed at the level of the axosomal plate as shown in TMEM107RNAi or have been severed and are in a regrowth process as in TMEM216RNAi. Note that the length of the TZ corresponds to the length of TZ of ciliated BB. BB, basal body; CEP290, centrosomal protein of 290 kDa; DNAH2, dynein axonemal heavy chain 2; NPHP4, Nephronophtysis 4; ns, nonsignificant; PEG, Polyethylene glycol; polyE, anti-poly-glutamylated tubulin; RNAi, RNA interference; RPGRIP1L, Retinitis pigmentosa GTPase regulator-Interacting Protein 1-Like Protein; TMEM216, Transmembrane protein 216; TZ, transition zone.
Fig 3
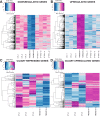
Fig 3. Transcriptomic analysis of TMEM216-depleted cells.
The heatmaps were generated by the “heatmaps.2” R function using the log2 normalized gene expression levels in the different conditions. The color keys are presented at the top left corner of each heatmap and show a color variation from dark blue to dark red according to the gene expression level. (A–B) Each line represents the expression level variation for one down-regulated gene (A) or up-regulated gene (B) when TMEM216 is depleted. The differential expression level of the genes between control biological replicates (first three columns) and TMEM216RNAi biological replicates (fourth and fifth column) is highlighted by the color variation. It is remarkable that these genes are not affected in IFT57-depleted cells (last four columns corresponding to the 4 biological replicates). (C–D) Comparison of the expression of genes differentially expressed (repressed [C] or up-regulated [D]) during the reciliation process [59] (called ciliary genes) with their expression in TMEM216RNAi and control cells. In C, the vast majority of the ciliary repressed genes are also repressed when TMEM216 is depleted. Likewise, the ciliary up-regulated genes are up-regulated in TMEM216RNAi. IFT57, intraflagellar transport 57; RNAi, RNA interference; TMEM216, Transmembrane protein 216.
Fig 4
Fig 4. Depletion of CEP290, NPHP4, or RPGRIP1L affects deciliation ability and ciliary shape.
(A–D) Depletion of CEP290, NPHP4, or RPGRIP1L affects deciliation ability. (A) Control and CEP290-depleted cells were simultaneously submitted to deciliation treatment (5% EtOH, 1 mM Ca2+) prior to labelling cilia (TAP952 in magenta, polyE in green). Control cells were previously marked by India ink ingestion allowing their identification. Cep290RNAi cells bear cilia, whereas control cells are completely bald. Bar = 10 μm. (B) Bar plot showing the mean percentages of bald cells (less than 25% of cilia) after deciliation for control (n = 421 cells), TMEM107RNAi (n = 290 cells), TMEM216RNAi (n = 258 cells), CEP290RNAi (n = 98 cells), RPGRIP1LRNAi (n = 302 cells), NPHP4RNAi (n = 82 cells), and the double TMEM107/RPGRIP1LRNAi (n = 141 cells; error bars represent the standard deviation); >3 independent replicates per condition. Statistical significance was assessed by unpaired χ2 test. ****Two-sided p < 0.0001. Source data can be found in S3 Data. (C) Bar plot showing the mean percentages of bald cells (less than 25% of cilia) for control (n = 53 cells), CEP290RNAi (n = 47 cells), and RPGRIP1LRNAi (n = 68 cells) after deciliation with 5 mM dibucaine. Error bars represent the standard deviation. Three replicates per condition. Statistical significance was assessed by unpaired χ2 test two-sided p-value. Source data can be found in S3 Data. (D) Bar plot showing the mean percentages of bald cells (less than 25% of cilia) for control (n = 222 cells), CEP290RNAi (n = 77 cells), RPGRIP1LRNAi (n = 77 cells), and NPHP4RNAi (n = 76 cells) after detergent extraction using 0.01% Triton X-100. Note that in these conditions, more than 80% of cells deciliate. Three replicates per condition. Source data can be found in S3 Data. (E–J) Depletion of CEP290, NPHP4, and RPGRIP1L affects ciliary shape. EM images of abnormal cilia found in NPHP4RNAi (F), RPGRIP1LRNAi (G, H), and CEP290RNAi (I, J). A control cilium is shown in longitudinal and transverse sections in panel A. In NPHP4- and RPGRIP1L-depleted cells, the link between the axoneme and the ciliary membrane is missing at the level of the TZ. Abnormal cilia present extension defects, and vesicles accumulate inside the cilia, probably resulting from a defective TZ gate function. In CEP290-depleted cells, abnormal cilia present a strikingly enlarged lumen, resulting most probably from altered ciliary gate function. Bar: 200 nm. CEP290, centrosomal protein of 290 kDa; EM, electron microscopy; NPHP4, Nephronophtysis 4; polyE, anti-poly-glutamylated tubulin; RNAi, RNA interference; RPGRIP1L, Retinitis pigmentosa GTPase regulator-Interacting Protein 1-Like Protein; TMEM107, Transmembrane protein 107; TZ, transition zone.

Similar articles

Cited by

References

    1. Goetz SC, Anderson KV. The primary cilium: a signalling centre during vertebrate development. Nat Rev Genet. 2010. May;11(5):331–44. 10.1038/nrg2774 - DOI - PMC - PubMed
    1. Reiter JF, Blacque OE, Leroux MR. The base of the cilium: roles for transition fibres and the transition zone in ciliary formation, maintenance and compartmentalization. EMBO Rep. 2012. June 29;13(7):608–18. 10.1038/embor.2012.73 - DOI - PMC - PubMed
    1. Williams CL, Li C, Kida K, Inglis PN, Mohan S, Semenec L, et al. MKS and NPHP modules cooperate to establish basal body/transition zone membrane associations and ciliary gate function during ciliogenesis. J Cell Biol. 2011. March 21;192(6):1023–41. 10.1083/jcb.201012116 - DOI - PMC - PubMed
    1. Huang L, Szymanska K, Jensen VL, Janecke AR, Innes AM, Davis EE, et al. TMEM237 is mutated in individuals with a Joubert syndrome related disorder and expands the role of the TMEM family at the ciliary transition zone. Am J Hum Genet. 2011. December 9;89(6):713–30. 10.1016/j.ajhg.2011.11.005 - DOI - PMC - PubMed
    1. Garcia-Gonzalo FR, Corbit KC, Sirerol-Piquer MS, Ramaswami G, Otto EA, Noriega TR, et al. A transition zone complex regulates mammalian ciliogenesis and ciliary membrane composition. Nat Genet. 2011. July 3;43(8):776–84. 10.1038/ng.891 - DOI - PMC - PubMed

Publication types