. 2020 Apr;24(8):4748-4761.
doi: 10.1111/jcmm.15147. Epub 2020 Mar 12.

Inhibition of Interleukin-6/glycoprotein 130 signalling by Bazedoxifene ameliorates cardiac remodelling in pressure overload mice

Affiliations

Inhibition of Interleukin-6/glycoprotein 130 signalling by Bazedoxifene ameliorates cardiac remodelling in pressure overload mice

Wei Shi et al. J Cell Mol Med. 2020 Apr.

Abstract

The role of IL-6 signalling in hypertensive heart disease and its sequelae is controversial. Our group demonstrated that Bazedoxifene suppressed IL-6/gp130 signalling in cancer cells but its effect on myocardial pathology induced by pressure overload is still unknown. We explored whether Bazedoxifene could confer benefits in wild-type C57BL/6J mice suffering from transverse aortic constriction (TAC) and the potential mechanisms in H9c2 myoblasts. Mice were randomized into three groups (Sham, TAC, TAC+Bazedoxifene, n = 10). Morphological and histological observations suggested TAC aggravated myocardial remodelling while long-term intake of Bazedoxifene (5 mg/kg, intragastric) attenuated pressure overload-induced pathology. Echocardiographic results indicated Bazedoxifene rescued cardiac function in part. We found Bazedoxifene decreased the mRNA expression of IL-6, MMP2, Col1A1, Col3A1 and periostin in murine hearts after 8-week surgery. By Western blot detection, we found Bazedoxifene exhibited an inhibition of STAT3 activation in mice three hours and 8 weeks after TAC. Acute TAC stress (3 hours) led to down-regulated ratio of LC3-Ⅱ/LC3-Ⅰ, while in mice after long-term (8 weeks) TAC this ratio becomes higher than that in Sham mice. Bazedoxifene inverted the autophagic alteration induced by TAC at both two time-points. In H9c2 myoblasts, Bazedoxifene suppressed the IL-6-induced STAT3 activation. Moreover, IL-6 reduced the ratio of LC3-Ⅱ/LC3-Ⅰ, promoted P62 expression but Bazedoxifene reversed both changes in H9c2 cells. Our data suggested Bazedoxifene inhibited IL-6/gp130 signalling and protected against cardiac remodelling together with function deterioration in TAC mice.

Keywords: Bazedoxifene; cardiac remodelling; interleukin-6; transverse aortic constriction.


Conflict of interest statement

The authors confirm that there are no conflicts of interest.

Figures

Figure 1
Figure 1
Morphological and hypertrophic molecular changes in heart tissues of mice. A, Representative images showing gross cardiac morphology of hearts from sacrificed mice after 4‐wk TAC. B, Gross cardiac morphology of hearts from sacrificed mice after 8‐wk TAC. C and D, Longitudinal sections of murine heart tissues stained with haematoxylin‐eosin at 4 (C) and 8 wk (D). E and F, Microscopic cross‐sections of 4‐ (E) and 8‐wk (F) TAC murine hearts stained with haematoxylin‐eosin and used for assessment of transverse cardiomyocyte area. G and H, Bar graphs showing the quantitative data for 4‐ (G) and 8‐week (H) transverse myocyte cross‐section area calculated by Image J. I and J, Bar graphs showing the mRNA expression of BNP in heart tissues from mice at 4 (I) and 8 wk (J). (n = 3 per group at 4 wk and n = 3‐4 per group at 8 wk) The relative abundance of mRNA expression or transverse myocyte area was quantified and normalized to GAPDH or that of Sham group. Data represent means ± SEM. The scale depicts 1mm for minimal interval in (A and B), 0.5mm for minimal interval in (C and D) and 20 μm in (E and F), respectively. *P < .05; **P < .01; ***P < .001
Figure 2
Figure 2
Calculation of HW, HW/BW and HW/TL of mice. A, Scatterplot showing the quantitative data for HW of mice at 4 wk. (n = 3‐4 per group) B, The ratio of HW/BW of mice at 4 wk. (n = 3‐4 per group) C, The ratio of HW/TL at 4 wk. (n = 3‐4 per group) D, HW of mice at 8 wk. (n = 6‐7 per group) E, The ratio of HW/BW of mice at 8 wk. (n = 6‐7 per group) F, The ratio of HW/TL at 8 wk. (n = 6‐7 per group) Scatterplot represents means ± SEM including individual data points. *P < .05; **P < .01; ***P < .001, “ns” stands for “None Significance”
Figure 3
Figure 3
Echocardiographic profiles of mice at 4 and 8 wk. A and H, Representative images from mice at 4 and 8 wk by Vevo 2100 software. B‐G, LVEF, LVESID, LVESV, LVFS, LVEDID and LVEDV of mice were assessed at 4 wk after the surgery. I‐N, echocardiographic parameters of mice evaluated at 8 wk after the surgery. (n = 4‐6 per group) Scatterplot represents means ± SEM including individual data points. *P < .05; **P < .01; ***P < .001, “ns” stands for “None Significance”
Figure 4
Figure 4
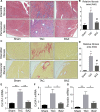
Bazedoxifene attenuated pressure overload‐induced LV fibrosis. LV tissues from mice after 8‐week surgery were sectioned and stained with Massion's trichrome (A and B) or picrosirius red (C and D). A‐D, scale bar, 200 μm, quantification of relative fibrosis area was performed by Image J, *P < .05 vs sham group; # P < .05 vs TAC group. E‐G, mRNA expression profiles of fibrosis‐related genes in murine hearts at 8 wk. The relative abundance of transcripts was quantified and normalized to GAPDH. (n = 3‐4 per group) Data represent means ± SEM. *P < .05; **P < .01
Figure 5
Figure 5
A, Representative images of immunohistochemical staining of IL‐6 (brown blots) in heart tissues of mice at 8 wk. The scale represents 100μm (left panel). Amplified images of the box depicting the staining of protein of interest (right panel). B, Bar graphs showing the mRNA expression of IL‐6 in heart tissues from mice at 8 wk. (n = 3‐4 per group) C, The mRNA expression of MMP2 in murine hearts at 8 wk. (n = 3‐4 per group) The relative abundance of transcripts was quantified and normalized to GAPDH. (*P < .05; **P < .01.) D and E, Western blots with quantification showing the expression of p‐STAT3 and LC3 in hearts of mice 3 h after surgery (n = 5‐6 per group). F and G, Western blots with quantification showing p‐STAT3 and LC3 expression in murine hearts 8 wk post‐TAC (n = 3‐4 per group). The relative expression of p‐STAT3 was quantified and normalized to that of GAPDH. The conversion of LC3 was quantified by the ratio of LC3‐Ⅱ/LC3‐Ⅰ. *P < .05 vs sham group; # P < .05 vs TAC group. Data represent means ± SEM
Figure 6
Figure 6
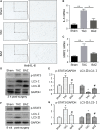
A and B, Bazedoxifene attenuated IL‐6‐stimulated cell hypertrophy in H9c2 myoblasts (A, scale bar, 20 μm). Bazedoxifene down‐regulated the transcripts of ANP and BNP induced by IL‐6 (B, n = 4). *P < .05 vs ctrl group; # P < .05 vs IL‐6 group without Bazedoxifene. C and D, Western blots with quantification showing the expression of p‐STAT3 in H9c2 cells stimulated by IL‐6 of 25 ng/mL at serial time‐points as indicated. E and F, after serum starvation H9c2 cells were treated without or with Bazedoxifene (10, 15, 20 μmol/L) for 2 h and then administrated with IL‐6 (25 ng/mL) in presence of Bazedoxifene for another 30 min. Bazedoxifene inhibited IL‐6‐induced STAT3 activation. G and H, Treated without or with Bazedoxifene (10, 15, 20 μmol/L) for 2 h, H9c2 cells were stimulated by IL‐6 (25 ng/mL) for another 30 min. IL‐6 trigger decreased ratio of LC3‐Ⅱ/LC3‐Ⅰ and promoted P62 expression. Bazedoxifene increased the ratio and down‐regulated expression of P62 in H9c2 cells. Quantitative data of p‐STAT3 or P62 were normalized to those of GAPDH. The conversion of LC3 was quantified by the ratio of LC3‐Ⅱ/LC3‐Ⅰ. Data of control group were set arbitrarily as 1. Data represent means ± SEM. *P < .05 vs ctrl group; # P < .05 vs IL‐6 group without Bazedoxifene
Figure 7
Figure 7
IL‐6 contributed to the response to AngⅡ in H9c2 cells. A and B, Western blots with quantification showing the expression of p‐STAT3 in H9c2 cells stimulated by AngⅡ of 100 nmol/L at serial time‐points as indicated. C and D, after serum starvation H9c2 cells were treated without or with Bazedoxifene (10, 15, 20 μmol/L) for 2 h and then administrated with AngⅡ (100 nmol/L) in presence of Bazedoxifene for another 30 min. Bazedoxifene suppressed AngⅡ‐induced STAT3 activation. (For B and D, *P < .05 vs ctrl group; # P < .05 vs AngⅡ group without Bazedoxifene) E and F, Inhibition of AngⅡ‐induced p‐STAT3 by sIL‐6R. Cells were cultured with AngⅡ (100 nmol/L) and sIL‐6R (15 ng/mL) simultaneously for 30 min as indicated. G and H, Effect of sIL‐6R of different concentration on IL‐6 signalling transduction. H9c2 cells were cultured with IL‐6 (25 ng/mL) and sIL‐6R (5, 10, 15, 25, 50 ng/mL) simultaneously for 30 min as indicated. Quantitative data of p‐STAT3 were normalized to those of GAPDH. Data of control group were set arbitrarily as 1. Data represent means ± SEM. (For F and H, *P < .05 vs ctrl group; # P < .05 vs AngⅡ or IL‐6 group without sIL‐6R; & P < .05 vs IL‐6 group without sIL‐6R)

Similar articles

Cited by

References

    1. Benjamin EJ, Virani SS, Callaway CW, et al. Heart disease and stroke statistics‐2018 update: a report from the American Heart Association. Circulation. 2018;137:e67‐e492. - PubMed
    1. Heidenreich PA, Albert NM, Allen LA, et al. Forecasting the impact of heart failure in the United States: a policy statement from the American Heart Association. Circ Heart Fail. 2013;6:606‐619. - PMC - PubMed
    1. Khatibzadeh S, Farzadfar F, Oliver J, et al. Worldwide risk factors for heart failure: a systematic review and pooled analysis. Int J Cardiol. 2013;168:1186‐1194. - PMC - PubMed
    1. Lyon RC, Zanella F, Omens JH, Sheikh F. Mechanotransduction in cardiac hypertrophy and failure. Circ Res. 2015;116:1462‐1476. - PMC - PubMed
    1. Torre‐Amione G. Immune activation in chronic heart failure. Am J Cardiol. 2005;95:3C‐8C; discussion 38C–40C. - PubMed

Publication types