. 2020 Mar 10;8(1):5.
doi: 10.3390/proteomes8010005.

Targeting a Subset of the Membrane Proteome for Top-Down Mass Spectrometry: Introducing the Proteolipidome

Affiliations

Targeting a Subset of the Membrane Proteome for Top-Down Mass Spectrometry: Introducing the Proteolipidome

Julian Whitelegge. Proteomes. .

Abstract

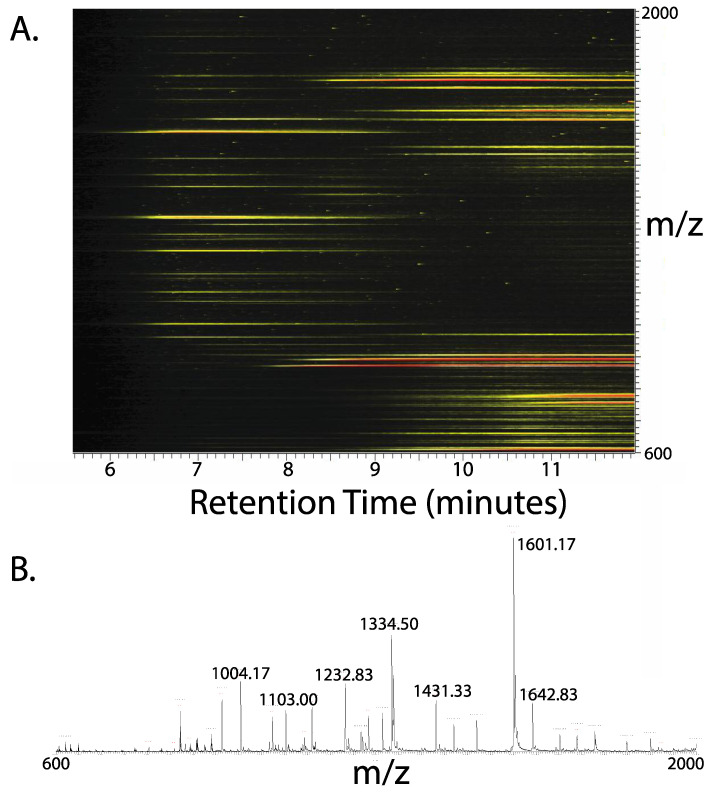
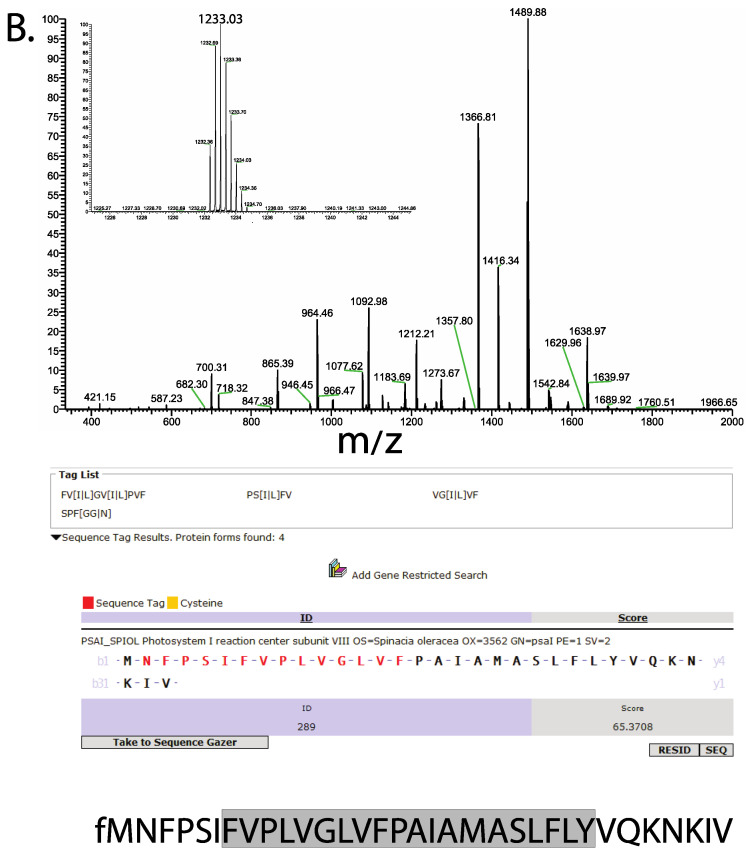
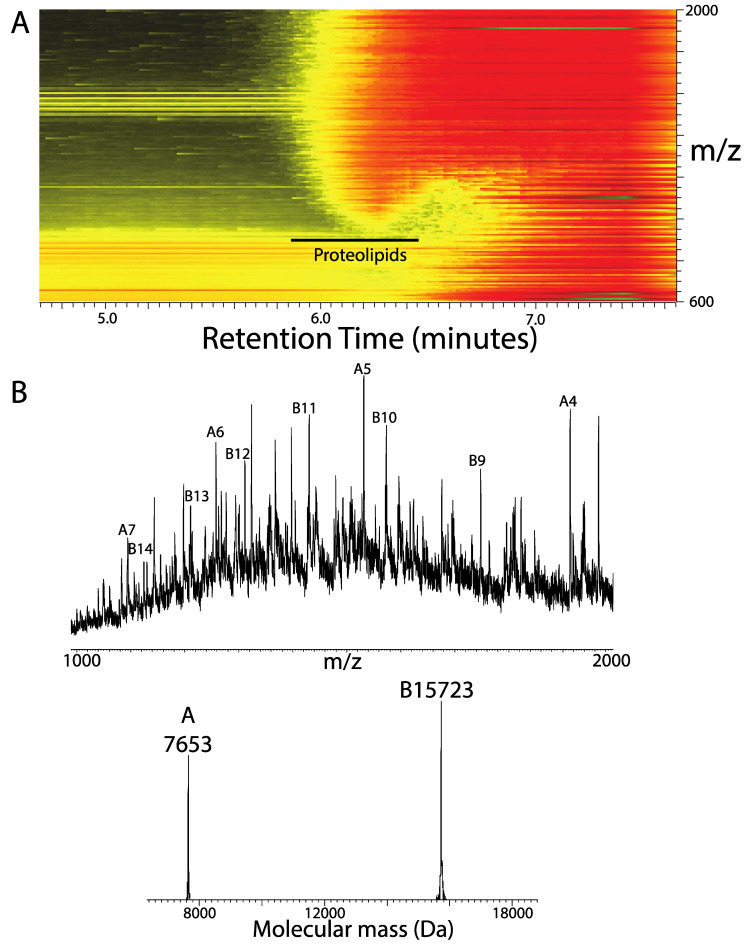
A subsection of integral membrane proteins partition into chloroform during a chloroform/methanol/water extraction primarily designed to extract lipids. Traditionally, these proteins were called proteolipids due to their lipid-like properties; the c-subunit of the ATP synthase integral FO component is the best known due to its abundance. In this manuscript, we investigate purification of proteolipid proteins away from lipids for high-resolution mass spectrometry. Size-exclusion chromatography on silica beads using a chloroform/methanol/aqueous formic acid (4/4/1; v/v) mobile phase allowed the separation of larger proteins (>3 kDa) from lipids (<1.5 kDa) and analysis by online electrospray ionization mass spectrometry. Fraction collection for mass spectrometry was limited by presence of plasticizers and other contaminants solubilized by chloroform. Drying down of the protein sample followed by resuspension in formic acid (70%) allowed reverse-phase chromatography on a polymeric support at elevated temperature, as described previously. Fractions collected in this way could be stored for extended periods at -80 °C without adducts or contaminants. Top-down mass spectrometry enabled the definition of PsaI as a novel proteolipid of spinach thylakoid membrane. Proteolipid preparation worked similarly when total membranes from mouse brains were extracted with chloroform. While it might be tempting to use the described extraction, we prefer to broaden the meaning of the term, whereby the proteolipidome is defined as a novel biological membrane proteome that includes the full complement of membrane proteins, their binding partners/ligands and their tightly bound structural lipids that constitute each protein-lipid complex's functional unit; that is, a complete description of a biological membrane.

Keywords: CAD; FTICR; aiECD; high-resolution mass spectrometry; proteoform.


Conflict of interest statement

The authors declare no conflict of interest. The funders had no role in the design of the study; in the collection, analyses, or interpretation of data; in the writing of the manuscript, or in the decision to publish the results.

Figures

Figure 1
Figure 1
Schematic diagram of extraction of spinach thylakoid membrane proteolipids followed by size-exclusion and reverse-phase chromatography. Chloroform extraction selectively captures lipids and proteolipids in the lower chloroform-enriched phase. This lower phase is then injected to size-exclusion chromatography in order to separate proteolipids from lipids. Proteolipid-containing fractions are dried, redissolved in 70% formic acid and run on reverse-phase (RP) chromatography with low-resolution electrospray ionization mass spectrometry and fraction collection (LC–MS+). Selected fractions are then subject to top–down Fourier-transform ion cyclotron resonance (FT-ICR) MS offline using nano-electrospray ionization. Representative base peak (BP) chromatograms for size-exclusion chromatography (SEC) and RP are shown. The SEC-BP chromatogram shows dropout of signal as the proteolipid peak is collected and again as the bulk of the lipid peak is diverted to waste.
Figure 2
Figure 2
Extraction of spinach thylakoid membrane proteolipids. (A) A 3D ion map view of the size-exclusion separation of chloroform-extractable lipids and proteolipids. (B) Mass spectrum of multiply charged proteolipid ions averaged from 6.4 to 7.8 min. A deconvolution was not included because several small proteolipids were represented by a single charge only confounding the software.
Figure 3
Figure 3
Top–down mass spectrometry of thylakoid proteolipids after SEC purification, resolubilization in formic acid and reverse-phase chromatography. (A) A 3D ion map of the chromatographic profile of the reverse-phase separation of spinach thylakoid proteolipids after removal of most lipids by size-exclusion chromatography—as described in Figure 1. Selected fractions collected during the reverse-phase separation were subjected to static nanospray tandem mass spectrometry. (B) Top–down mass spectrometry of an unknown intact mass tag (3696.9 Da) eluting at 29.5 min was selected for identification. Collisionally activated dissociation (CAD) was performed on the triply charged precursor, m/z 1233.3 Da (monoisotopic mass 3694.038 Da). The ion isolation of the precursor is shown in the inset. The CAD spectrum was processed using Prosight 4.1 software to generate sequence tags, and in turn identify the protein as PsaI. The PsaI sequence is shown with the transmembrane helix shaded. (C) Activated-ion electron capture dissociation (aiECD) was used to dissociate the triply charged precursor at m/z 1233.3 Da. The aiECD spectrum was processed using Prosight 4.1 software to generate sequence tags, and in turn identify the protein as PsaI.
Figure 3
Figure 3
Top–down mass spectrometry of thylakoid proteolipids after SEC purification, resolubilization in formic acid and reverse-phase chromatography. (A) A 3D ion map of the chromatographic profile of the reverse-phase separation of spinach thylakoid proteolipids after removal of most lipids by size-exclusion chromatography—as described in Figure 1. Selected fractions collected during the reverse-phase separation were subjected to static nanospray tandem mass spectrometry. (B) Top–down mass spectrometry of an unknown intact mass tag (3696.9 Da) eluting at 29.5 min was selected for identification. Collisionally activated dissociation (CAD) was performed on the triply charged precursor, m/z 1233.3 Da (monoisotopic mass 3694.038 Da). The ion isolation of the precursor is shown in the inset. The CAD spectrum was processed using Prosight 4.1 software to generate sequence tags, and in turn identify the protein as PsaI. The PsaI sequence is shown with the transmembrane helix shaded. (C) Activated-ion electron capture dissociation (aiECD) was used to dissociate the triply charged precursor at m/z 1233.3 Da. The aiECD spectrum was processed using Prosight 4.1 software to generate sequence tags, and in turn identify the protein as PsaI.
Figure 4
Figure 4
Extraction of mouse brain proteolipids. (A) A 3D ion map view of the size-exclusion separation of chloroform-extractable lipids and proteolipids. (B) Mass spectrum (upper) and Molecular mass profile after deconvolution using MagTran software (lower panel) of prominent proteolipids—as labeled. Ions that correspond to the deconvoluted masses are labeled A and B according to their origin, with the number corresponding to the charge state.

Similar articles

Cited by

References

    1. Singer S.J., Nicolson G.L. The fluid mosaic model of the structure of cell membranes. Science. 1972;175:720–731. doi: 10.1126/science.175.4023.720. - DOI - PubMed
    1. Santoni V., Molloy M., Rabilloud T. Membrane proteins and proteomics: Un amour impossible? Electrophoresis. 2000;21:1054–1070. doi: 10.1002/(SICI)1522-2683(20000401)21:6<1054::AID-ELPS1054>3.0.CO;2-8. - DOI - PubMed
    1. Blonder J., Conrads T.P., Yu L.R., Terunuma A., Janini G.M., Issaq H.J., Vogel J.C., Veenstra T.D. A detergent- and cyanogen bromide-free method for integral membrane proteomics: Application to Halobacterium purple membranes and the human epidermal membrane proteome. Proteomics. 2004;4:31–45. doi: 10.1002/pmic.200300543. - DOI - PubMed
    1. Wu C.C., MacCoss M.J., Howell K.E., Yates J.R., 3rd A method for the comprehensive proteomic analysis of membrane proteins. Nat. Biotechnol. 2003;21:532–538. doi: 10.1038/nbt819. - DOI - PubMed
    1. Speers A.E., Blackler A.R., Wu C.C. Shotgun analysis of integral membrane proteins facilitated by elevated temperature. Anal. Chem. 2007;79:4613–4620. doi: 10.1021/ac0700225. - DOI - PubMed