. 2020 Mar 10;21(5):1889.
doi: 10.3390/ijms21051889.

HSP Transcript and Protein Accumulation in Brassinosteroid Barley Mutants Acclimated to Low and High Temperatures

Affiliations

HSP Transcript and Protein Accumulation in Brassinosteroid Barley Mutants Acclimated to Low and High Temperatures

Iwona Sadura et al. Int J Mol Sci. .

Abstract

In temperature stress, the main role of heat-shock proteins (HSP) is to act as molecular chaperones for other cellular proteins. However, knowledge about the hormonal regulation of the production of the HSP is quite limited. Specifically, little is known about the role of the plant steroid hormones-brassinosteroids (BR)-in regulating the HSP expression. The aim of our study was to answer the question of how a BR deficit or disturbances in its signaling affect the accumulation of the HSP90, HSP70, HSP18, and HSP17 transcripts and protein in barley growing at 20 °C (control) and during the acclimation of plants at 5 °C and 27 °C. In barley, the temperature of plant growth modified the expression of HSPs. Furthermore, the BR-deficient mutants (mutations in the HvDWARF or HvCPD genes) and BR-signaling mutants (mutation in the HvBRI1 gene) were characterized by altered levels of the transcripts and proteins of the HSP group compared to the wild type. The BR-signaling mutant was characterized by a decreased level of the HSP transcripts and heat-shock proteins. In the BR-deficient mutants, there were temperature-dependent cases when the decreased accumulation of the HSP70 and HSP90 transcripts was connected to an increased accumulation of these HSP. The significance of changes in the accumulation of HSPs during acclimation at 27 °C and 5 °C is discussed in the context of the altered tolerance to more extreme temperatures of the studied mutants (i.e., heat stress and frost, respectively).

Keywords: HSP70; HSP90; acclimation process; brassinosteroids; small HSPs (sHSPs); temperature stress.


Conflict of interest statement

The authors declare no conflict of interest. The funders had no role in the design of the study; in the collection, analyses, or interpretation of data; in the writing of the manuscript, or in the decision to publish the results.

Figures

Figure 1
Figure 1
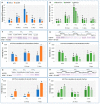
Changes in relative transcript level of heat-shock protein 90 (HSP90) (A,B) and the accumulation of HSP90 (CF) in the barley cell membrane fraction isolated from the cultivar (cv.) Delisa, 522DK mutant, cv. Bowman, and the BW084 and BW312 mutants growing in different temperature conditions. The transcript levels are presented as the fold change in the expression of a specific gene in the specific samples compared to the reference gene actin. The visualized bands corresponding to the HSP90 protein were identified as described in Section 3. In total, 15 μg of proteins were loaded onto the gel. MW—molecular weight standard (Thermo Scientific PageRuler Prestained Protein Ladder). A.U.—arbitrary units. The statistical differences between the cv. Delisa and its mutant 522DK (Student’s t-test, p ≤ 0.05) and between the cv. Bowman and its mutants (Duncan’s test, p ≤ 0.05) for each temperature are indicated by different letters. Additionally, the accumulation of the transcript and protein in the Delisa and Bowman cultivars at different temperatures was also compared. The comparisons were performed in pairs (for 20 °C and 5 °C; 20 °C and 27 °C) (Student’s t-test, p ≤ 0.05), and the statistical differences are indicated by an asterisk.
Figure 2
Figure 2
Changes in the relative transcript level of HSP70 (A,B) and the accumulation of the HSP70 protein in the barley cell membrane fraction (CF) and in the cytosolic fraction (GJ) of the cv. Delisa, 522DK mutant, cv. Bowman, and the BW084 and BW312 mutants growing in different temperature conditions. The transcript levels are presented as the fold change in the expression of a specific gene in the specific samples compared to the reference gene actin. The visualized bands correspond to the HSP70 protein identified as described in Section 3. In total, 10 μg of the proteins from the cell membrane fraction and the cytosolic fractions were loaded onto the gel. MW—molecular weight standard (Thermo Scientific PageRuler Prestained Protein Ladder). A.U.—arbitrary units. Statistical differences between the cv. Delisa and its mutant 522DK (Student’s t-test, p ≤ 0.05) and between the cv. Bowman and its mutants (Duncan’s test, p ≤ 0.05) for each temperature are indicated by different letters. Additionally, the accumulations of the transcript and protein in the Delisa and Bowman cultivars at different temperatures were also compared. The comparisons were performed in pairs (for 20 °C and 5 °C; 20 °C and 27 °C) (Student’s t-test, p ≤ 0.05) and the statistical differences are indicated by an asterisk.
Figure 3
Figure 3
Relative transcript level of HSP17 and HSP18 in the barley leaves of the cv. Delisa, 522DK mutant (A,C), cv. Bowman, and the BW084 and BW312 (B,D) mutants at 20 °C and during and after acclimation at 5 °C and 27 °C. The transcript levels are presented as the fold change in the expression of a specific gene in the specific samples compared to the reference gene actin. The statistical differences between the cv. Delisa and its mutant 522DK (Student’s t-test, p ≤ 0.05) and between cv. Bowman and its mutants (Duncan’s test, p ≤ 0.05) for each temperature are indicated by different letters. Additionally, the accumulations of the transcript in the Delisa and Bowman cultivars at different temperatures were compared. The comparisons were performed in pairs (for 20 °C and 5 °C; 20 °C and 27 °C) (Student’s t-test, p ≤ 0.05) and the statistical differences are indicated by an asterisk. LOD: below detection limit.

Similar articles

Cited by

References

    1. Awasthi R., Bhandari K., Nayyar H. Temperature stress and redox homeostasis in agricultural crops. Front. Environ. Sci. 2015;3:11. doi: 10.3389/fenvs.2015.00011. - DOI
    1. Hasanuzzaman M., Nahar K., Fujita M. Extreme temperature responses, oxidative stress and antioxidant defense in plants. In: Vahdati K., Leslie C., editors. Abiotic Stress Plant Responses Appllications in Agriculture. IntechOpen; London, UK: 2013. pp. 169–205.
    1. Altschuler M., Mascarenhas J.P. Heat shock proteins and effects of heat shock in plants. Plant Mol. Biol. 1982;1:103–115. doi: 10.1007/BF00024974. - DOI - PubMed
    1. Howarth C.J. Molecular responses of plants to an increased incidence of heat shock. Plant Cell Environ. 1991;14:831–841. doi: 10.1111/j.1365-3040.1991.tb01446.x. - DOI
    1. Kotak S., Larkindale J., Lee U., von Koskull-Döring P., Vierling E., Scharf K.D. Complexity of the heat stress response in plants. Curr. Opin. Plant Biol. 2007;10:310–316. doi: 10.1016/j.pbi.2007.04.011. - DOI - PubMed

LinkOut - more resources