. 2020 Mar 17;52(3):475-486.e5.
doi: 10.1016/j.immuni.2020.02.002. Epub 2020 Mar 11.

mtDNA Activates cGAS Signaling and Suppresses the YAP-Mediated Endothelial Cell Proliferation Program to Promote Inflammatory Injury

Affiliations

mtDNA Activates cGAS Signaling and Suppresses the YAP-Mediated Endothelial Cell Proliferation Program to Promote Inflammatory Injury

Long Shuang Huang et al. Immunity. .

Abstract

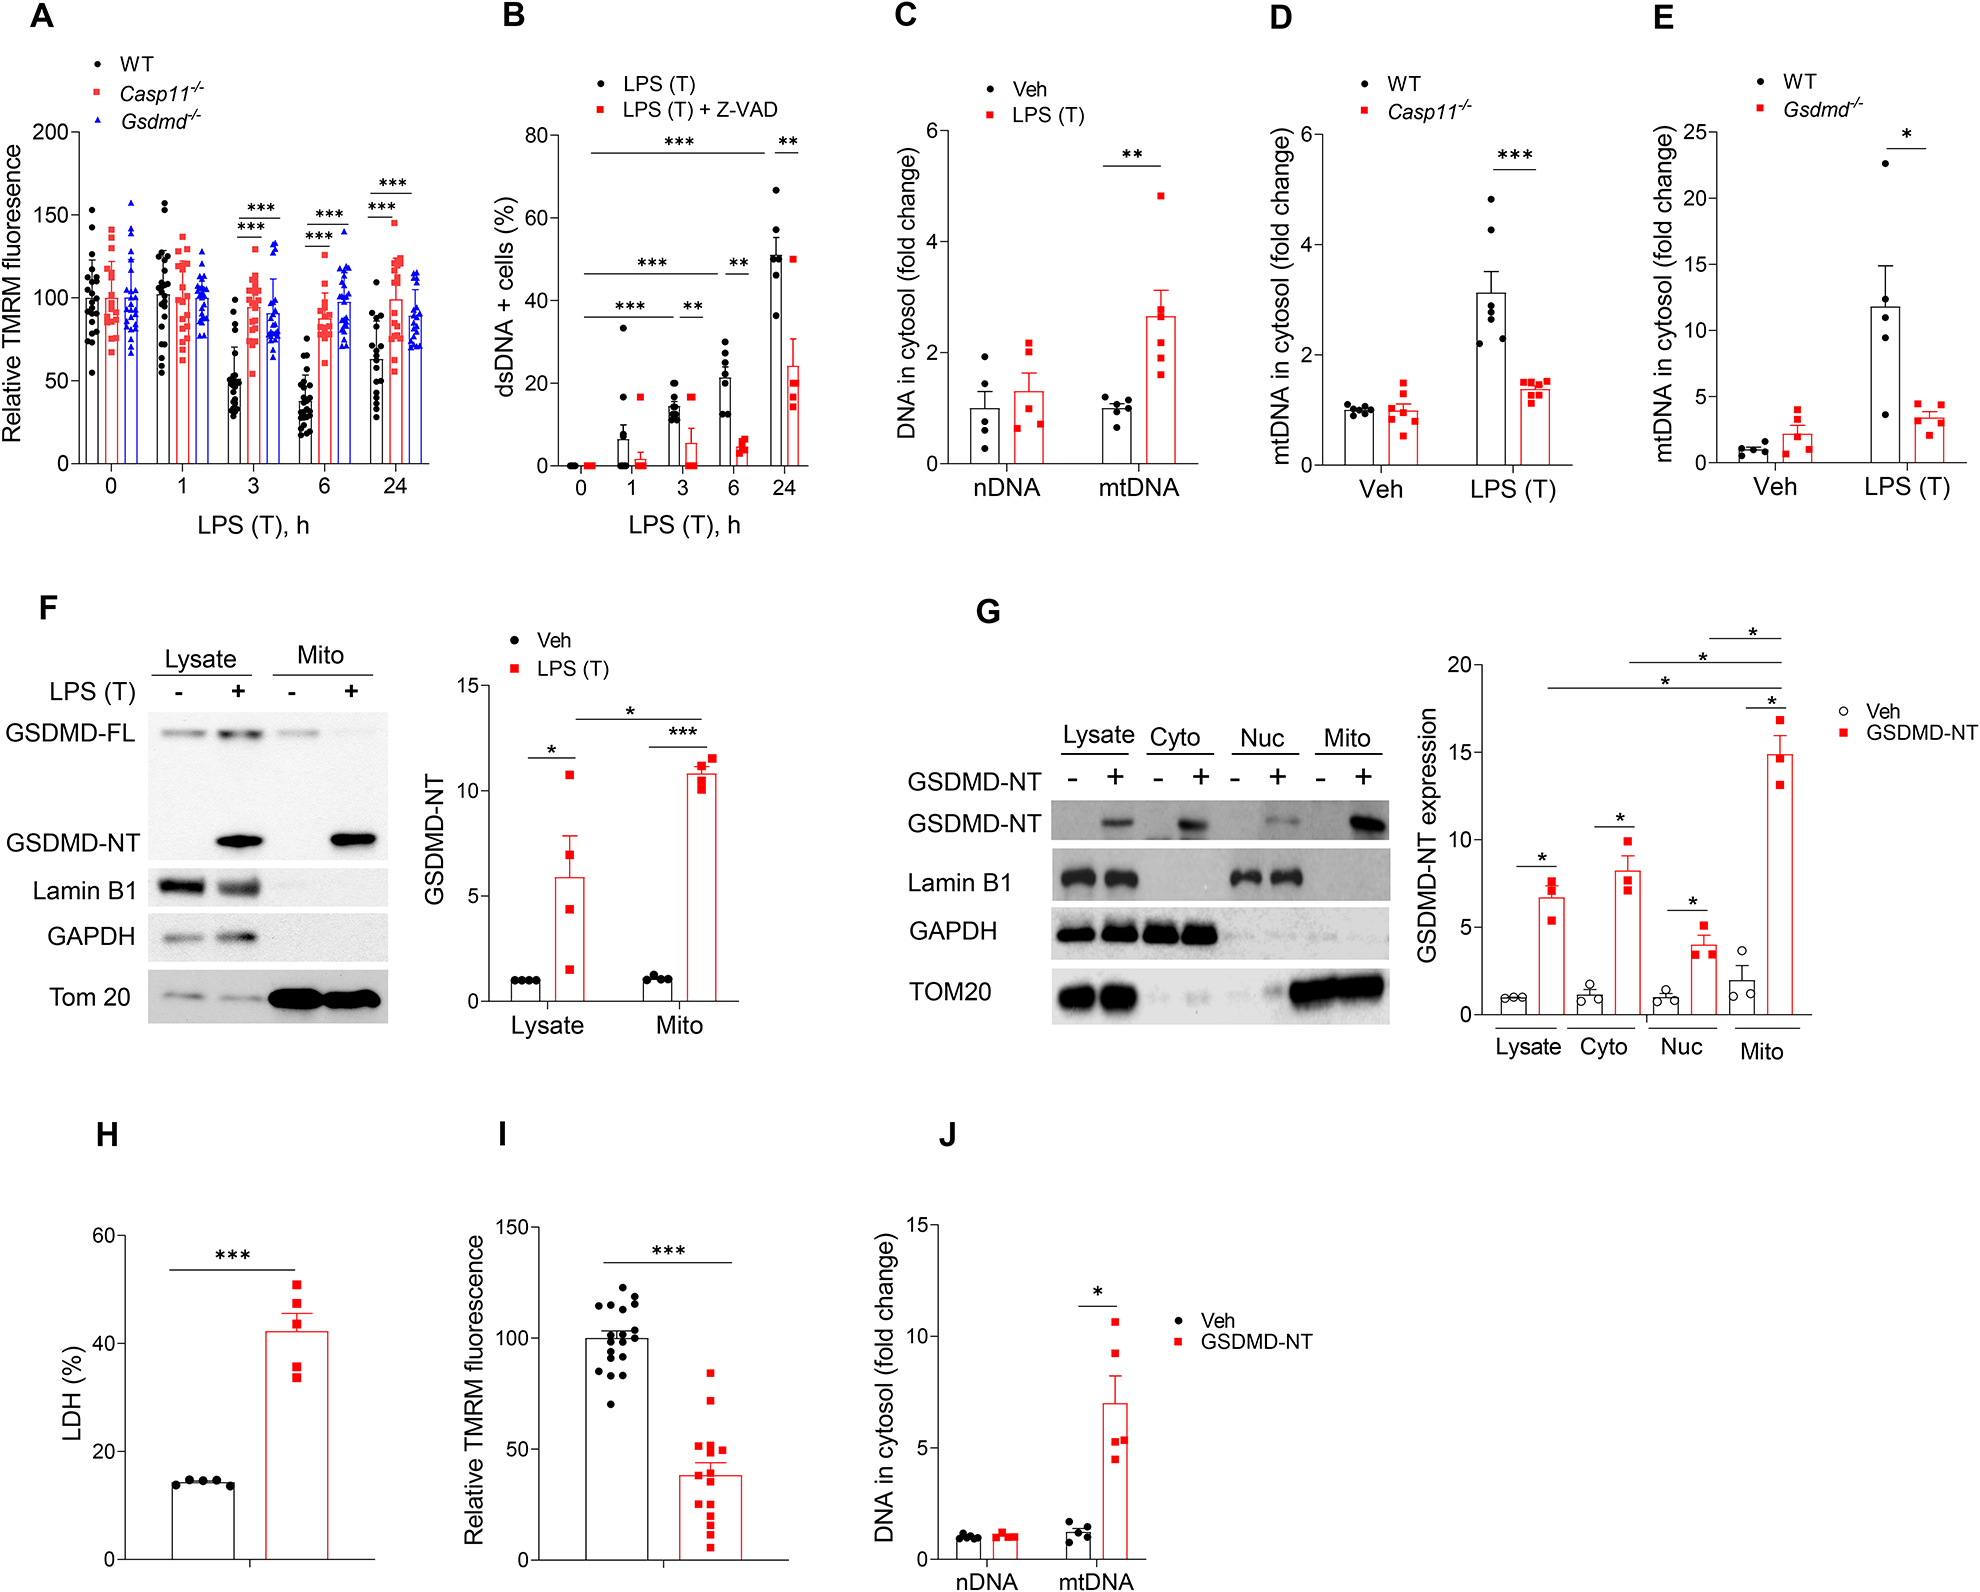
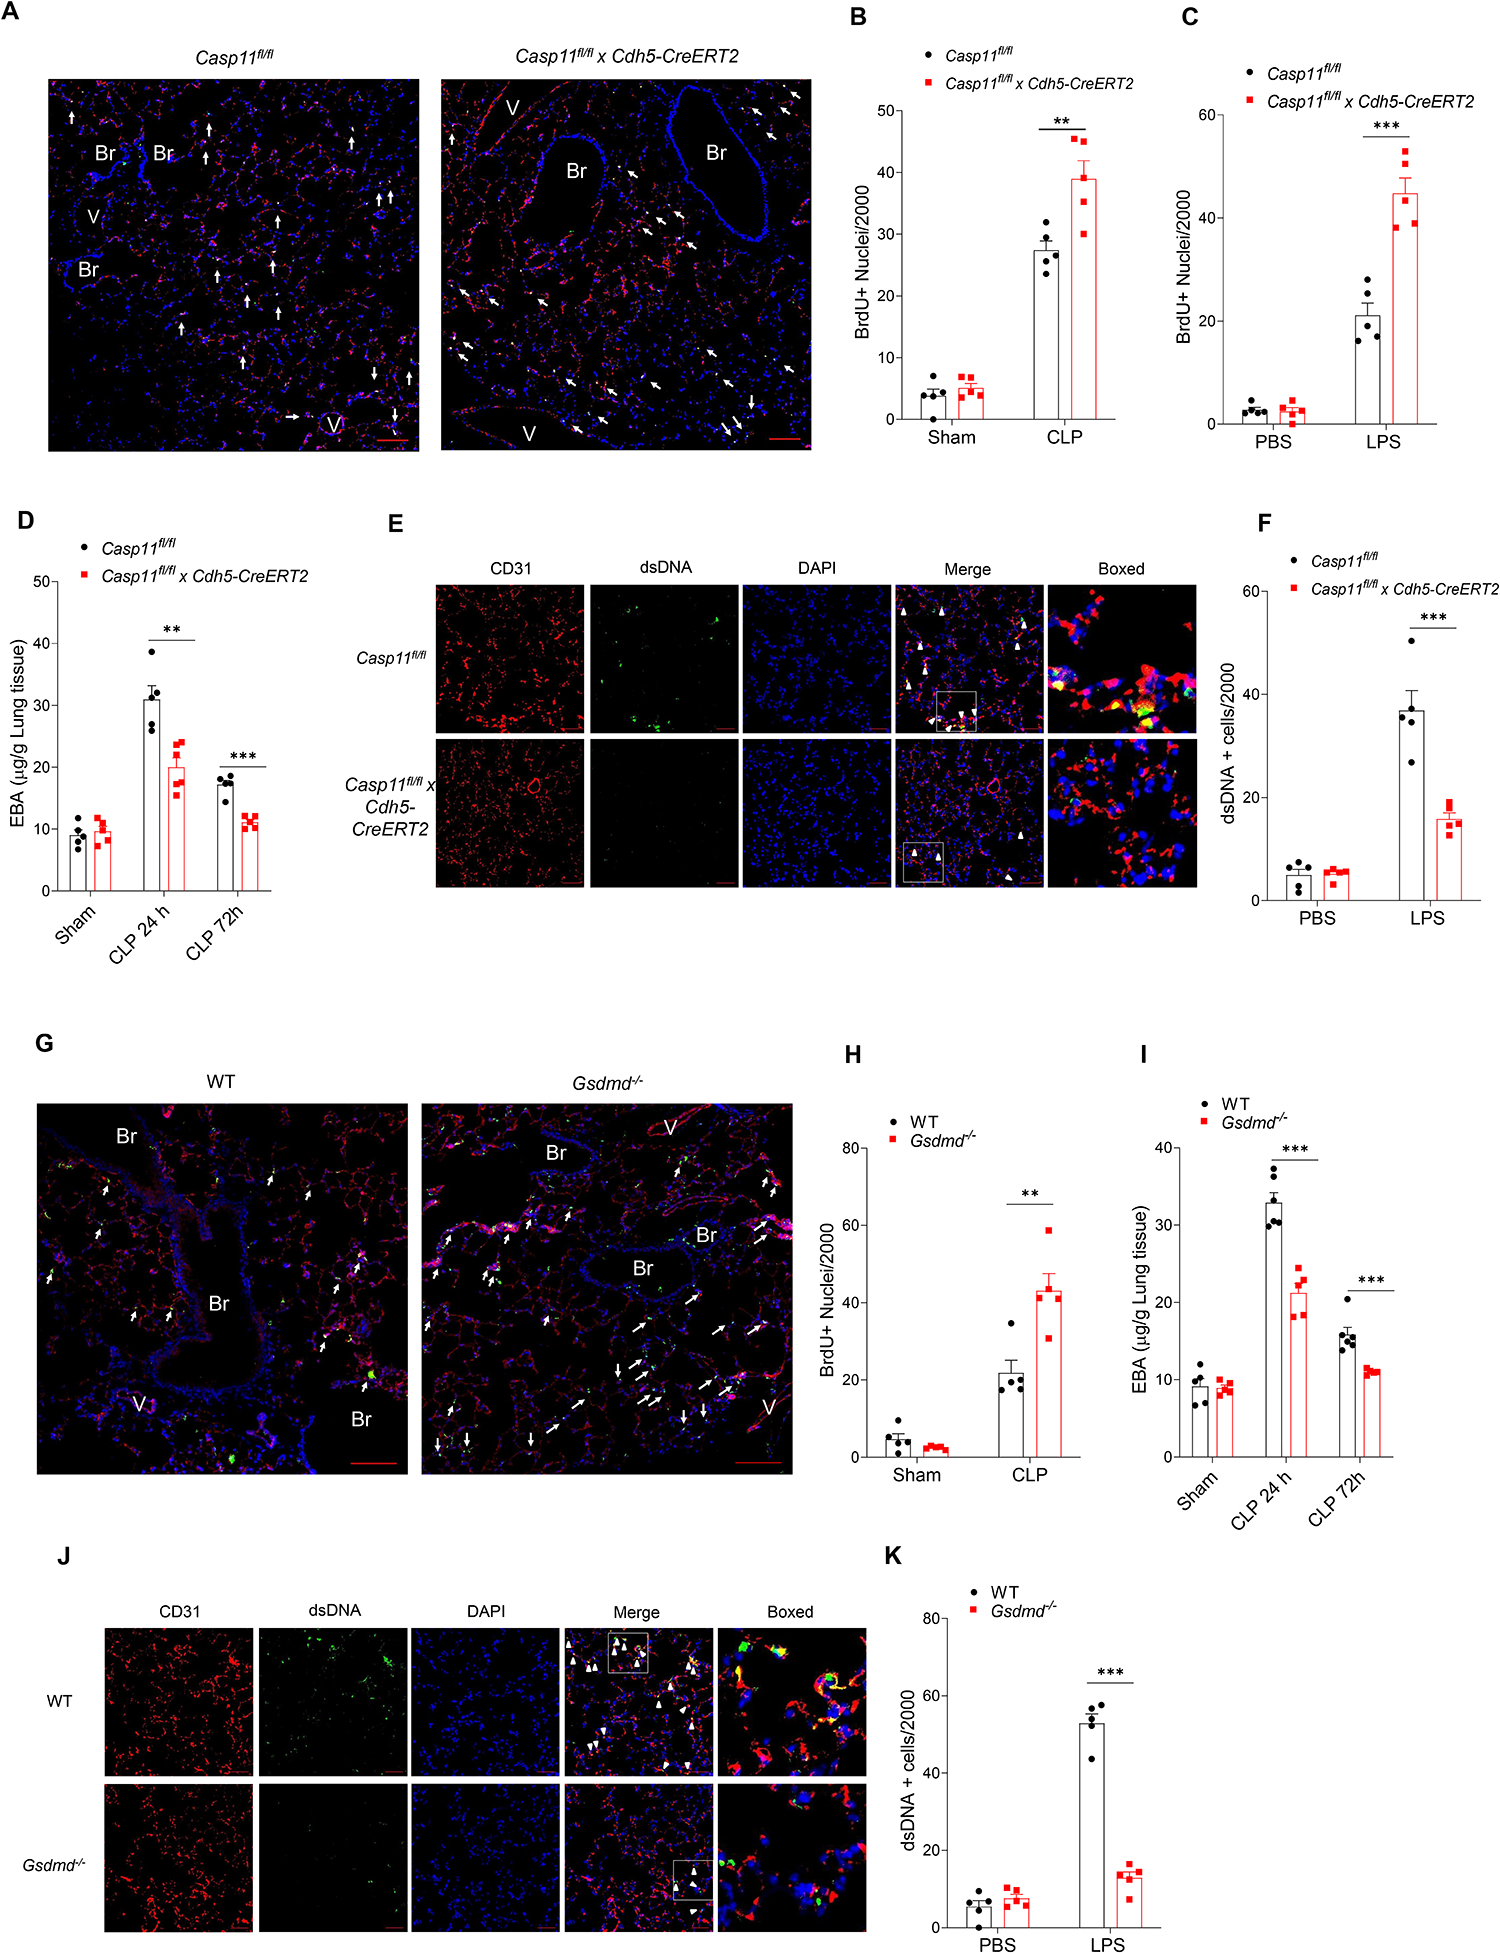
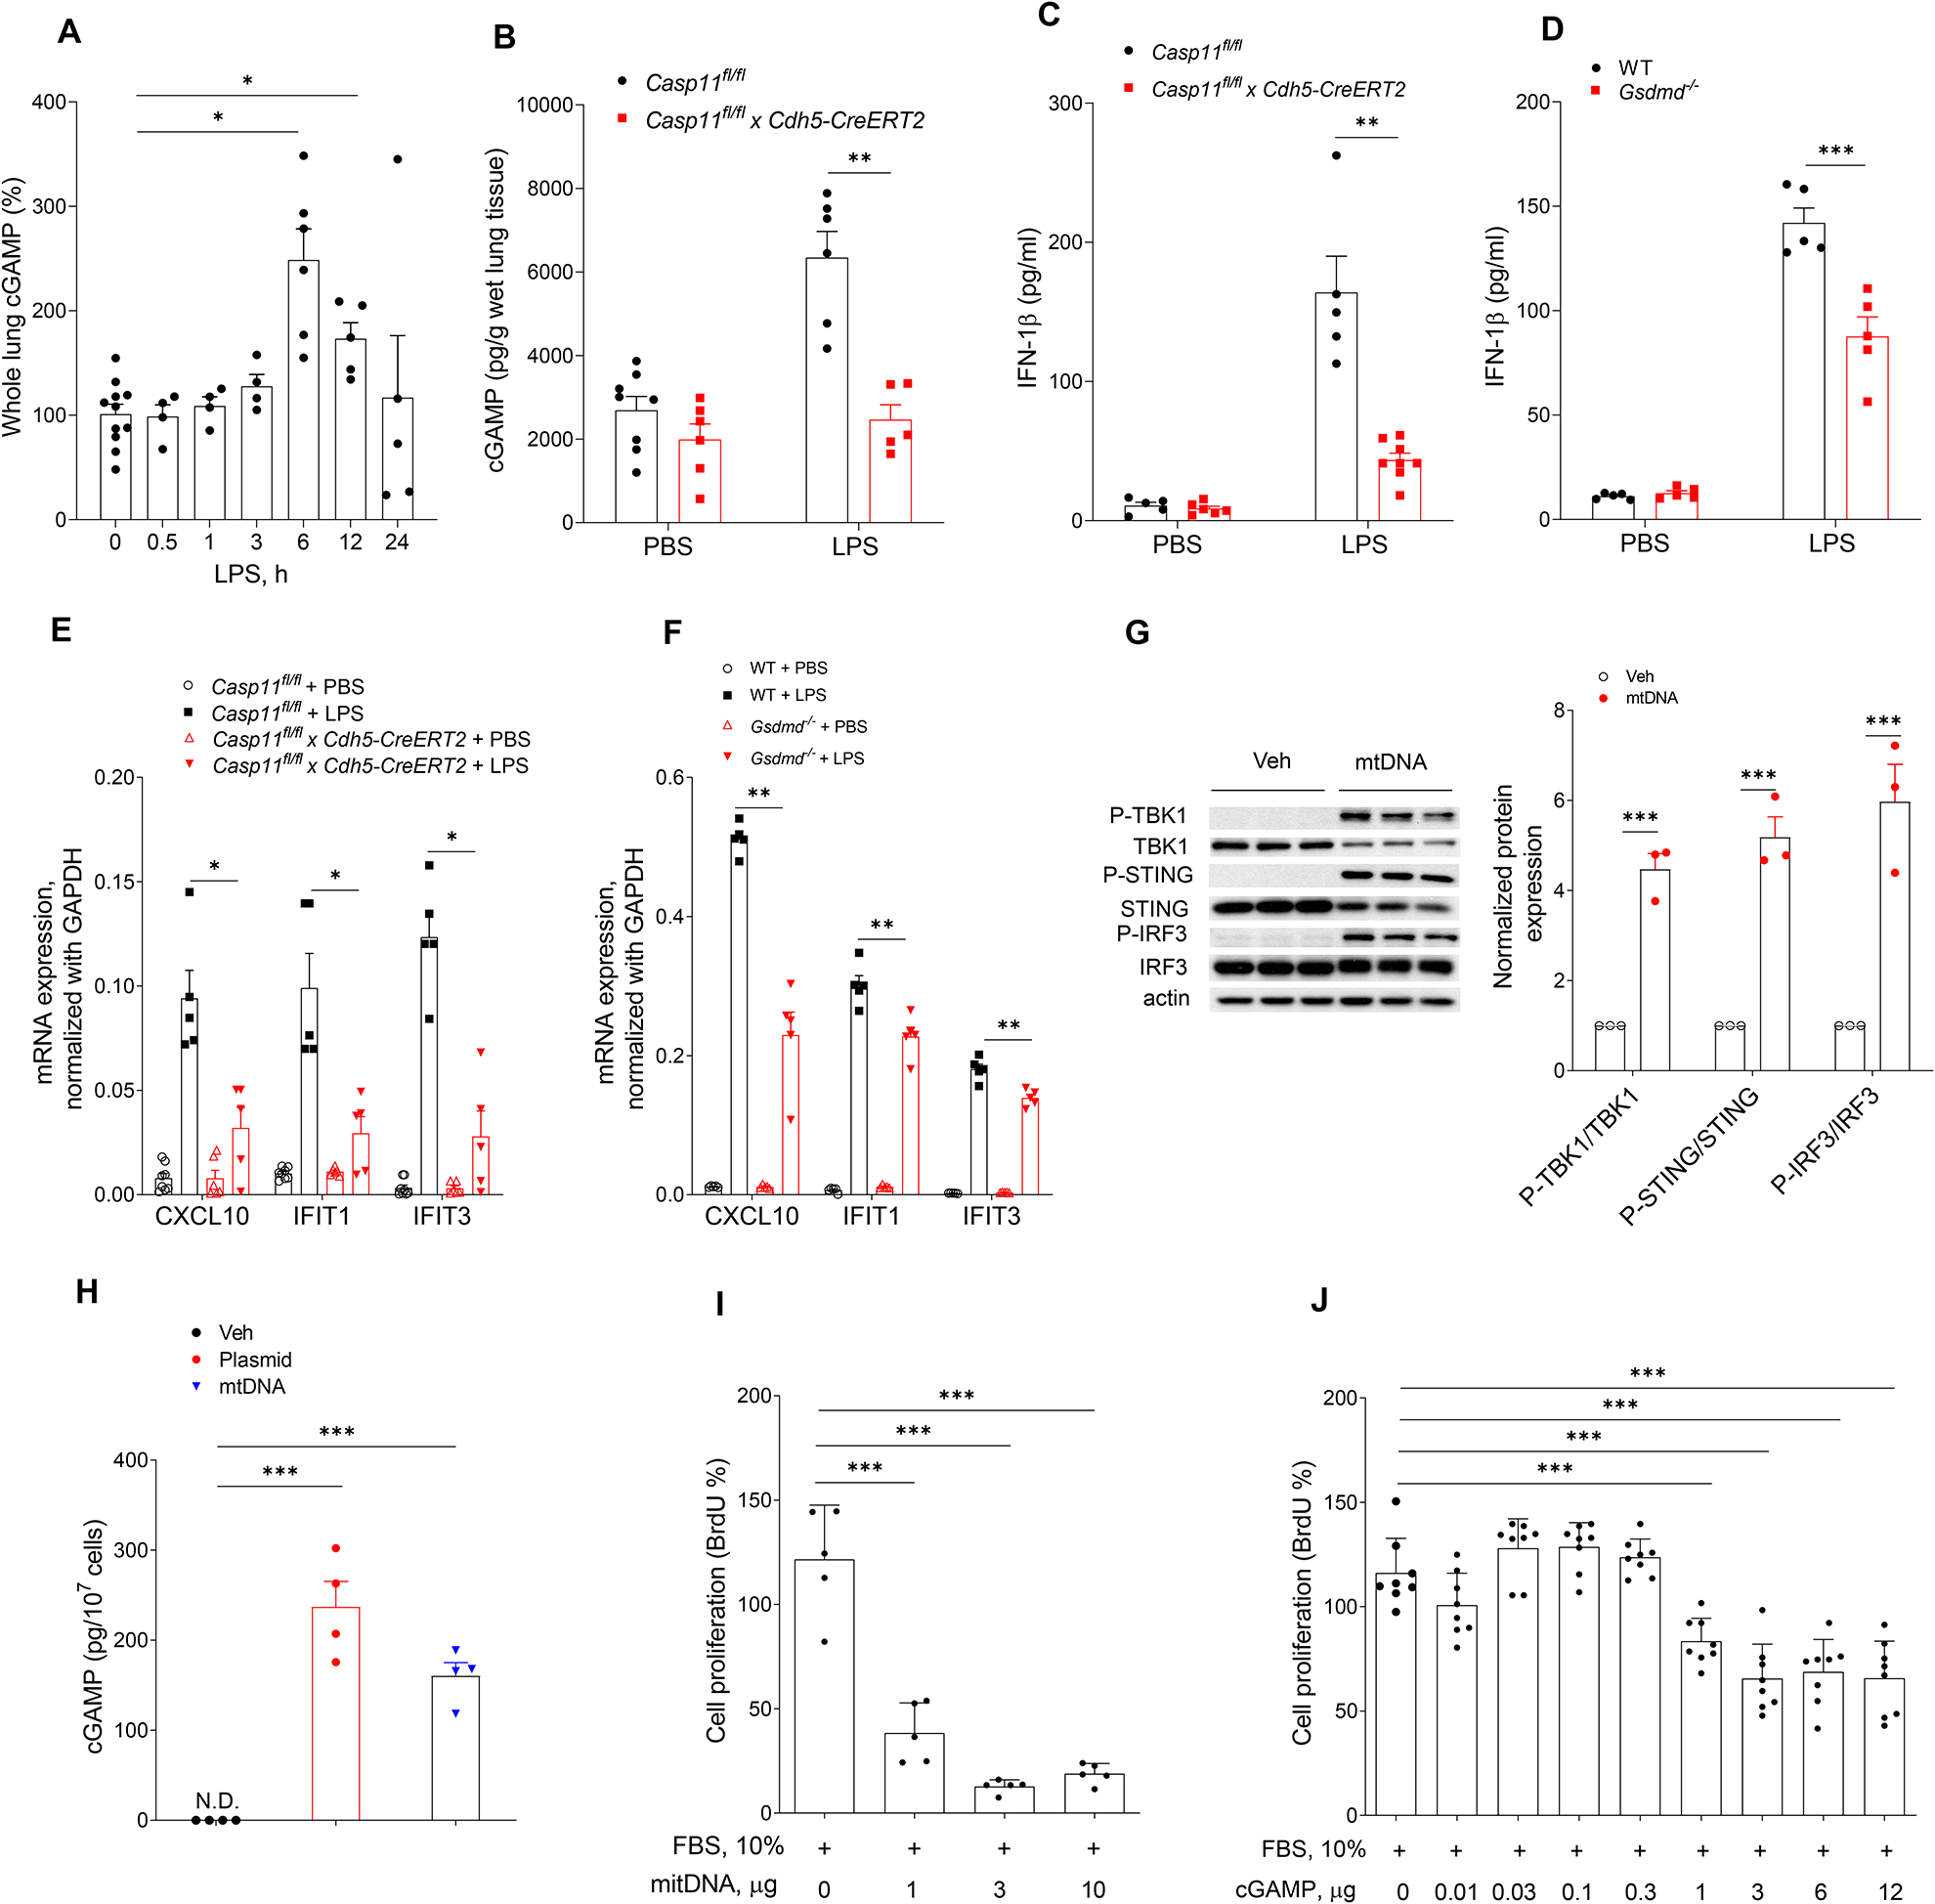
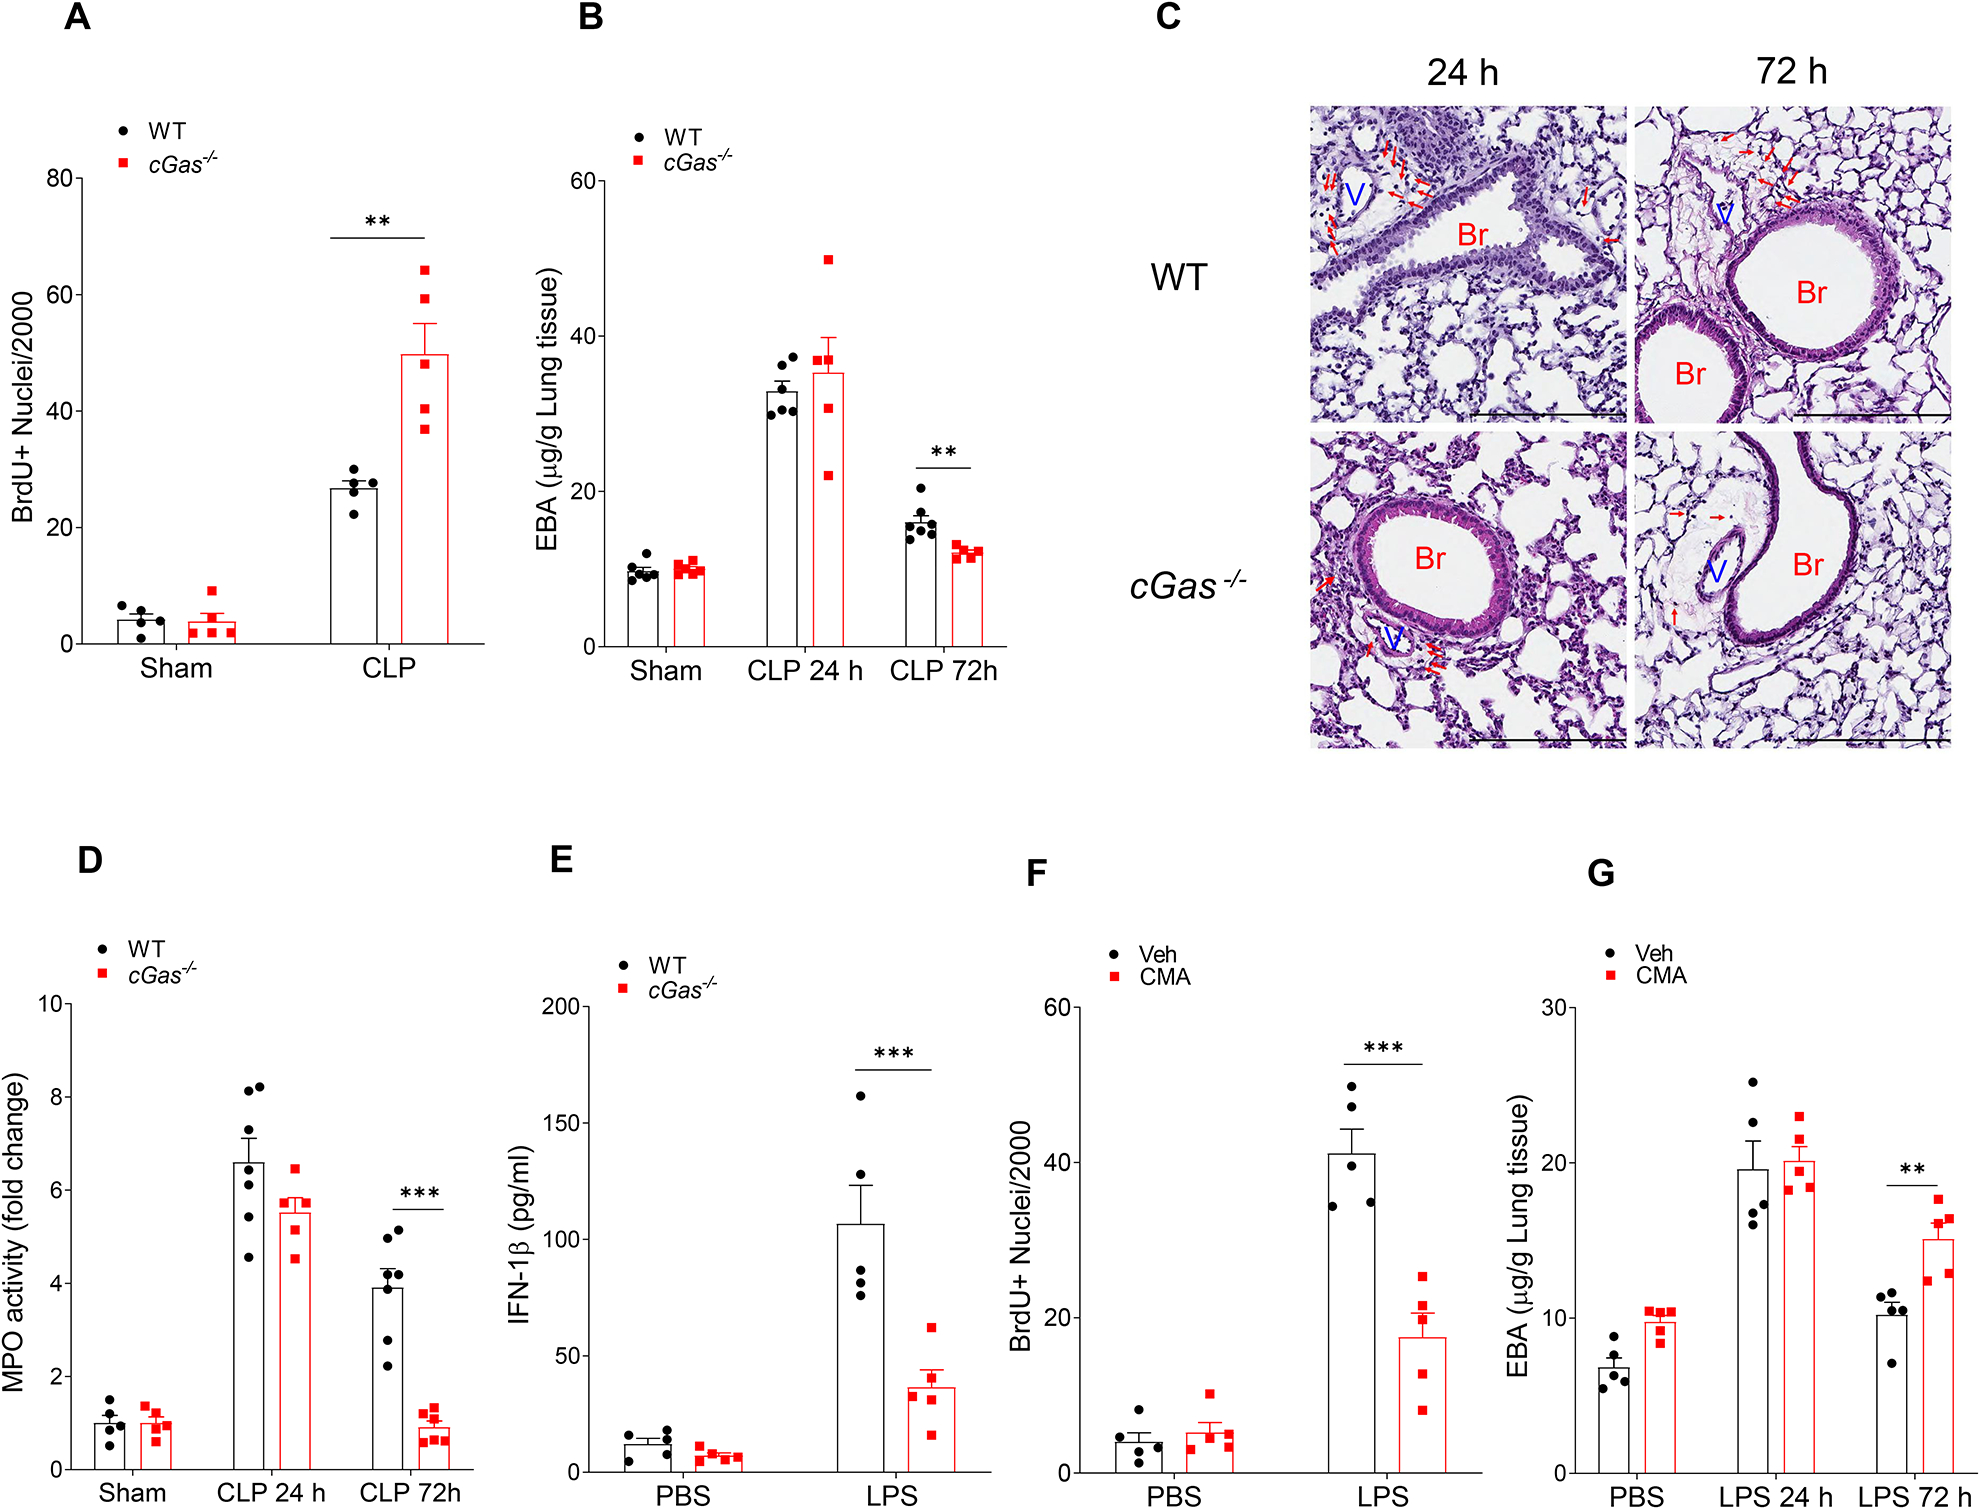
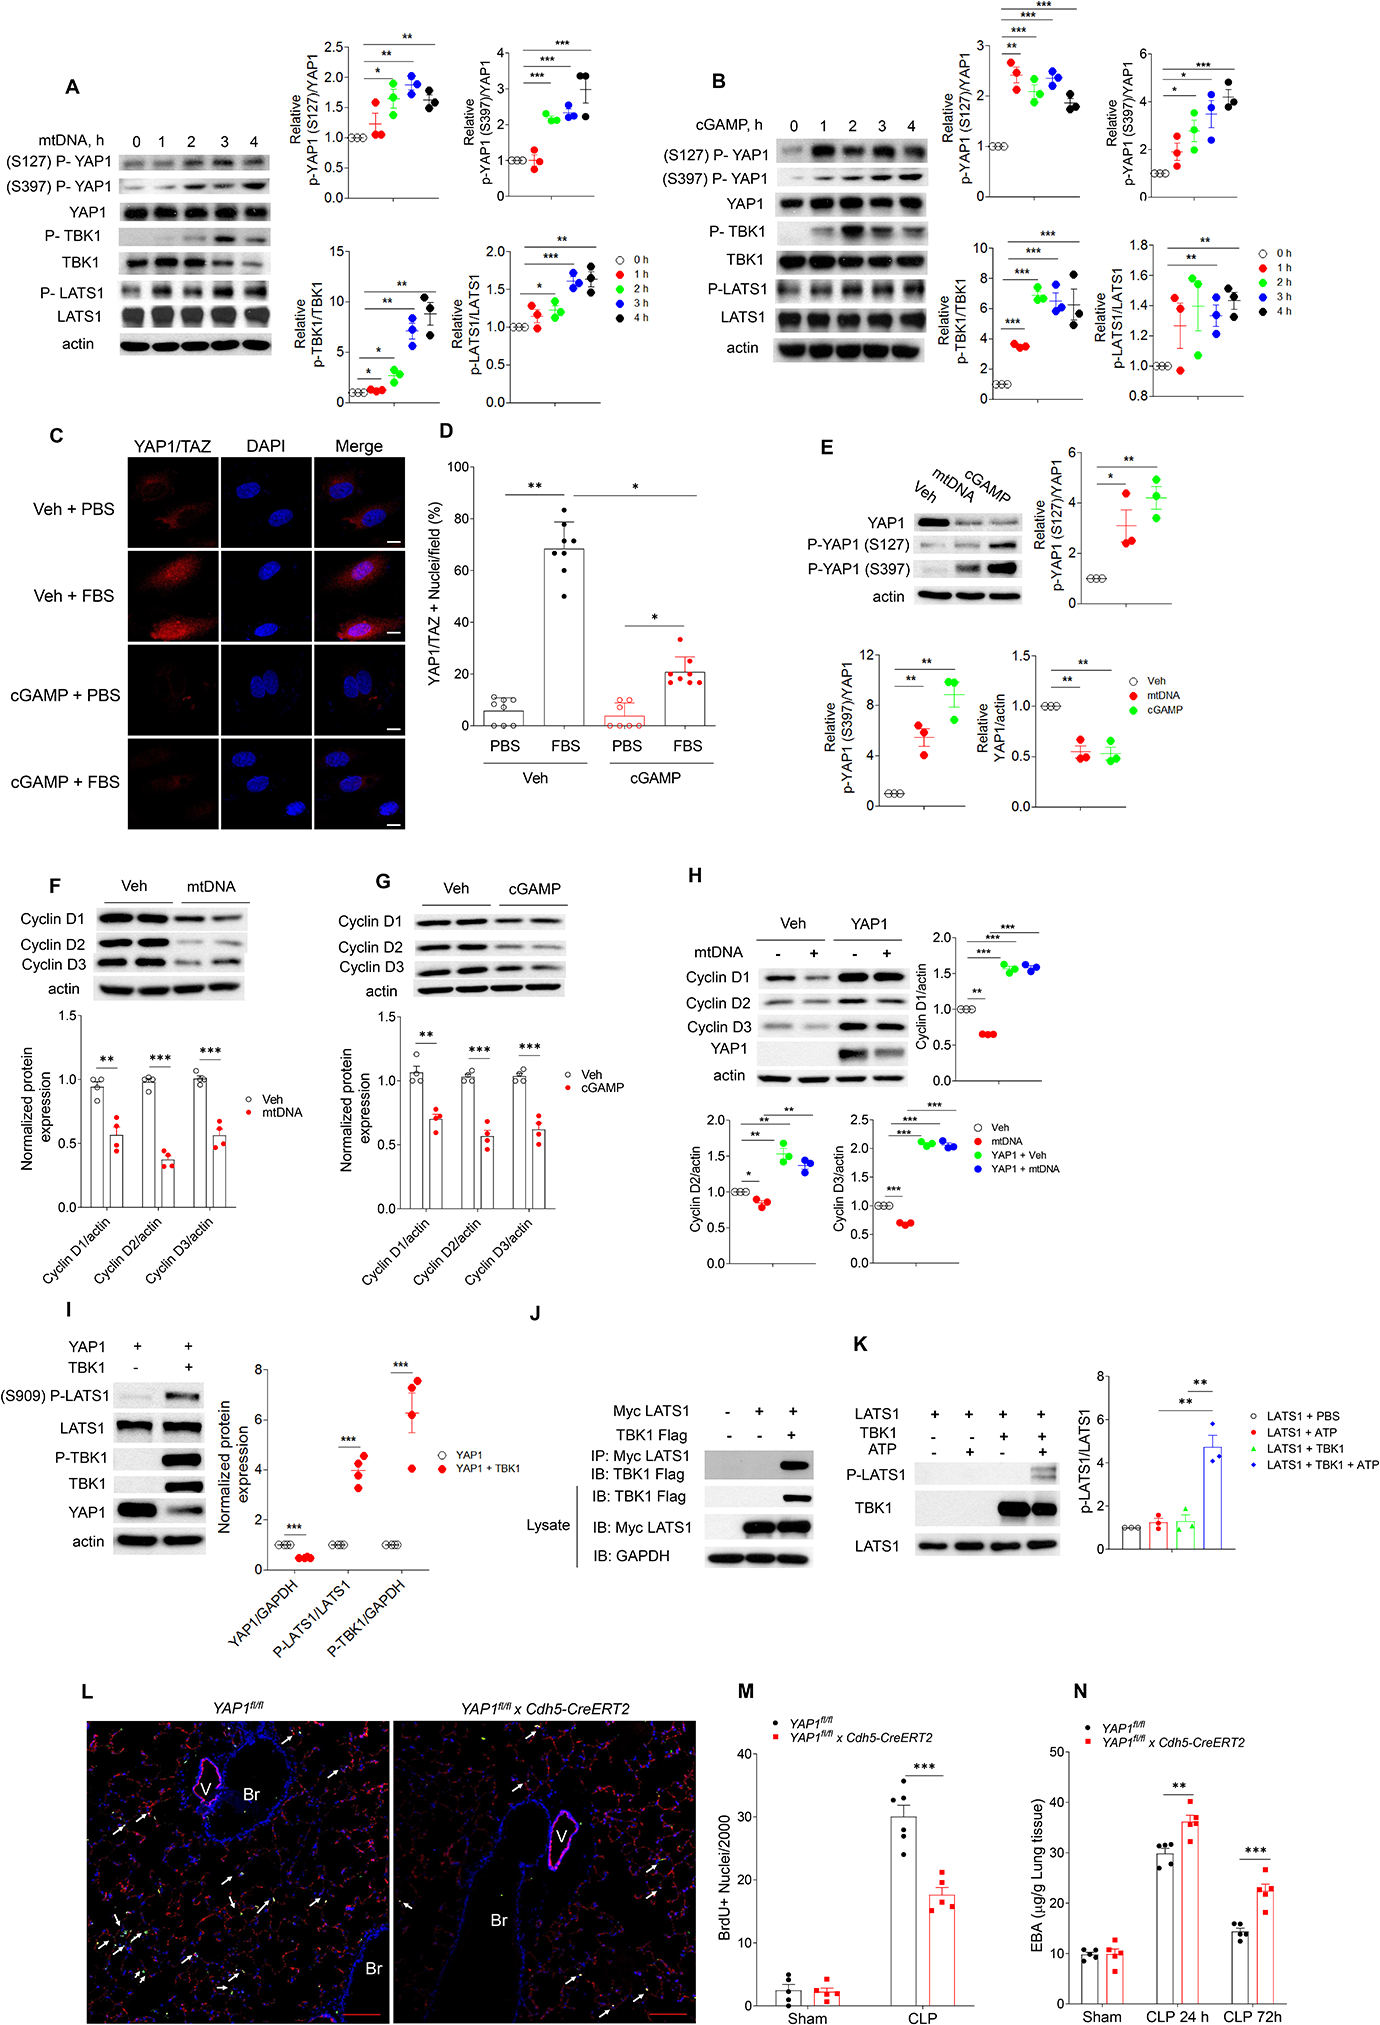
Cytosolic DNA acts as a universal danger-associated molecular pattern (DAMP) signal; however, the mechanisms of self-DNA release into the cytosol and its role in inflammatory tissue injury are not well understood. We found that the internalized bacterial endotoxin lipopolysaccharide (LPS) activated the pore-forming protein Gasdermin D, which formed mitochondrial pores and induced mitochondrial DNA (mtDNA) release into the cytosol of endothelial cells. mtDNA was recognized by the DNA sensor cGAS and generated the second messenger cGAMP, which suppressed endothelial cell proliferation by downregulating YAP1 signaling. This indicated that the surviving endothelial cells in the penumbrium of the inflammatory injury were compromised in their regenerative capacity. In an experimental model of inflammatory lung injury, deletion of cGas in mice restored endothelial regeneration. The results suggest that targeting the endothelial Gasdermin D activated cGAS-YAP signaling pathway could serve as a potential strategy for restoring endothelial function after inflammatory injury.

Keywords: Gasdermin D; YAP; cGAS; endothelial regeneration; inflammation; lung injury; mitochondrial DNA; pyroptosis; vascular injury.


Conflict of interest statement

Declaration Of Interests The authors declare no competing interests.

Figures

Fig. 1.
Fig. 1.. Intracellular LPS induces mtDNA release through caspase11 and Gasdermin D.
(A) Quantification of MMP in mLMVECs from WT, Casp11−/− and GSDMD−/− mouse lungs transfected with LPS. mLMVECs were primed with LPS (LPS (E), 0.2 μg/ml, 3h), followed with medium change and transfection with or without LPS (LPS (T), 0.5 μg/ml, 0–24 h). Values are shown as mean ± SD; data were obtained from three independent experiments (n= 15–25). (B) Percentage of cells with cytosol dsDNA in LPS (T) treated hLMVECs were analyzed by staining dsDNA. hLMVECs were pretreated with (0, 50 μM, 30 min) Z-VAD-FMK and followed with priming with LPS (0.2 μg/ml, 3h) and treated with LPS (T) (0, 0.5 g/ml, 0–24h). Values are shown as mean ± SD; data were obtained from three independent experiments (n= 5–10). (C) RT-qPCR analysis of cytosolic nuclei DNA (nDNA) and mitochondrial DNA (mtDNA) in hLMVECs after LPS (T) (0.5 g/ml, 24h), n =5–6. (D & E) RT-qPCR quantification of cytosolic mtDNA in mLMVECs ((D) WT vs. Casp11−/−, n=7; (F) WT vs. GSDMD−/−, n=5; after LPS (T) (0, 0.5 g/ml, 24h). (F) LPS (T) induced endogenous GSDMD-NT formation and trans-localizes to mitochondrial membrane. Primed hLMVECs (LPS, 0.2 μg/ml, 3h) were transfected with LPS (0.5 μg/ml, 16h). The mitochondrial fractions were isolated using mitochondrial isolation kit, and the expression of protein were analyzed by immunoblotting, n = 4. (G-I) GSDMD-NT localizes to mitochondrial membrane, decreases MMP, induces cell pyroptosis and cytosolic release of mtDNA. Vehicle plasmid and the GSDMD-NT plasmid (3 μg/ml) were transfected into hLMVECs for 24h, the LDH released into the medium was assayed. The mitochondrial membrane potential was analyzed using the potentiometric dye TMRM, and the release of mtDNA into cytosolic fraction was analyzed by RT-qPCR. (G) Fractionation analysis of hLMVECs with or without overexpression of GSDMD-NT (24h), n = 3. (H) LDH release from hLMVECs with or without GSDMD-NT overexpression, n = 5. (I) TMRM staining (100 nM, 15 min) and analysis of hLMVECs with or without overexpression of GSDMD-NT. Quantification of MMP in hLMVECs with or without GSDMD-NT transfection (24h). Values are shown as mean ± SD, data were obtained from three independent experiments, n = 15–19. (J) RT-qPCR quantification of cytosolic nDNA and mtDNA from hLMVECs with or without GSDMD-NT overexpression, n = 4–6. * P < 0.05, * * P < 0.01, * * * P < 0.001, two-tailed t-test. Values are mean ± SD. Please also see Figure S1.
Fig. 2.
Fig. 2.. Caspase11-Gasdermin D pathway induces mtDNA release, impairs endothelial cell proliferation, and resolution of inflammatory lung injury following polymicrobial sepsis and endotoxemia.
(A-G) EC specific deletion of Casp11 (Casp11fl/fl x Cdh5-CreERT2) in mice promotes endothelial regeneration and recovery from inflammatory lung injury. Casp11fl/fl mice were crossed with Cdh5-CreERT2 mice to delete caspase 11 in endothelial cells. Mice underwent either CLP or LPS injection (10 mg/kg, i.p). (A-C) Proliferation of endothelial cells as determined by the number of BrdU+ endothelial cells in lungs of Casp11fl/fl and Casp11ECKO mice post CLP and LPS challenge. (A) Representative images of proliferating lung endothelial cells from three independent experiments following CLP challenge for 72 h. Green, anti-BrdU; Red, anti–CD31; Blue, DAPI. Arrows indicate proliferating endothelial cells. Scale bar, 100 m. Br indicates bronchia; V, vessel. (B & C) Quantification of BrdU+ endothelial cell from Casp11fl/fl x Cdh5-CreERT2 and Casp11fl/fl mice lung post CLP (B) or LPS (C) challenge for 72 h, n = 5. (D) Lung transvascular albumin permeability in Casp11ECKO and Casp11fl/fl mice with or without CLP challenge, n = 5–6. (E & F) Representative images from three independent experiments (E) and quantification (F) of endothelial cells with cytosolic dsDNA in Casp11fl/fl and Casp11fl/fl x Cdh5-CreERT2 lungs post LPS (10 mg/kg, i.p, 24 h) challenge, n = 5. (G-K) GSDMD deletion (GSDMD−/−) in mice promoted endothelial regeneration and recovery from inflammatory lung injury in response to CLP. (G & H) Proliferation of endothelial cells as determined by the number of BrdU+ endothelial cells in lungs from WT and GSDMD−/− mice post CLP challenge. (G) Representative images of proliferating lung endothelial cells from three independent experiments following CLP challenge for 72 h. Green, anti-BrdU; Red, anti–CD31; Blue, DAPI. Arrows indicate proliferating endothelial cells. Scale bar, 200 m. Br indicates bronchia; V, vessels. (H) Quantification of BrdU+ endothelial cells from WT and GSDMD−/− mice lung post CLP for 72 h, n = 5. (I) Lung transvascular albumin permeability in WT and GSDMD−/− mice with or without CLP challenge, n = 5–6. (J & K) Representative images from three independent experiments (J) and quantification (K) of endothelial cells with cytosolic dsDNA in WT and GSDMD−/− mice lungs post-LPS (10 mg/kg, i.p, 24 h) challenge, n = 5. * P < 0.05, * * P < 0.01, two-tailed t-test. Values are shown as mean ± SD.
Fig. 3.
Fig. 3.. Intracellular dsDNA activates cGAS-STING pathway and induces defective endothelial cell proliferation.
(A) Time course of cGAMP concentration in mouse lung tissues post-LPS (10 mg/kg, i.p,) challenge, n = 4–11. (B) cGAMP concentration in lung tissues from Casp11fl/fl and Casp11fl/fl x Cdh5-CreERT2 mice post-LPS challenge (10 mg/kg, i.p, 6 h), n = 5–8. (C &D) circulating IFN-1β concentration in LPS treated mice (10 mg/kg, i.p, 6h). (C) Casp11fl/fl vs Casp11fl/fl x Cdh5-CreERT2 mice, n = 5–8; (D) WT vs Gsdmd−/− mice, n =5. (E & F) Expression of cGAS/STING responsive genes (CXCL10, IFIT1 and IFIT3) in lung ECs isolated from Casp11fl/fl and Casp11fl/fl x Cdh5-CreERT2 mice (E) or WT and Gsdmd−/− mice (F) post LPS challenge (10 mg/kg, 6 h, i.p), n = 5–8. (G) Immuno blot analysis of protein expression in hLMVECs transfected with mtDNA (3 μg/ml, 6h), n =3. (H) Intracellular cGAMP concentration in hLMVECs transfected with the positive control plasmid DNA or mtDNA (3 μg/ml, 6h), n = 4. (I & J) hLMVECs transfected with mtDNA (0–10 μg/ml), n = 5; (I) or cGAMP (0–12 μg/ml), n = 8, (J) for 20 h followed by serum treated (10%, 8 h). Endothelial cell proliferation (BrdU+ cells) was analyzed by proliferation kit. Data are shown as mean ± SD obtained from at least three independent experiments. * P < 0.05, * * P < 0.01, * * * P < 0.001, two-tailed t-test. Please also see Figure S2 & 3.
Fig. 4.
Fig. 4.. cGAS-STING pathway impairs endothelial regeneration and recovery from inflammatory injury.
(A) Quantification of BrdU+ lung endothelial cell from WT and cGas−/− mice post CLP for 72 h, n = 5. (B) Lung transvascular albumin permeability in WT and cGAS−/− mice with/without CLP challenge, n = 5–7. (C) Representative H&E staining of lung tissue from three independent experiments (WT and cGas−/−) post CLP challenge (24 and 72 h). Red arrows indicate infiltrated immune cells. Scale bar, 200 m. Br indicates bronchia; and V, vessels. (D) Myeloperoxidase (MPO) activity in mouse lungs after CLP challenge, n = 5–7. (E) IFN-1β concentration in serum from LPS treated WT and cGas−/− mice (10 mg/kg, i.p, 6h), n = 5. (F) Quantification of BrdU+ lung endothelial cells from WT mice post-LPS exposure (10 mg/kg, i.p) with or without treatment of the STING agonist, CMA, (10 mg/kg, i.p, every 24h from 24h-72h post LPS challenge) for up to 72h post-LPS, n = 5. (G) Lung transvascular albumin permeability in LPS treated mice with or without CMA treatment, n = 5. Data are shown as mean ± SD. * P < 0.05, * * P < 0.01, two-tailed t-test. Please also see Figure S4.
Fig. 5.
Fig. 5.. mtDNA and cGAMP prevent endothelial proliferation through inhibition of YAP.
(A, B) Immuno blot of protein expression in hLMVECs with transfection of mtDNA (3 μg/ml, 0–4h, A) or cGAMP (3 μg/ml, 0–4h, B), n = 3. (C, D) hLMVECs with cGAMP (3 μg/ml, 20h) transfection were challenged with 10% FBS for 1 h, and the YAP1-TAZ nuclear translocation in hLMVECs were analyzed by Immunofluorescence staining. (C) Representative image and (D) percentage of hLMVECs with YAP1-TAZ nuclear trans-localization with FBS challenge. Values are shown as mean ± SD; data were obtained from three independent experiments, n= 7–8. (E) Immuno blot analysis YAP1 phosphorylation and YAP1 expression in hLMVECs with transfection of mtDNA (3 μg/ml, 20h) or cGAMP (3 μg/ml, 20h), n=3. (F, G) Expression of cyclin D1,D2, D3 in hLMVECs transfected with mtDNA (F) or cGAMP (G) (3 μg/ml, 20h), n = 3. (H) YAP1 restores mtDNA induced decrease of cyclin D1, 2, 3 expression in hLMVECs. Control plasmid or YAP1 plasmid (3 μg/ml, 48h) transfected hLMVECs were transfected with mtDNA (3 μg/ml) for 20h, the expression of cyclin D1, 2, 3 were analyzed by immunoblotting, n = 3. (I) Transfection of TBK1 induces LATS1 phosphorylation. HEK293T cells were co-transfected with plasmids encoding TBK1 and YAP1 (3 μg/ml, 48h) before immunoblotting analysis, n = 4. (J) HEK293 cells were co-transfected with myc-tagged LATS1 (myc-LATS1) and either vector control (Vector), Flag-tagged TBK1 (Flag-TBK1). LATS1 was immunoprecipitated to assess the binding proteins by immunoblotting. Input lysates were used to blot protein and verify the transfected protein expression. Representative images from three independent experiments, n = 3. (K) IP-purified myc-LATS1 (Myc-LATS1) from myc-LATS1 transfected HEK293 cells was co-incubated with IP-purified Flag-TBK1 from Fag-TBK1 transfected HEK293 cells. Purified proteins were used for in vitro kinase assay. Phosphorylated LATS1 (S909) was analyzed via immunoblotting and quantitated via densitometry, n = 3. (L-N) Endothelial cell specific deletion of Yap1 (Yap1fl/fl x Cdh5-CreERT2) in mice prevents endothelial regeneration and recovery from lung injury. Yap1fl/fl mice were crossed with Cdh5-CreERT2 to delete YAP1 in endothelial cells. After tamoxifen induced deletion of Yap1, mice were used for CLP. (L) Representative micrographs from three independent experiments showing endothelial cell (EC) proliferation in lungs from Yap1fl/fl and Yap1fl/fl x Cdh5-CreERT2 mice at 72h post CLP. Green, anti-BrdU; Red, anti–CD31; Blue, DAPI. Arrows indicate proliferating endothelial cells. Scale bar, 200 m. Br indicates bronchia; V, vessel. (M) Graphic presentation of increased proliferating endothelial cells in Yap1fl/fl as compared to Yap1fl/fl x Cdh5-CreERT2 lungs post-CLP, n = 5. (N) Lung transvascular permeability measurement following CLP showed defective recovery in Yap1fl/fl x Cdh5-CreERT2 as compared to Yap1fl/fl mice, n = 5. Data are shown as mean ± SD. * P < 0.05, * * P < 0.01, * * * P < 0.001, two-tailed t-test. Please also see Figure S2, 4 & 5.

Comment in

References

    1. Ablasser A, Goldeck M, Cavlar T, Deimling T, Witte G, Rohl I, Hopfner KP, Ludwig J, and Hornung V (2013). cGAS produces a 2’−5’-linked cyclic dinucleotide second messenger that activates STING. Nature 498, 380–384. - PMC - PubMed
    1. Ahn J, Gutman D, Saijo S, and Barber GN (2012). STING manifests self DNA-dependent inflammatory disease. Proc Natl Acad Sci U S A 109, 19386–19391. - PMC - PubMed
    1. Almine JF, O’Hare CA, Dunphy G, Haga IR, Naik RJ, Atrih A, Connolly DJ, Taylor J, Kelsall IR, Bowie AG, et al. (2017). IFI16 and cGAS cooperate in the activation of STING during DNA sensing in human keratinocytes. Nat Commun 8, 14392. - PMC - PubMed
    1. Broz P (2015). Immunology: Caspase target drives pyroptosis. Nature 526, 642–643. - PubMed
    1. Burdette DL, and Vance RE (2013). STING and the innate immune response to nucleic acids in the cytosol. Nat Immunol 14, 19–26. - PubMed

Publication types

MeSH terms