. 2020 Mar 17;75(10):1159-1174.
doi: 10.1016/j.jacc.2019.12.066.

Stem Cell-Derived Cardiomyocytes and Beta-Adrenergic Receptor Blockade in Duchenne Muscular Dystrophy Cardiomyopathy

Affiliations

Stem Cell-Derived Cardiomyocytes and Beta-Adrenergic Receptor Blockade in Duchenne Muscular Dystrophy Cardiomyopathy

Forum Kamdar et al. J Am Coll Cardiol. .

Abstract

Background: Although cardiomyopathy has emerged as a leading cause of death in Duchenne muscular dystrophy (DMD), limited studies and therapies have emerged for dystrophic heart failure.

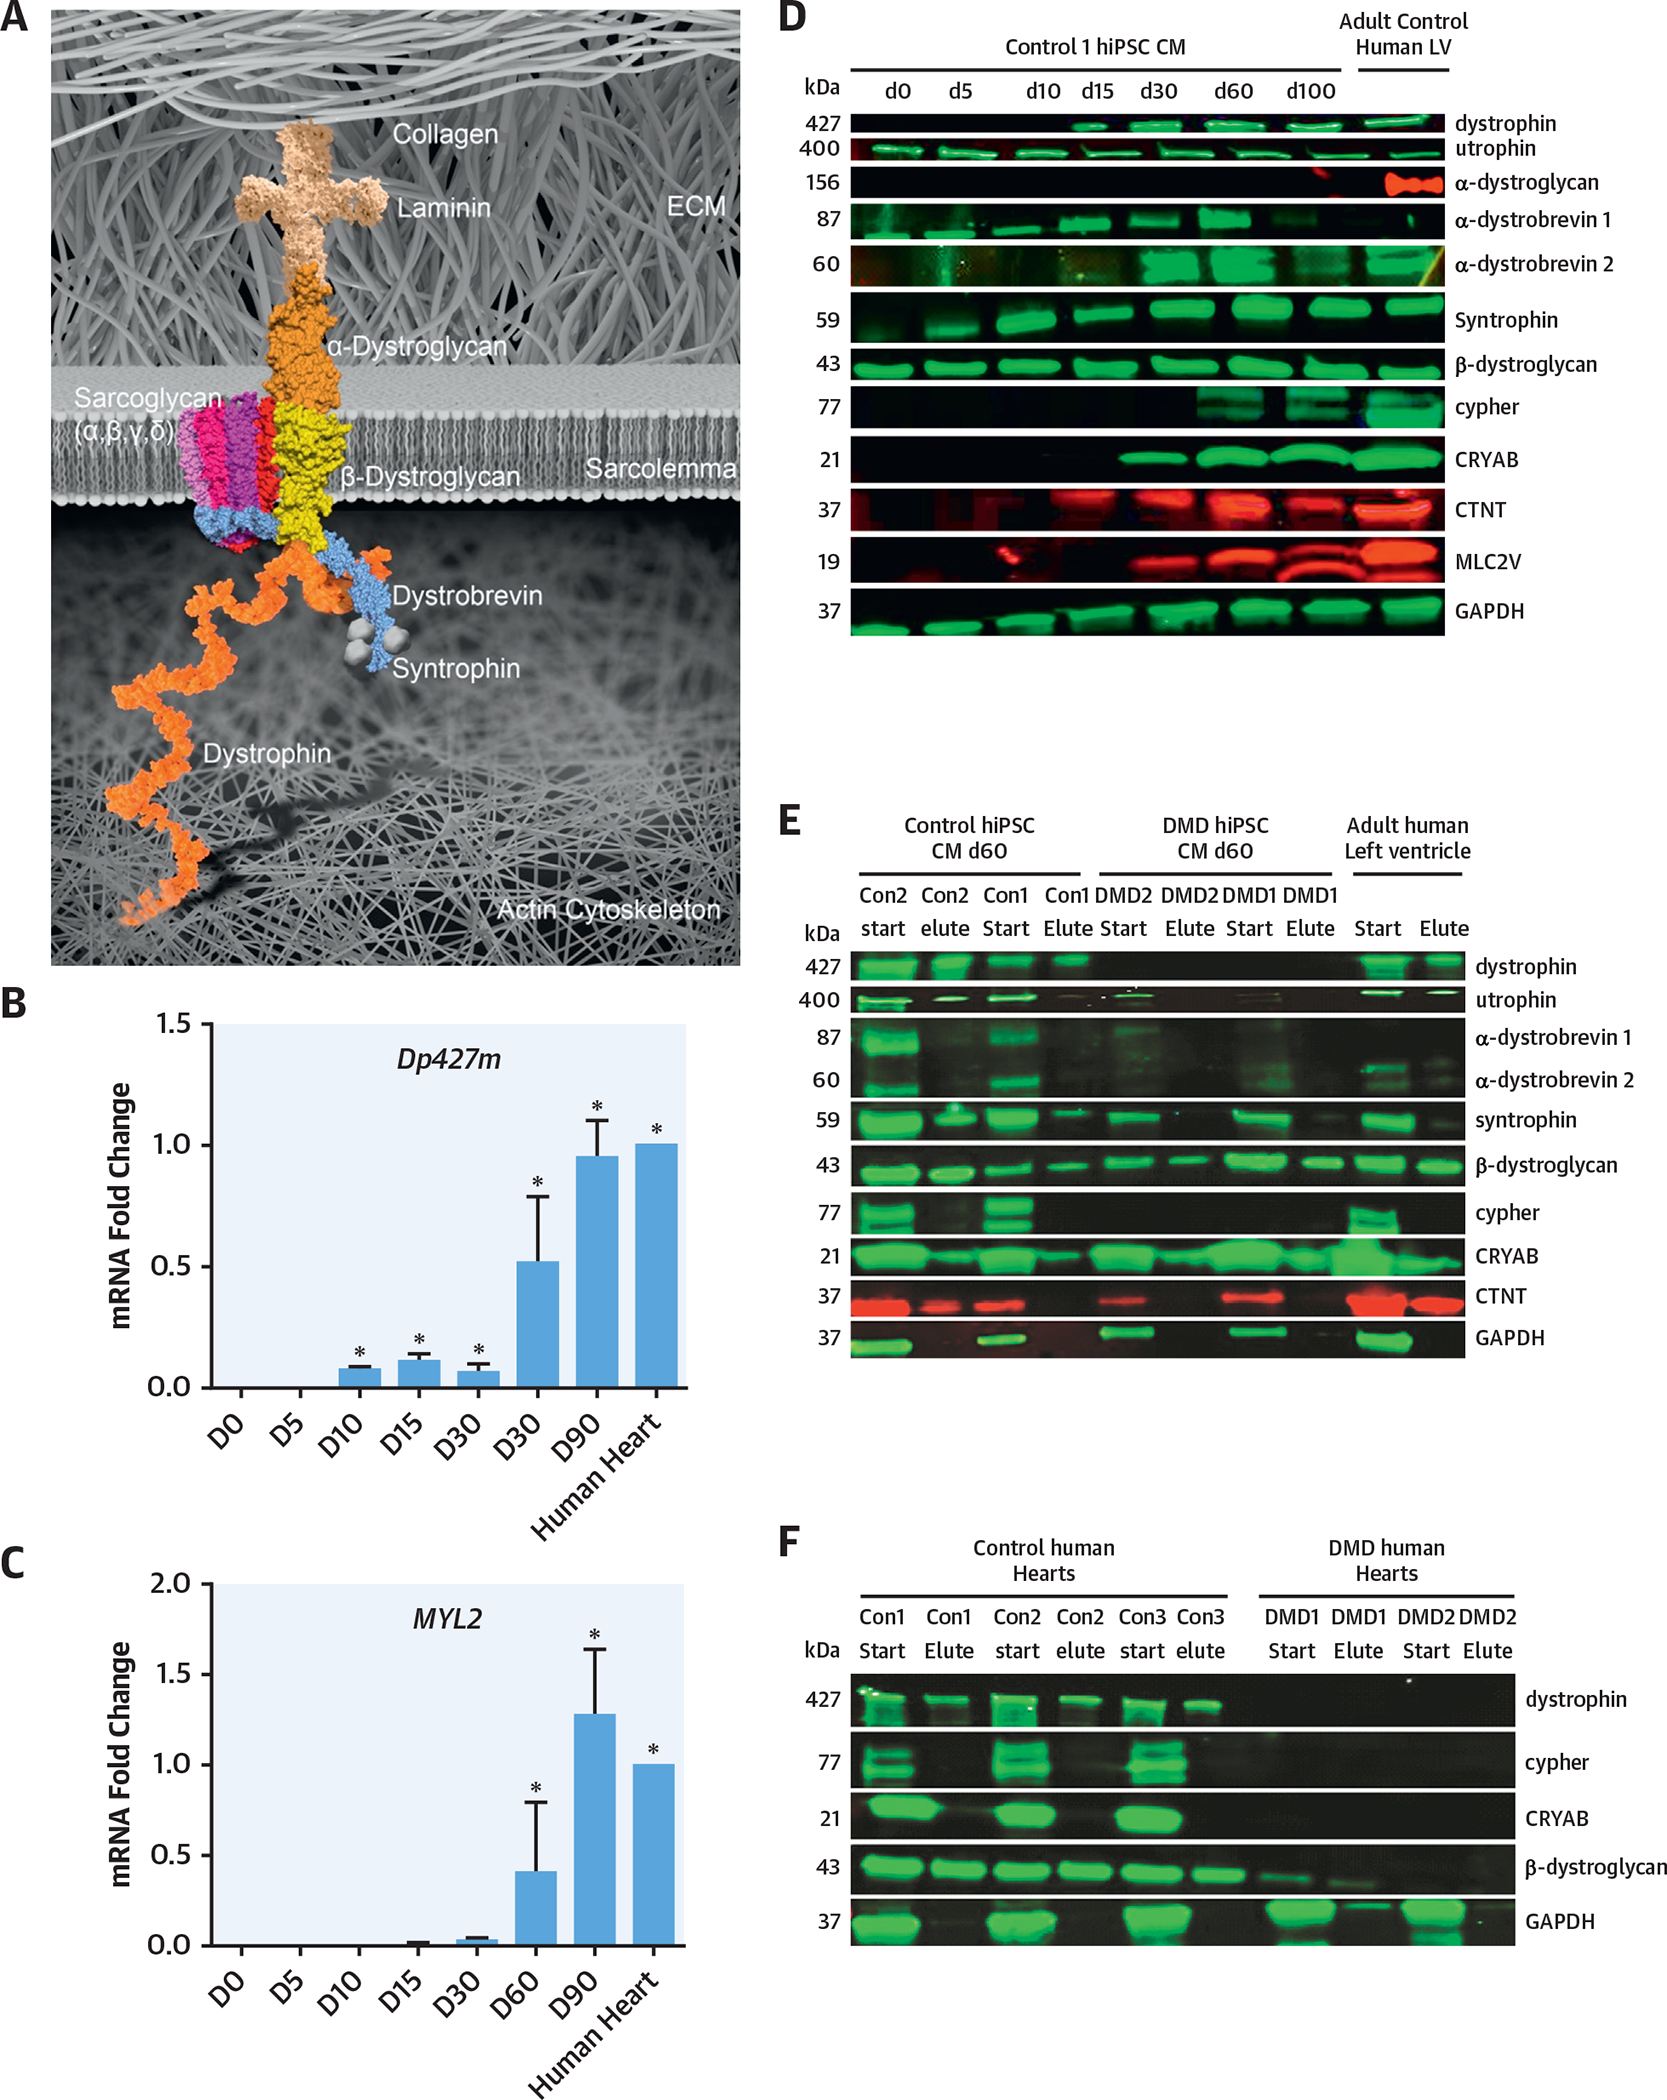
Objectives: The purpose of this study was to model DMD cardiomyopathy using DMD patient-specific human induced pluripotent stem cell (hiPSC)-derived cardiomyocytes and to identify physiological changes and future drug therapies.

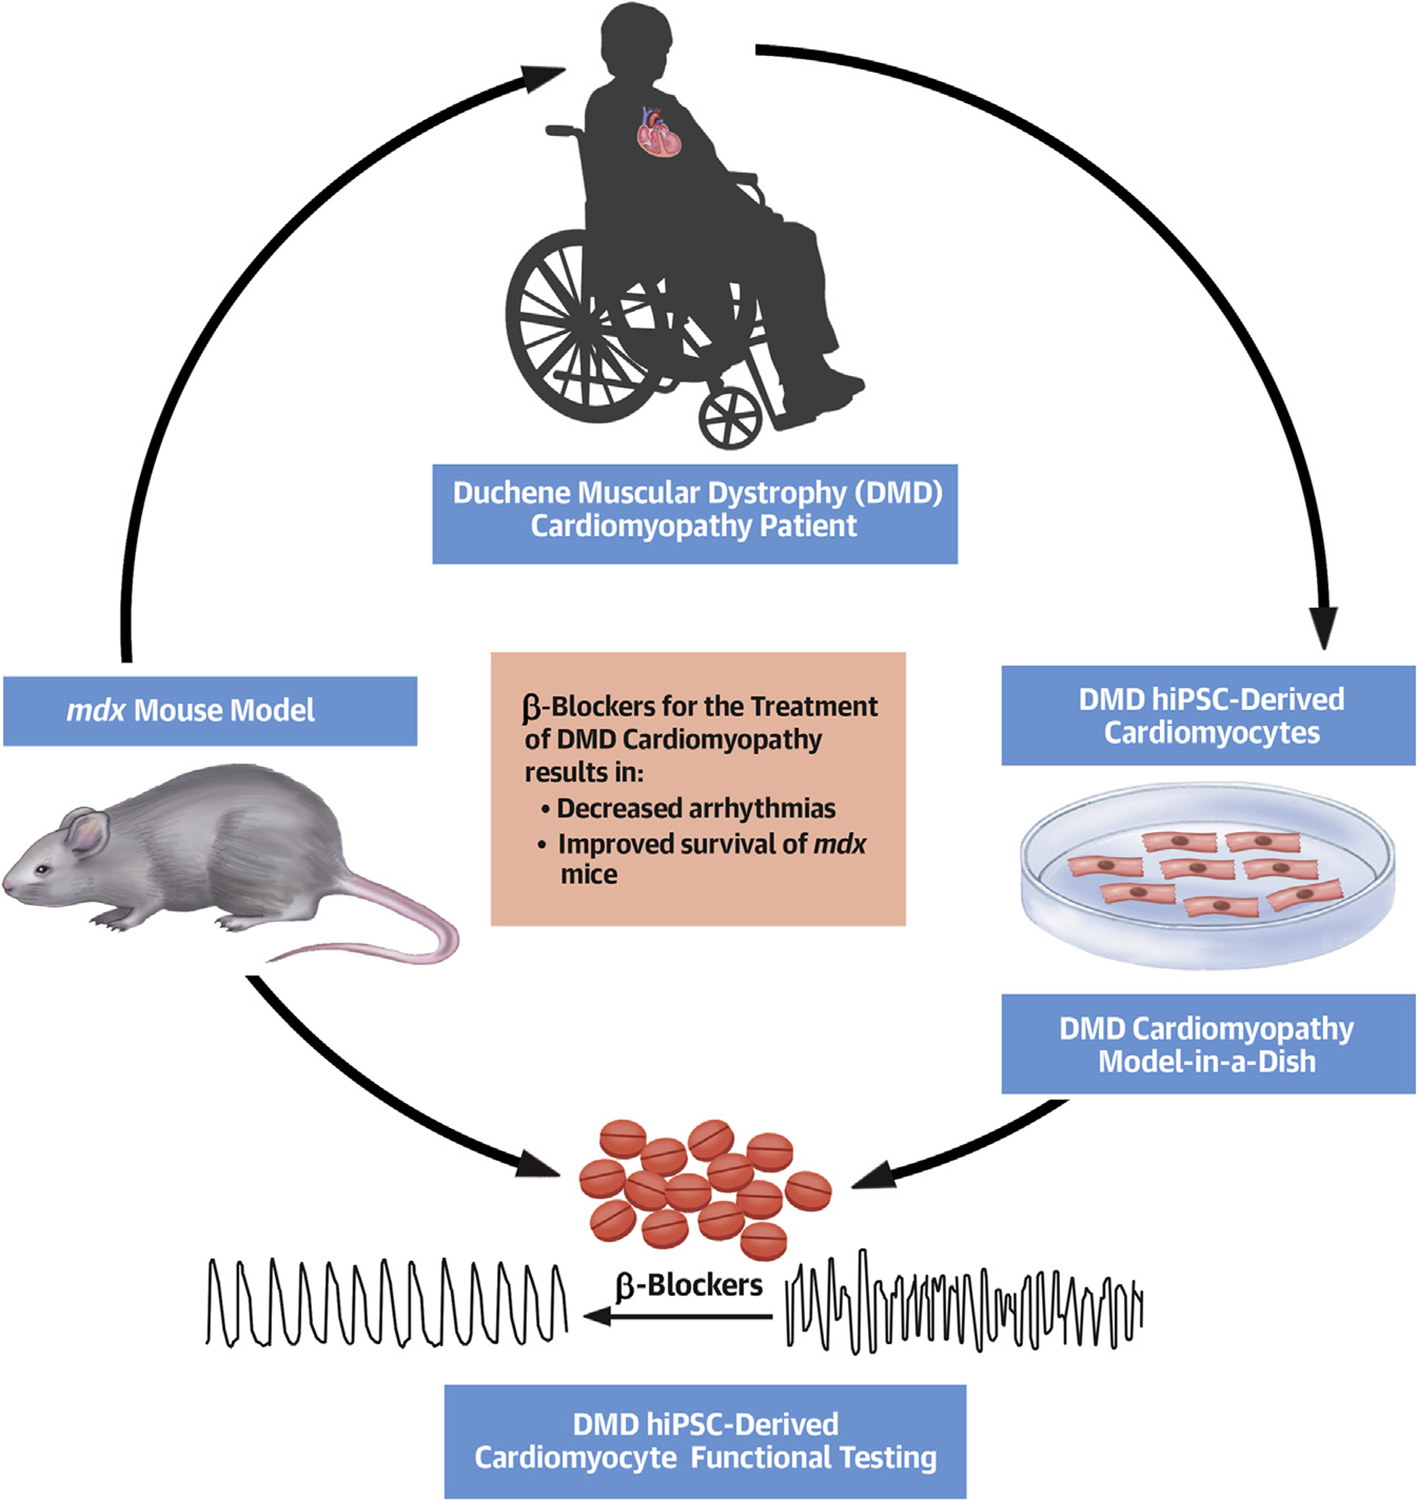
Methods: To explore and define therapies for DMD cardiomyopathy, the authors used DMD patient-specific hiPSC-derived cardiomyocytes to examine the physiological response to adrenergic agonists and β-blocker treatment. The authors further examined these agents in vivo using wild-type and mdx mouse models.

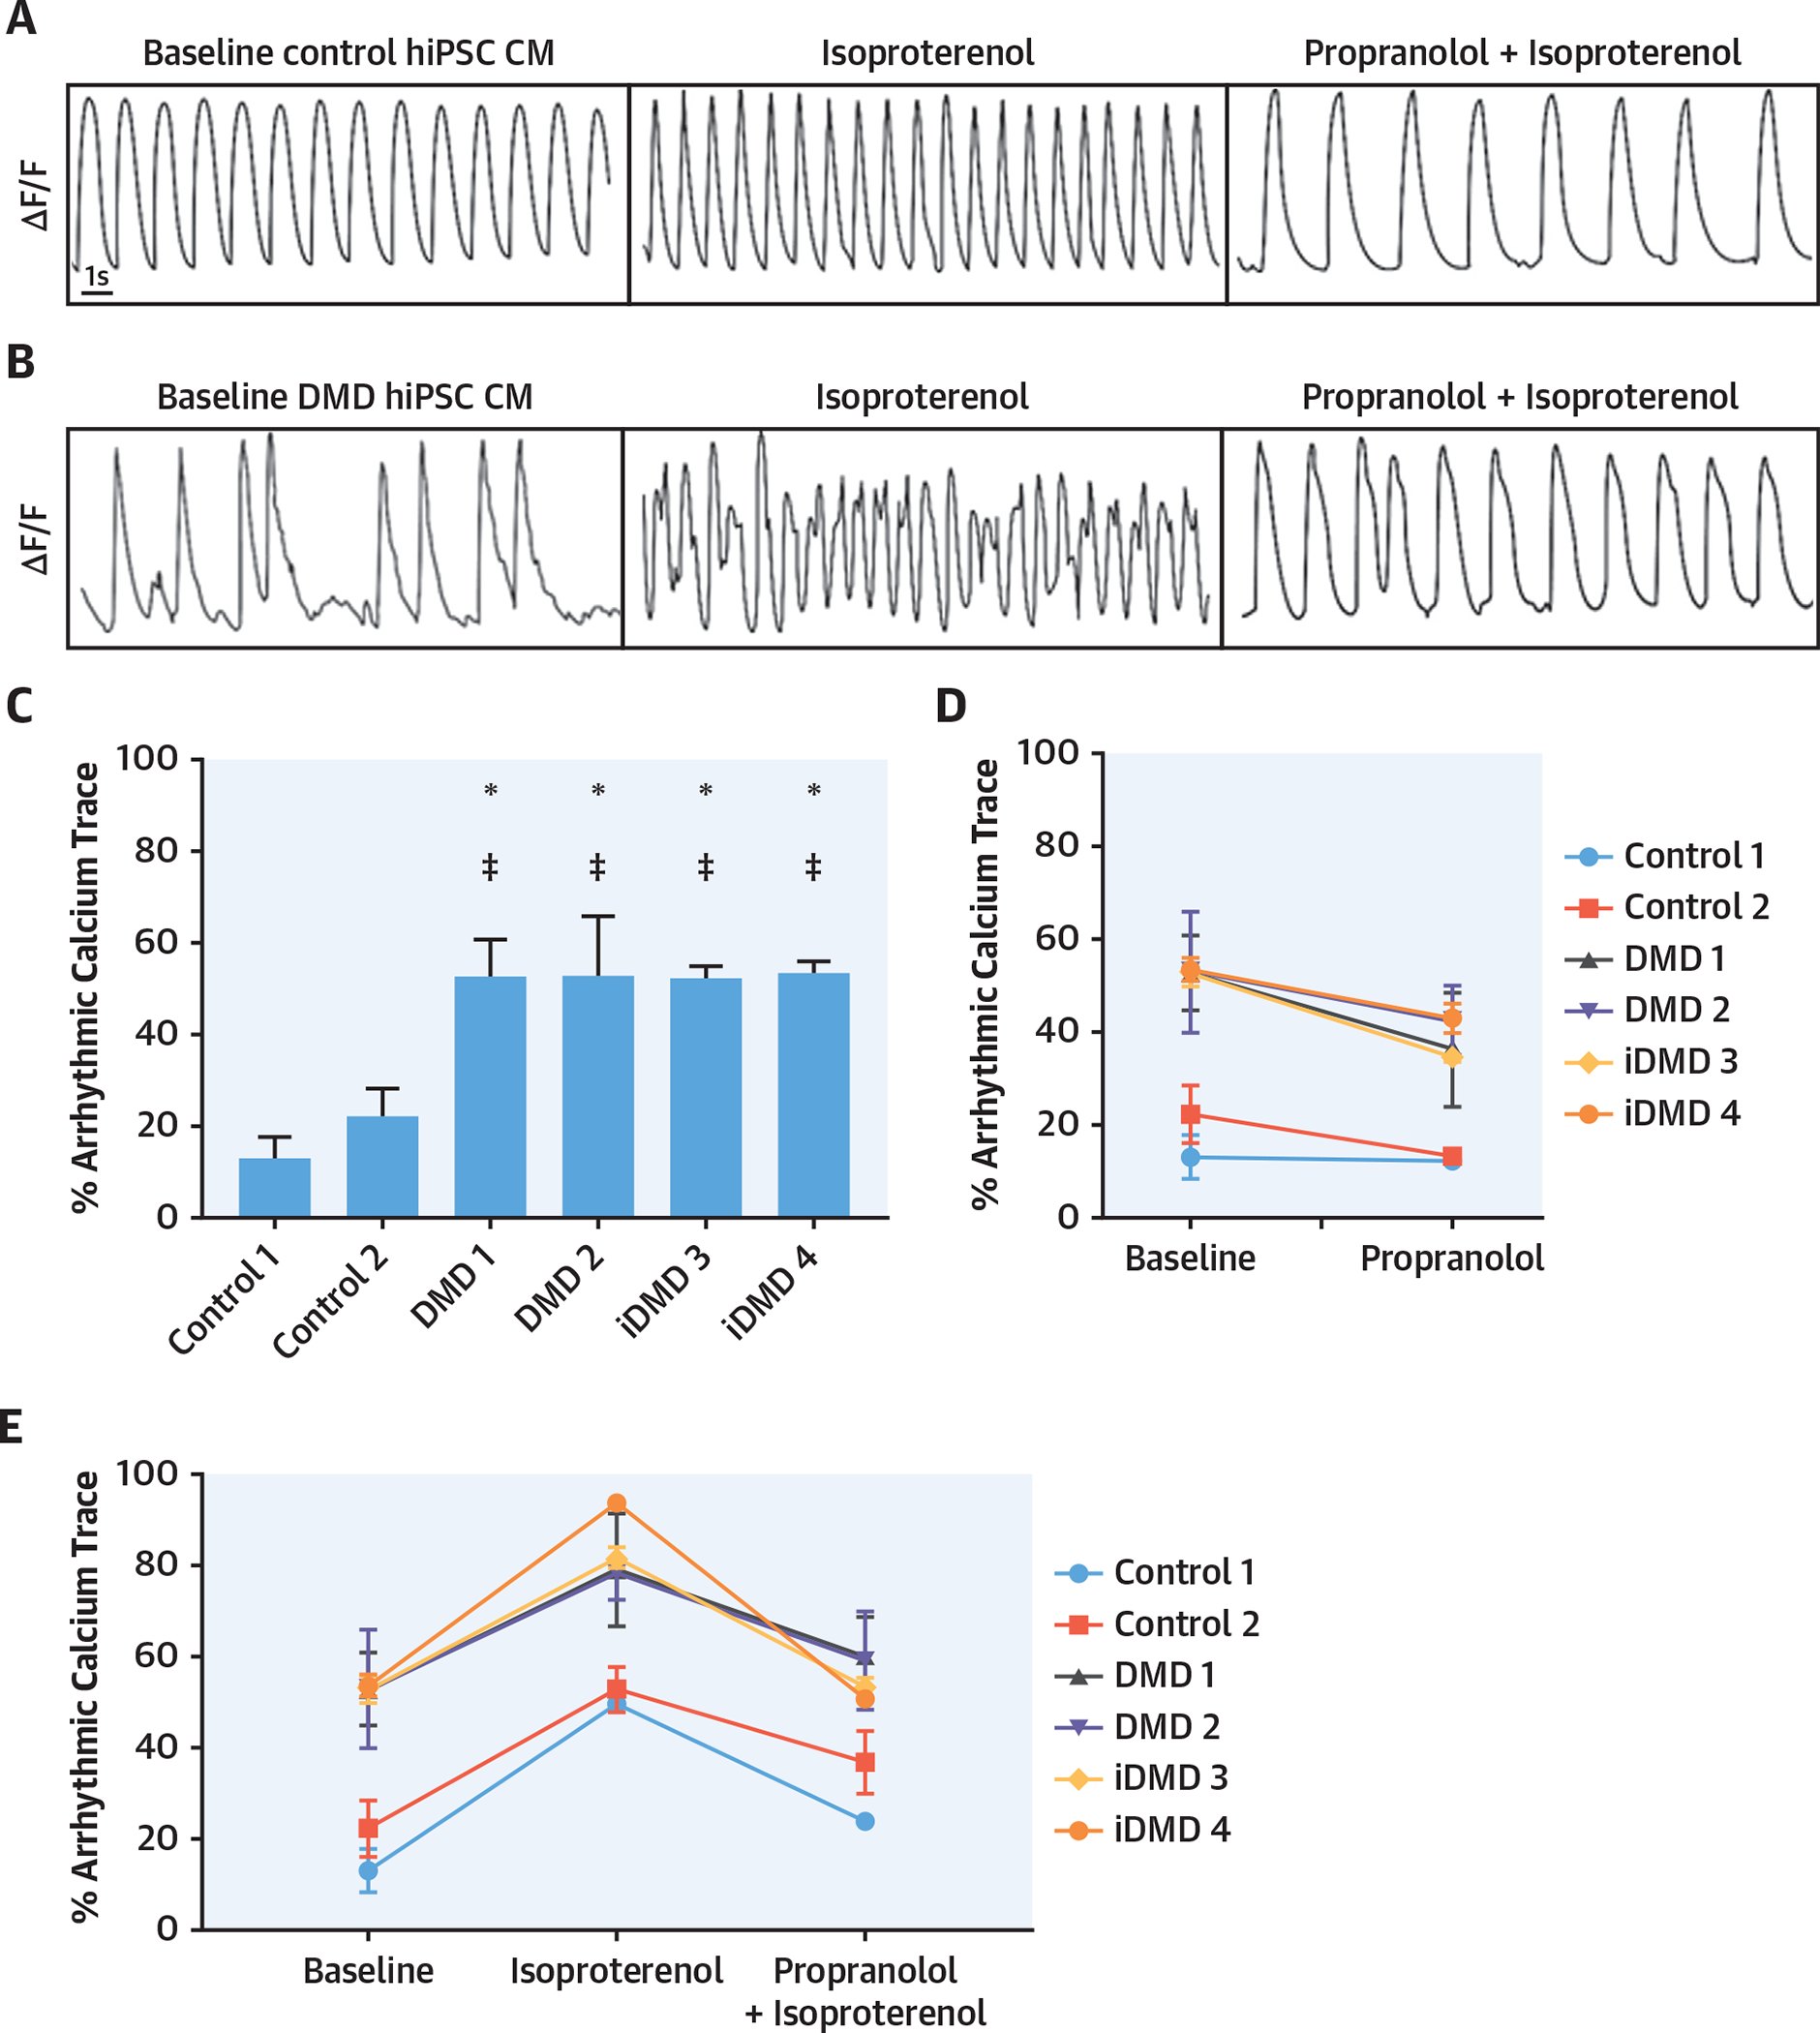
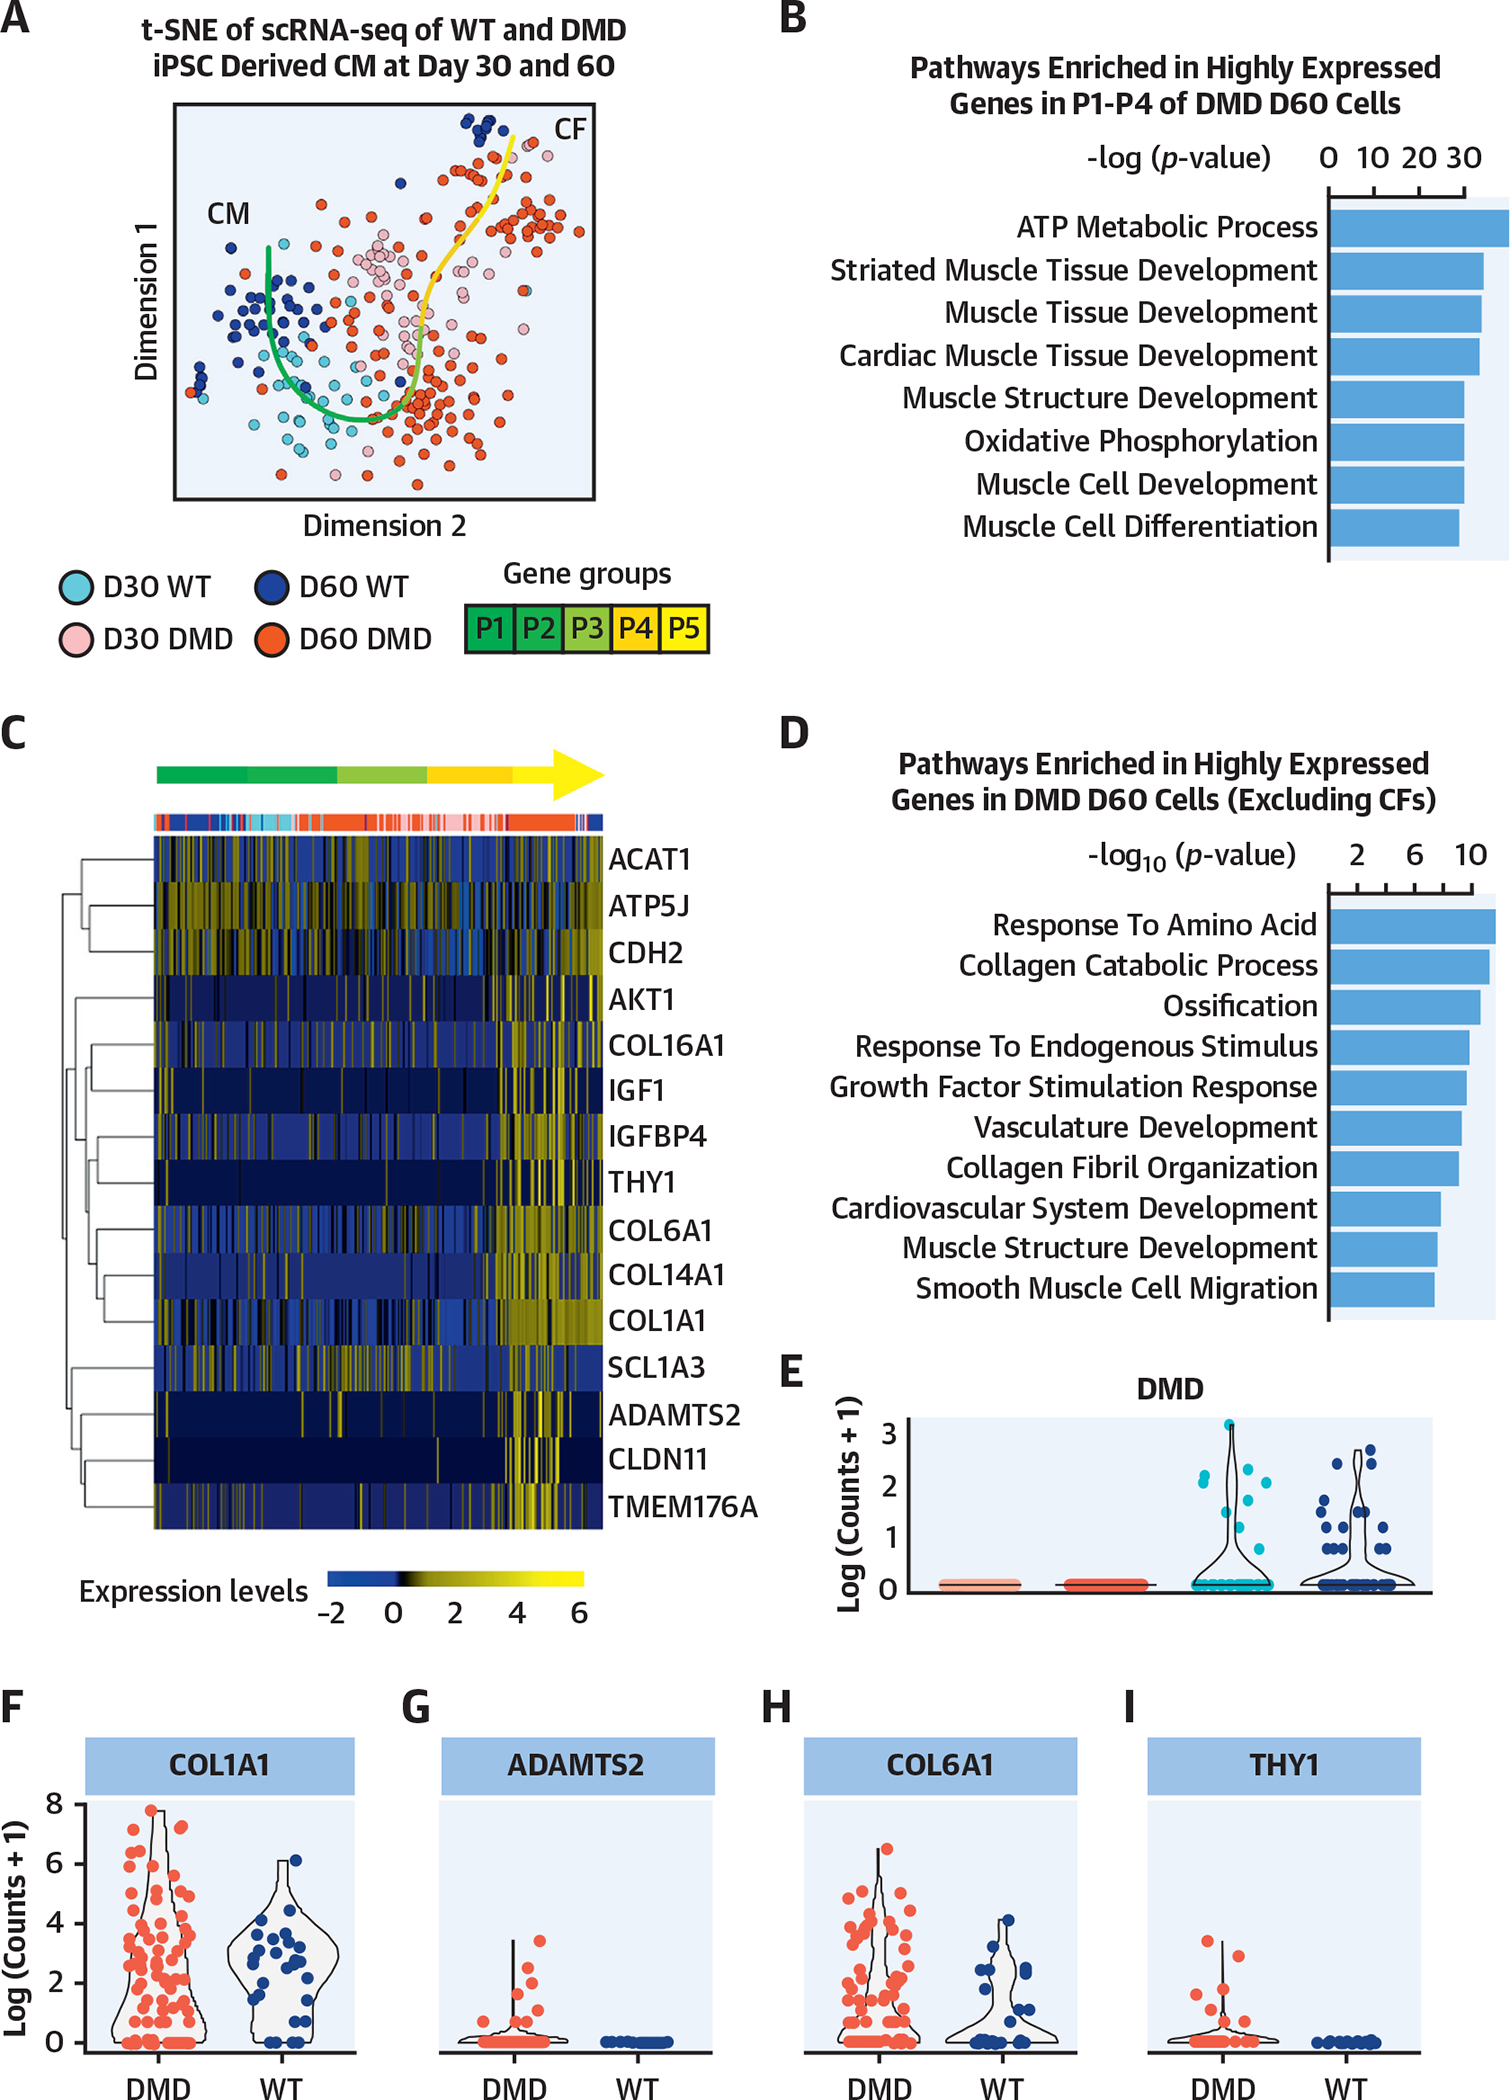
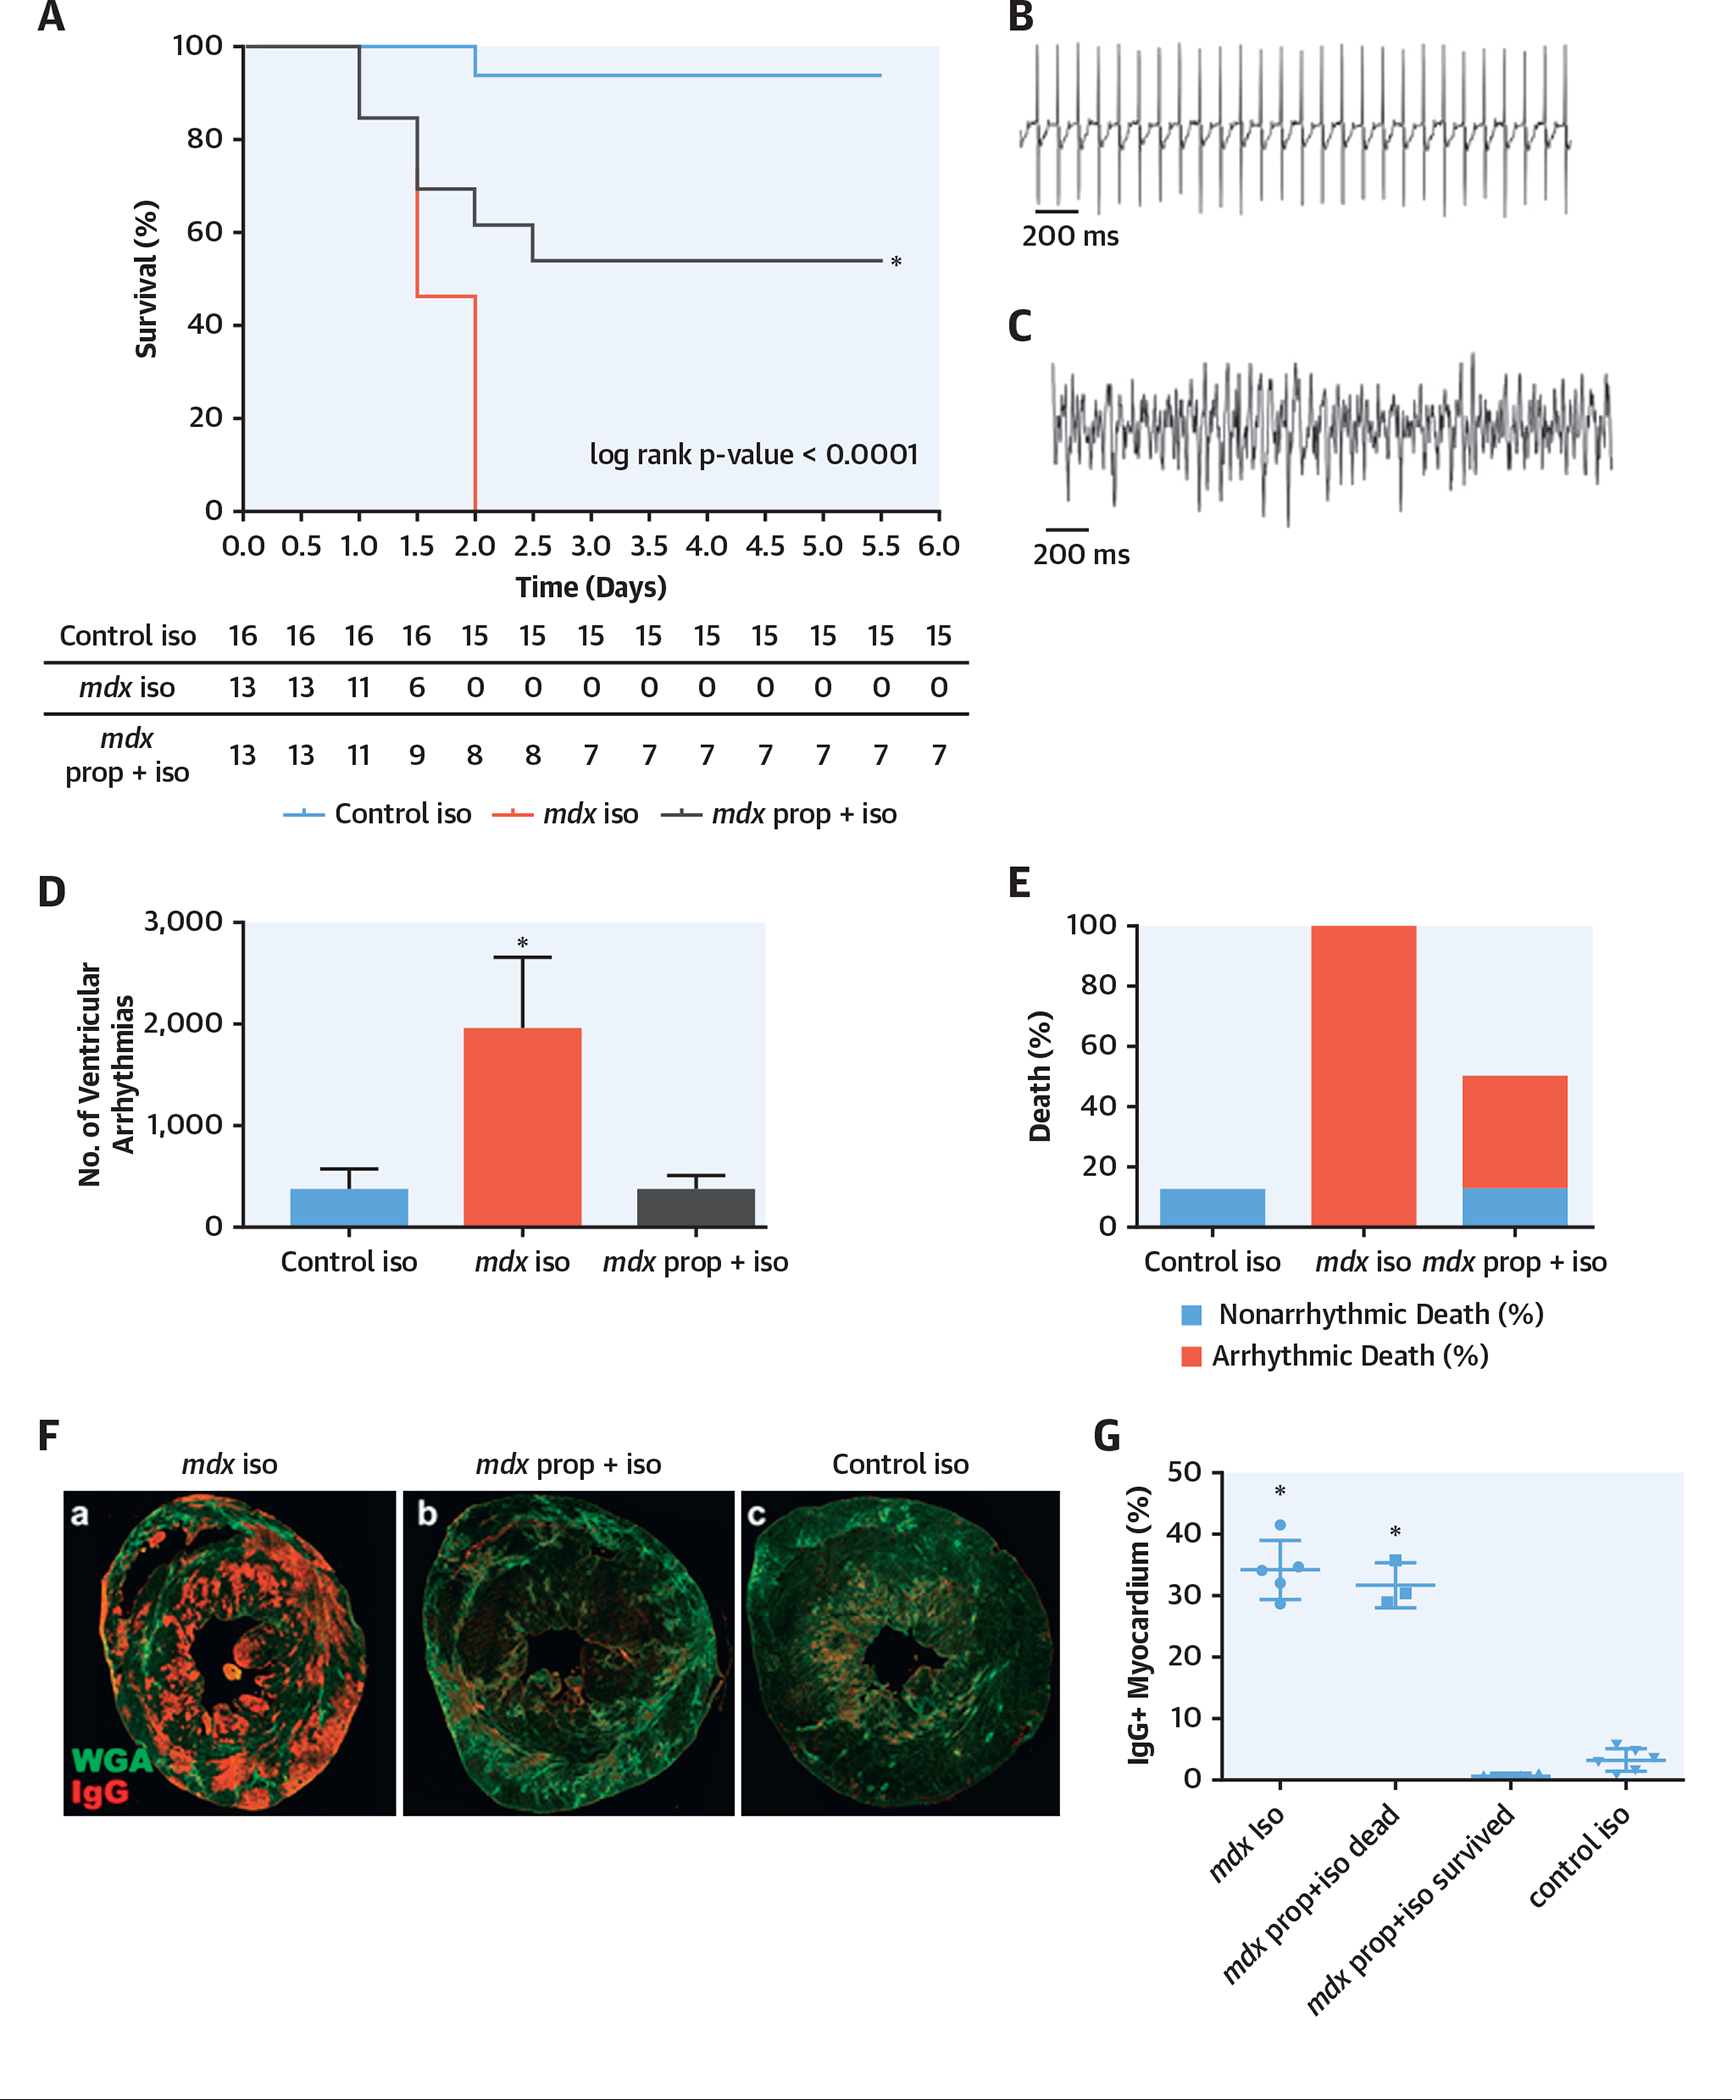
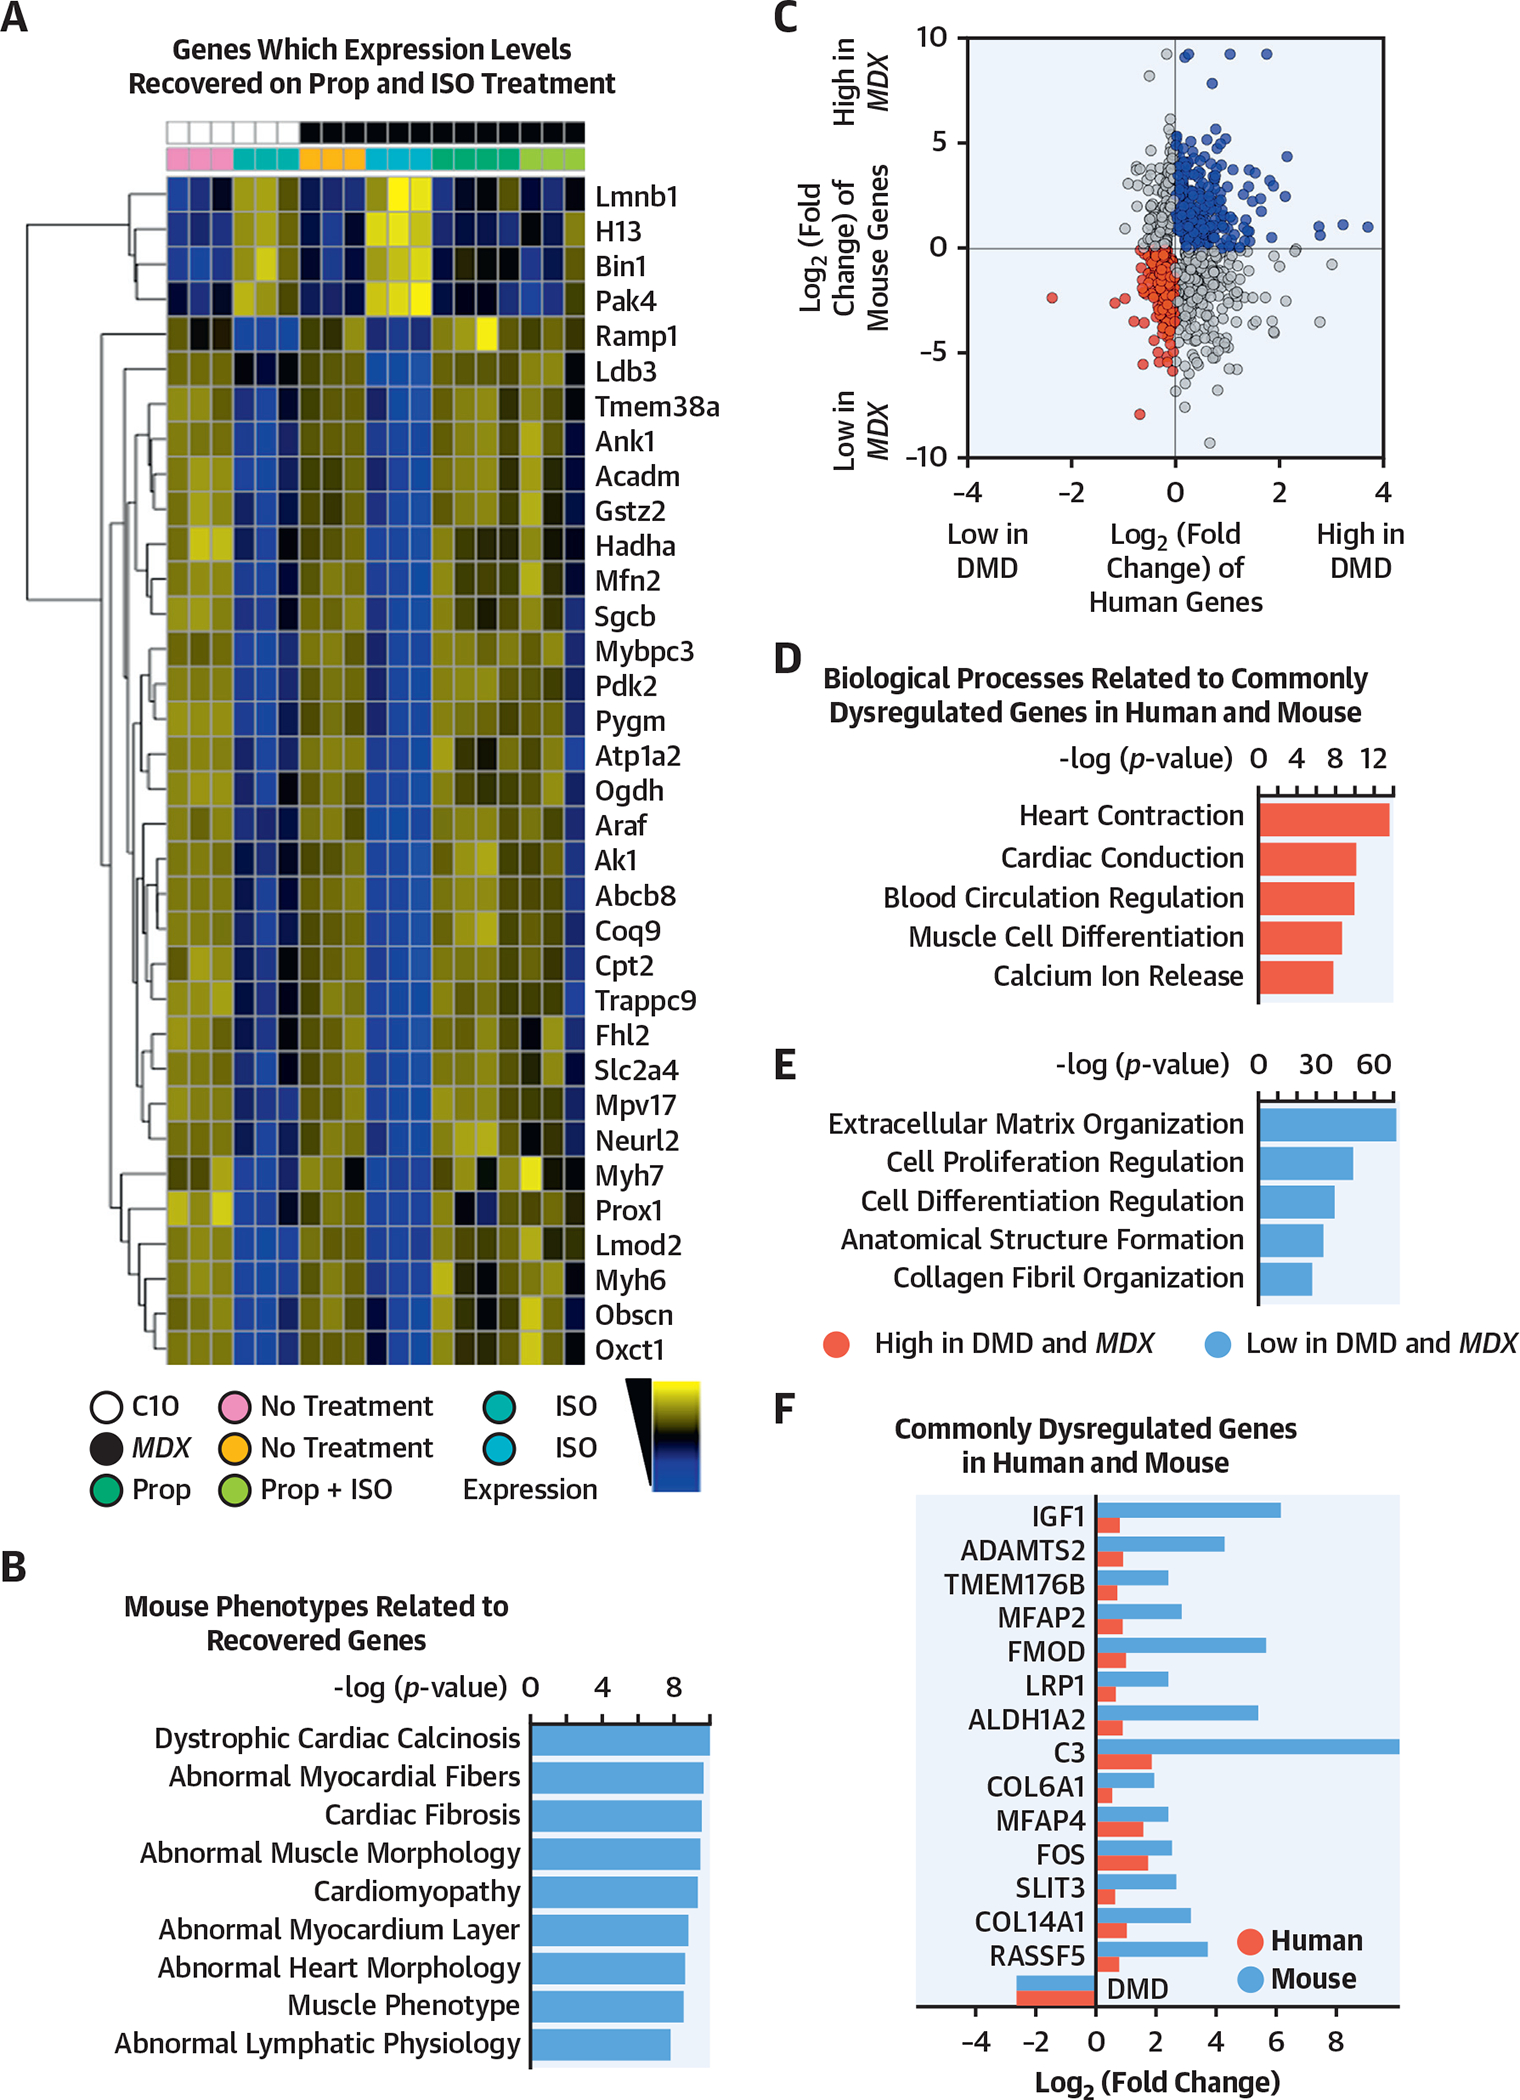
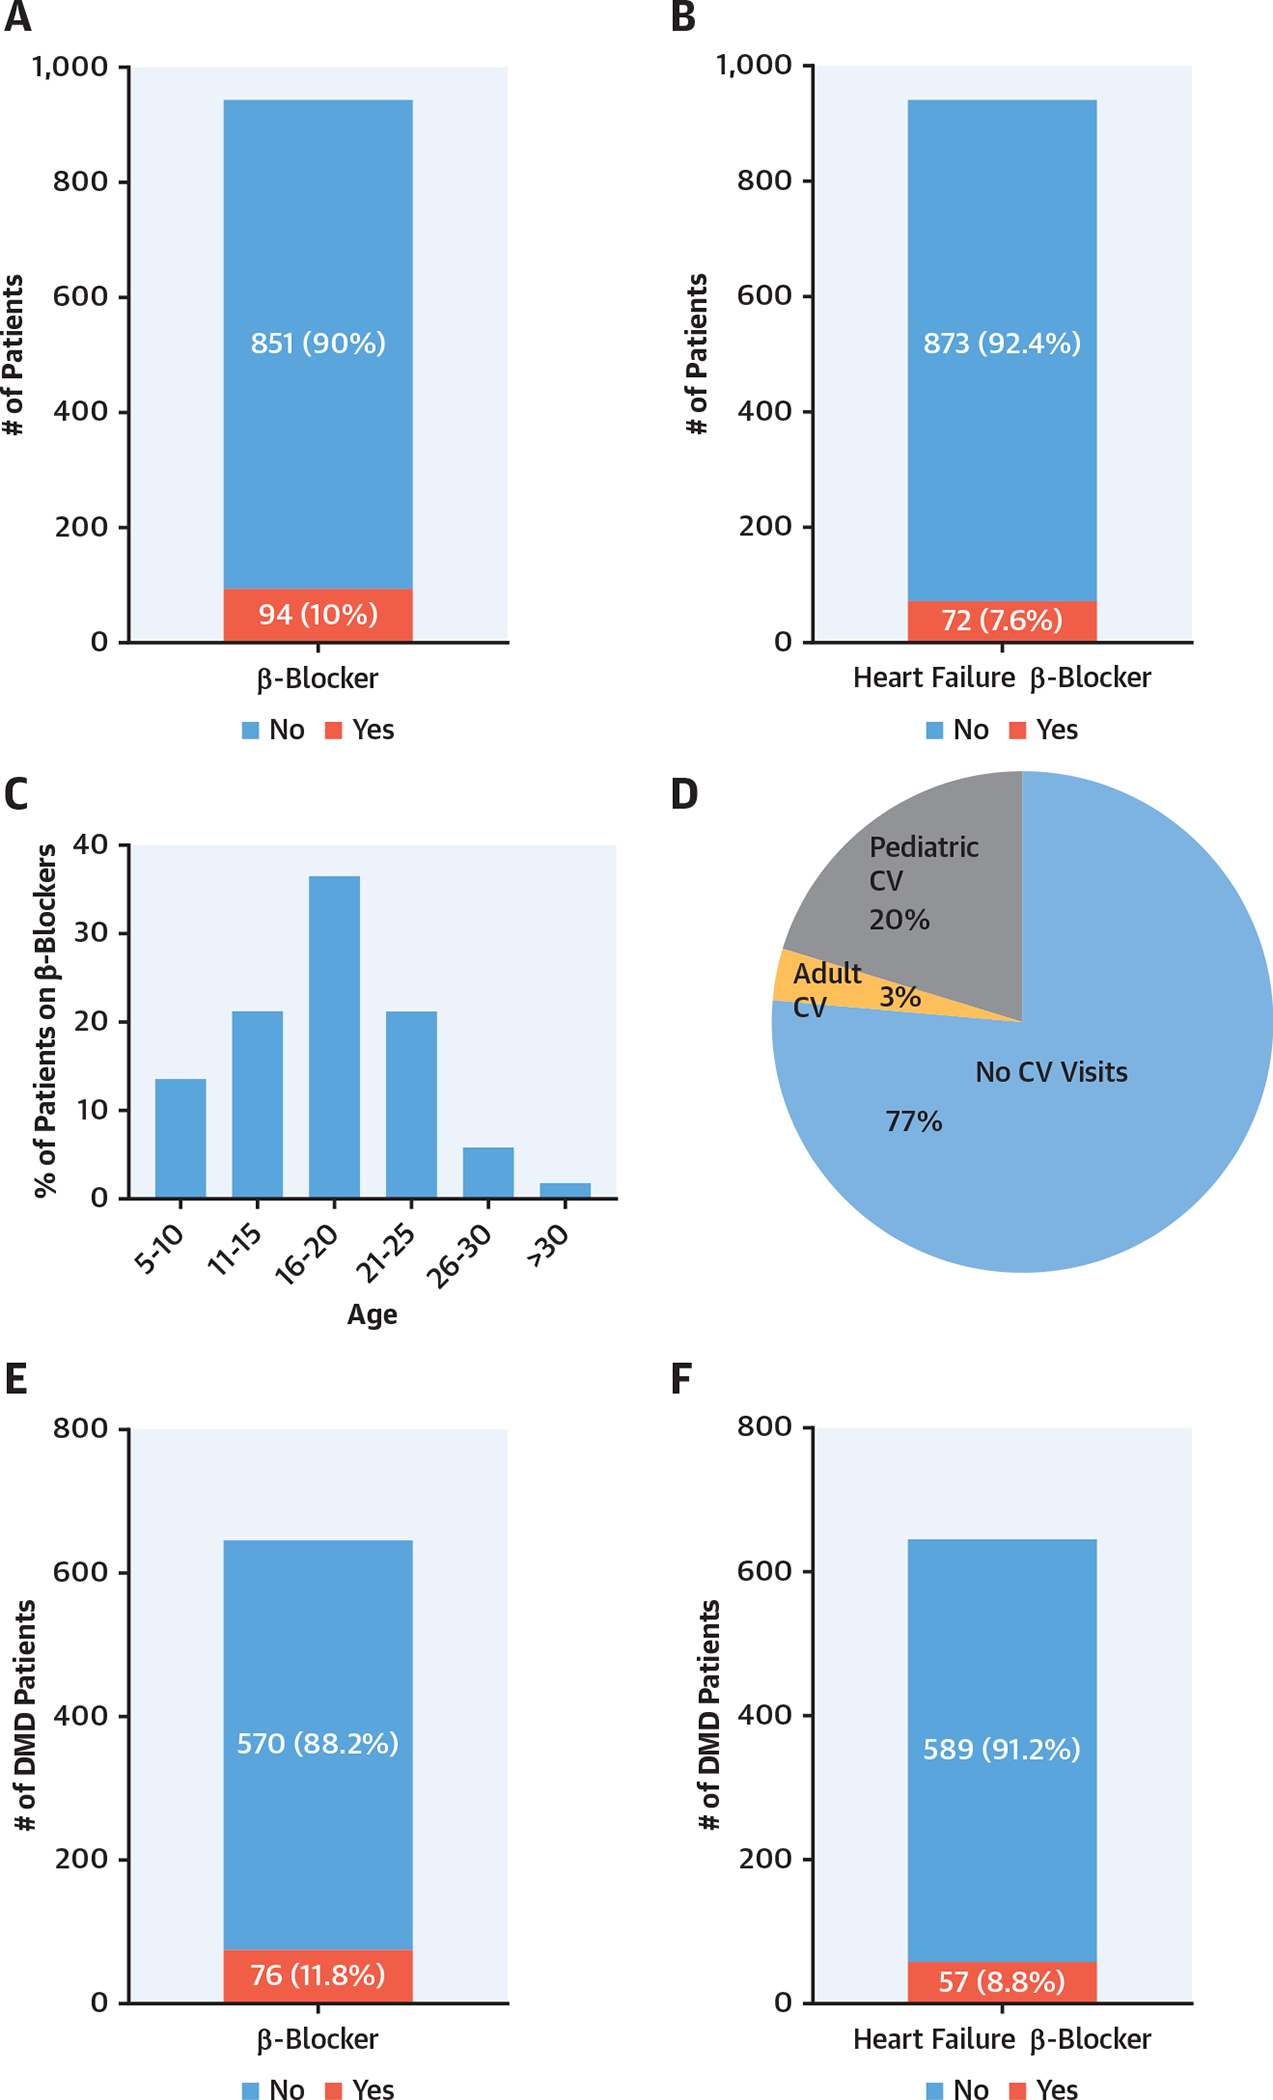
Results: At baseline and following adrenergic stimulation, DMD hiPSC-derived cardiomyocytes had a significant increase in arrhythmic calcium traces compared to isogenic controls. Furthermore, these arrhythmias were significantly decreased with propranolol treatment. Using telemetry monitoring, the authors observed that mdx mice, which lack dystrophin, had an arrhythmic death when stimulated with isoproterenol; the lethal arrhythmias were rescued, in part, by propranolol pre-treatment. Using single-cell and bulk RNA sequencing (RNA-seq), the authors compared DMD and control hiPSC-derived cardiomyocytes, mdx mice, and control mice (in the presence or absence of propranolol and isoproterenol) and defined pathways that were perturbed under baseline conditions and pathways that were normalized after propranolol treatment in the mdx model. The authors also undertook transcriptome analysis of human DMD left ventricle samples and found that DMD hiPSC-derived cardiomyocytes have dysregulated pathways similar to the human DMD heart. The authors further determined that relatively few patients with DMD see a cardiovascular specialist or receive β-blocker therapy.

Conclusions: The results highlight mechanisms and therapeutic interventions from human to animal and back to human in the dystrophic heart. These results may serve as a prelude for an adequately powered clinical study that examines the impact of β-blocker therapy in patients with dystrophinopathies.

Keywords: Duchenne disease modeling; heart failure; human inducible pluripotent stem cells; muscular dystrophy cardiomyopathy; β-blockers.


Figures

FIGURE 1
FIGURE 1. The DGC in hiPSC-Derived CMs and Human Cardiac Samples in the Presence and Absence of Dystrophin
(A) Schematic of the DGC. (B, C) qRT-PCR time course of Dp427m (full-length muscle dystrophin gene) and MYL2 genes in control hiPSC-derived CMs (n = 3). (D) Western blot expression of the DGC components in hiPSC-derived CMs and adult human LV. These results showed that the day 60 hiPSC-derived CMs expressed the protein components of the DGC and sarcomeric proteins (n = 3). (E) WGA pulldown of control and DMD hiPSC-derived CM lines at day 60 differentiation demonstrated that the DGC components were all expressed and pulled down in hiPSC-derived CMs and adult human LV. In the DMD hiPSC-derived CMs at day 60, the absence of dystrophin leads to the lack of nucleation of the DGC. Cypher was also absent in DMD hiPSC-derived CMs (n = 3). (F) Control human LV samples showed the expression and pulldown of dystrophin, whereas an absence of dystrophin was seen in the 2 human DMD LV samples (n = 3). The DMD human LV samples have a lack of nucleation of the DGC, including the absence of cypher. CM = cardiomyocyte; Con = control; D = day; DGC = dystrophin-glycoprotein complex; DMD = Duchenne muscular dystrophy; GAPDH = glyceraldehyde 3-phsophate dehydrogenase; hiPSC = human induced pluripotent-derived cardiomyocytes; LV = left ventricle; qRT-PCR = quantitative real-time polymerase chain reaction; WGA = wheat germ agglutinin.
FIGURE 2
FIGURE 2. DMD hiPSC Derived-CMs and Isogenic DMD-Null hiPSC-Derived CMs Have Increased Arrhythmias at Baseline That Were Increased With the Addition of a β-Adrenergic Agonist and Rescued With Addition of a β-Adrenergic Antagonist
(A, B) Examples of calcium traces at baseline; isoproterenol, propranolol, and isoproterenol-treated control; and DMD hiPSC-derived CMs. (C) Arrhythmic calcium traces were significantly increased in DMD hiPSC-derived CMs at baseline versus control hiPSC-derived CMs (*p < 0.05 vs. control 1 and p < 0.05 vs. control 2; n = 120 cells/experiment repeated in triplicate). (D) Propranolol decreased arrhythmic calcium traces in all DMD hiPSC-derived CMs from baseline. (E) Isoproterenol increased arrhythmic calcium traces in DMD hiPSC-derived CMs from baseline while pre-treatment with propranolol followed by isoproterenol prevented isoproterenol-induced increase in arrhythmic calcium traces. Abbreviations as in Figure 1.
FIGURE 3
FIGURE 3. Single-Cell Genomics of Isogenic DMD hiPSC-Derived CMs
(A) The small conditional RNA-seq data matrix is normalized and treated for batch effects using ComBat (Surrogate Variable Analysis R package, JHU Bloomberg School of Public Health, Baltimore, Maryland). The t-SNE plot shows the clustering of the resulting matrix and indicates grouping of CMs and CFs. The dark red points represent DMD cells at day 60 (n = 151), pink points represent DMD cells at day 30 (n = 52), dark blue points represent WT cells at day 60 (n = 54), and light blue points represent WT cells at day 30 (n = 41). Using R package princurve (AT&T Bell Laboratories, Murray Hill, New Jersey), a principal curve is fit to the t-SNE data matrix, and the curve is split into 5 segments, shown in the green gradient labeled P1 to P5. (B) Highly expressed gene groups within each segment determined pathways enriched in segments P1 to P4. These segments indicate the subset of cells that are cardiomyocytes. According to the top 8 hits shown in the bar plot of the ToppGene pathway analysis (Cincinnati Children’s Hospital Medical Center, Cincinnati, Ohio), based on −log(p value), the genes highly expressed in P1 to P4 are linked to cardiac function. (C) The heatmap highlights genes that are related to fibrosis, calcium-channel transportation issues, and GPCR signaling and metabolism. Expression is calculated by getting log-transformed, normalized counts of the reads mapped to the gene. Columns are in the same order as principal curve segments P1 to P5, indicated by the same green gradient color as in A. (D) The pathway analysis indicated the biological processes enriched in highly expressed genes in DMD day 60 cells, after excluding the 62 CDH11-expressing CF cells. (E) The violin plot shows the log-transformed, normalized expression of the reads mapped to the deleted DMD sequence. The day 30 and day 60 DMD cells do not show the presence of this sequence, confirming that the DMD sequence is present only in the WT cells. (F to I) The violin plots show the log-transformed, normalized expression of genes related to fibrosis and indicate that there is higher representation of these genes in the DMD day 60 samples compared with WT day 60. CF = cardiofibroblast; GPCR = G protein-coupled receptor; t-SNE = t-stochastic neighbor embedding; WT = wild type; other abbreviations as in Figure 1.
FIGURE 4
FIGURE 4. β-Adrenergic Antagonist Propranolol Rescued mdx Mice From Isoproterenol-Induced Death
(A) Kaplan-Meier survival curve demonstrated normal survival for male control (C10) mice exposed to isoproterenol (blue line) (n = 16), 100% death in male mdx mice after isoproterenol exposure (red line) (n = 13), and 54% survival in mdx mice pre-treated with propranolol and then isoproterenol (green line) (n = 13) (mdx: all male animals; mean age: 5.3 months; range: 3.4 to 5.6 months; control: all male animals; mean age: 5.3 months; range: 3.3 to 5.6). (B) Normal electrocardiograph telemetry tracing of a representative mdx mouse before treatment. (C) Sustained ventricular arrhythmias on electrocardiograph telemetry tracing of an mdx mouse after isoproterenol treatment. (D) The mdx mice treated with isoproterenol have a significantly increased number of ventricular arrhythmias compared with C10 control mice, and mdx mice pre-treated with propranolol have an incidence of ventricular arrhythmias comparable to control mice treated with isoproterenol (p < 0.05). (E) All mdx mice treated with isoproterenol died due to an arrhythmic death. (F) Representative histology sections from (a) mdx mouse exposed to isoproterenol showing high IgG (red) infiltration, suggestive of severe acute injury and fibrosis (WGA); (b) mdx mouse exposed to propranolol and isoproterenol, showing minimal acute injury; and (c) control mouse exposed to isoproterenol, showing very mild acute injury. (G) Quantification of IgG in the 2 groups. Ig = immunoglobulin; iso = isoproterenol; mdx mouse = dystrophin-knockout mouse model; prop = propranolol.
FIGURE 5
FIGURE 5. The mdx Mouse Hearts and Human DMD iPSC-Derived CMs Showed Similar Dysregulated Biological Processes
(A) The heatmap shows log transformed, normalized counts of the reads mapped to the genes, where the color blue indicates low expression, and the color yellow indicates high expression. The heatmap indicates a subset of all the transcripts dysregulated in the respective mouse models with or without treatment (mdx: all male animals; mean age: 5.3 months; range: 3.4 to 5.6 months; control: all male animals; mean age: 5.3 months; range: 3.3 to 5.6 months). Transcripts were gathered from (B) ToppGene pathway analysis of the transcripts that fit these criteria, ordered by their −log(p value). (C) Merged data from mouse and human samples. After differential expression analysis with DESeq2, differentially expressed transcripts (p < 0.05) were plotted based on fold change. Upregulated (blue) and downregulated (red) transcripts in DMD conditions were used as queries for pathway analysis in ToppGene. (D, E) The bar plots showed the ToppGene results of the biological processes that were related to commonly dysregulated genes in human and mouse, ordered by −log(p value). (F) Transcripts involved in the 5 biological processes of upregulated and downregulated genes were shown. These genes were commonly dysregulated in human (black) and mouse (gray). C10 = control mouse model; mdx mouse = dystrophin-knockout mouse model; other abbreviations as in Figures 1 and 4.
FIGURE 6
FIGURE 6. Muscular Dystrophy Association Dystrophinopathy Registry Data Demonstrated a Low Utilization of β-Adrenergic Blockers in Patients With Duchenne and Becker Muscular Dystrophy
(A) β-Blocker use was 10% in male patients with DMD and BMD (n = 945). (B) Heart failure β-blocker use was <8% in patients with DMD and BMD. (C) Age histogram based on β-blocker use. (D) The majority of patients with DMD and BMD were not seen by cardiologists. (E) β-blocker use was approximately 12% in patients with DMD only (n = 646). (F) Heart failure β-blocker use was approximately 9% in patients with DMD. BMD = Becker muscular dystrophy; CV = cardiovascular; DMD = Duchenne muscular dystrophy.
CENTRAL ILLUSTRATION
CENTRAL ILLUSTRATION. Duchenne Muscular Dystrophy Cardiomyopathy Disease Modeling From Bedside to Bench and Back Again
Schematic of DMD disease modeling from the patient with DMD cardiomyopathy to DMD hiPSC-derived CMs to the mdx mouse model and the role of β-blockers in rescuing the phenotype. DMD = Duchenne muscular dystrophy; hiPSC = human induced pluripotent stem cell; mdx = dystrophin-knockout mouse model.

Comment in

References

    1. Mendell JR, Lloyd-Puryear M. Report of MDA muscle disease symposium on newborn screening for Duchenne muscular dystrophy. Muscle Nerve 2013;48:21–6. - PubMed
    1. Emery AE. The muscular dystrophies. Lancet 2002;359:687–95. - PubMed
    1. Cox GF, Kunkel LM. Dystrophies and heart disease. Curr Opin Cardiol 1997;12:329–43. - PubMed
    1. Kamdar F, Garry DJ. Dystrophin-deficient cardiomyopathy. J Am Coll Cardiol 2016;67:2533–46. - PubMed
    1. Rybakova IN, Patel JR, Ervasti JM. The dystrophin complex forms a mechanically strong link between the sarcolemma and costameric actin. J Cell Biol 2000;150:1209–14. - PMC - PubMed

Publication types

MeSH terms

Substances