. 2020 Aug;73(2):263-276.
doi: 10.1016/j.jhep.2020.03.006. Epub 2020 Mar 10.

Causal relationships between NAFLD, T2D and obesity have implications for disease subphenotyping

Affiliations

Causal relationships between NAFLD, T2D and obesity have implications for disease subphenotyping

Zhipeng Liu et al. J Hepatol. 2020 Aug.

Abstract

Background & aims: Non-alcoholic fatty liver disease (NAFLD), type 2 diabetes (T2D) and obesity are epidemiologically correlated with each other but the causal inter-relationships between them remain incompletely understood. We aimed to explore the causal relationships between the 3 diseases.

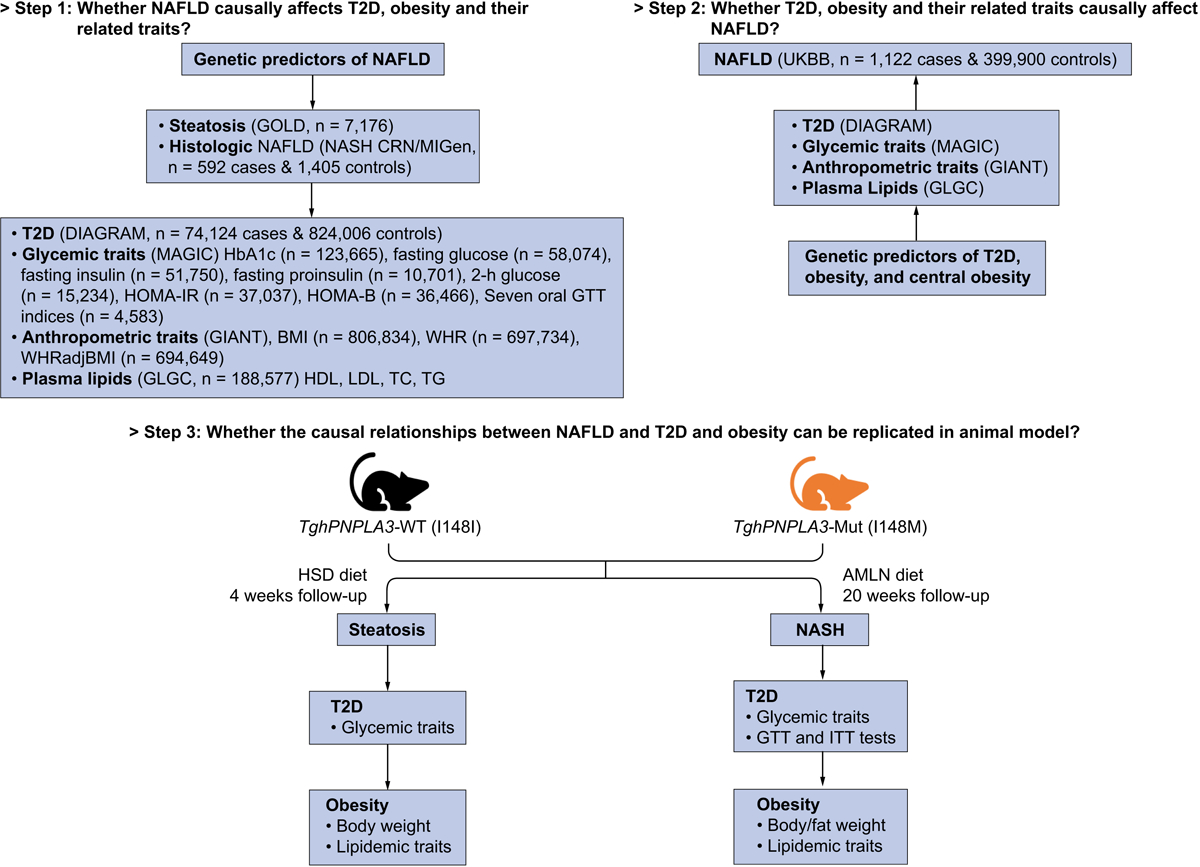
Methods: Using both UK Biobank and publicly available genome-wide association study data, we performed a 2-sample bidirectional Mendelian randomization analysis to test the causal inter-relationships between NAFLD, T2D, and obesity. Transgenic mice expressing the human PNPLA3-I148M isoforms (TghPNPLA3-I148M) were used as an example to validate causal effects and explore underlying mechanisms.

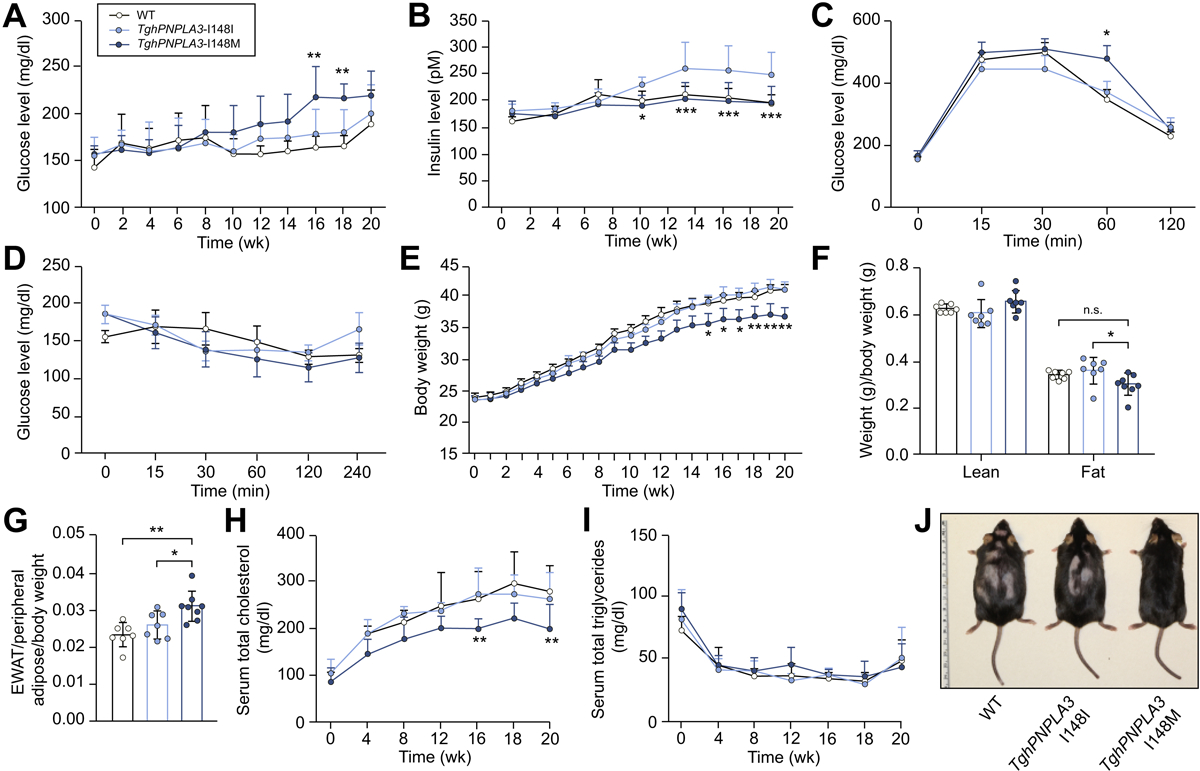
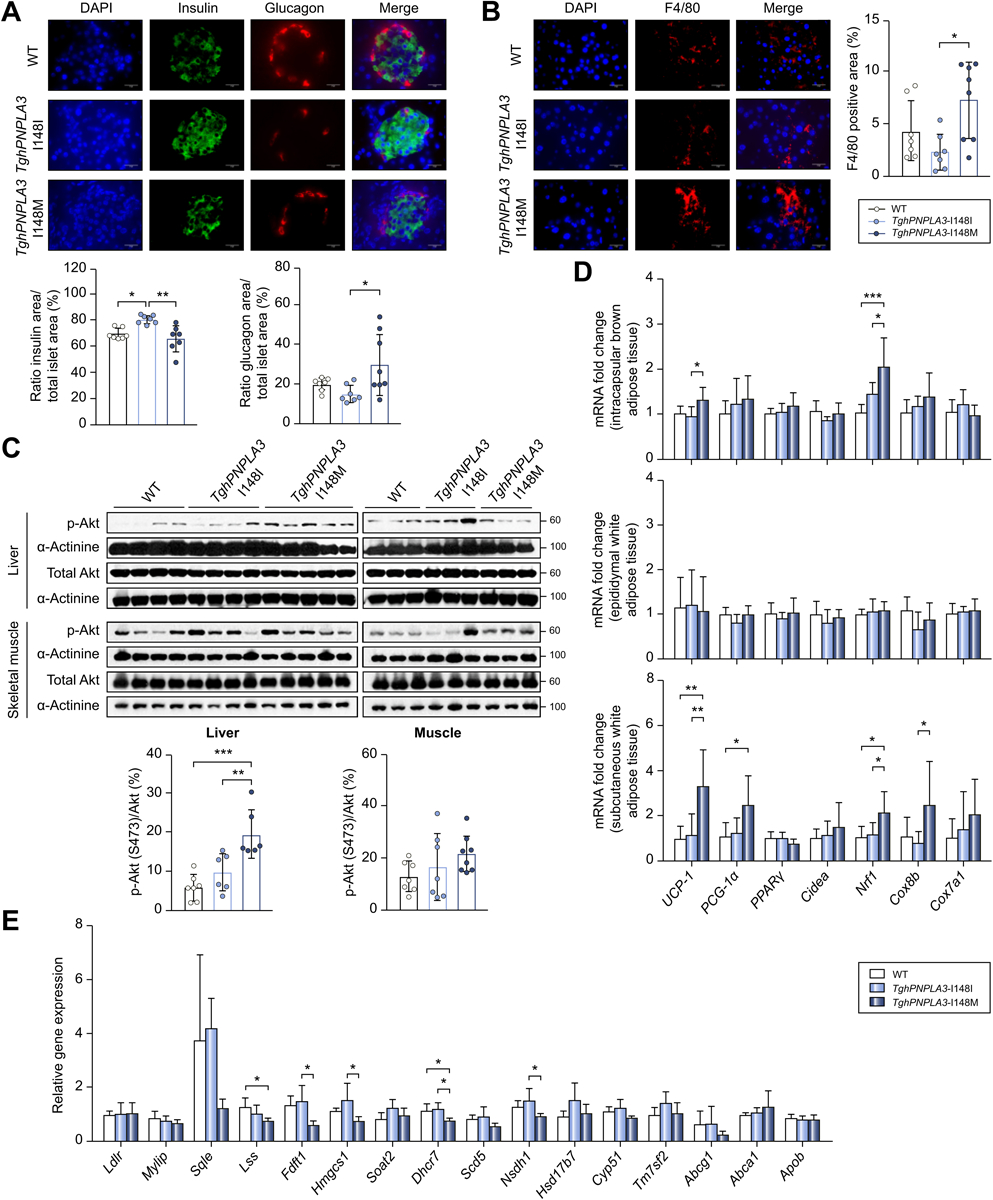
Results: Genetically driven NAFLD significantly increased the risk of T2D and central obesity but not insulin resistance or generalized obesity, while genetically driven T2D, body mass index and WHRadjBMI causally increased NAFLD risk. The animal study focusing on PNPLA3 corroborated these causal effects: compared to the TghPNPLA3-I148I controls, the TghPNPLA3-I148M mice developed glucose intolerance and increased visceral fat, but maintained normal insulin sensitivity, reduced body weight, and decreased circulating total cholesterol. Mechanistically, the TghPNPLA3-I148M mice demonstrated decreased pancreatic insulin but increased glucagon secretion, which was associated with increased pancreatic inflammation. In addition, transcription of hepatic cholesterol biosynthesis pathway genes was significantly suppressed, while transcription of thermogenic pathway genes was activated in subcutaneous and brown adipose tissues but not in visceral fat in TghPNPLA3-I148M mice.

Conclusions: Our study suggests that lifelong, genetically driven NAFLD causally promotes T2D with a late-onset type 1-like diabetic subphenotype and central obesity; while genetically driven T2D, obesity, and central obesity all causally increase the risk of NAFLD. This causal relationship revealed new insights into how nature and nurture drive these diseases, providing novel hypotheses for disease subphenotyping.

Lay summary: Non-alcoholic fatty liver disease, type 2 diabetes and obesity are epidemiologically correlated with each other, but their causal relationships were incompletely understood. Herein, we identified causal relationships between these conditions, which suggest that each of these closely related diseases should be further stratified into subtypes. This is important for accurate diagnosis, prevention and treatment of these diseases.

Keywords: Mendelian randomization; Non-alcoholic fatty liver disease; Obesity; PNPLA3; Type 2 diabetes.


Conflict of interest statement

Conflict of interest All authors have reviewed the manuscript. C.W's spouse works at Regeneron Pharmaceuticals, and all other co-authors declared no conflict of interest. The sponsor of the study has no role in the study design, collection, analysis, and interpretation of data. Please refer to the accompanying ICMJE disclosure forms for further details.

Figures

Fig. 1.
Fig. 1.. Flowchart of the study design.
The summary-level associations were taken from the following genomics consortium: GOLD (Genetics of Obesity-related Liver Disease) for computerized tomography (CT) measured hepatic steatosis[15]; NASH Clinical Research Network (NASH CRN) and Myocardial Infarction Genetics Consortium (MIGen) for biopsy-proven NAFLD[15]; DIAbetes Genetics Replication And Meta-analysis (DIAGRAM) for T2D[16]; Meta-Analyses of Glucose and Insulin-related traits (MAGIC) consortium for glycemic traits including HbA1c[17], fasting glucose[18], fasting insulin[18], fasting proinsulin[19], 2-h glucose[20], homeostatic model assessment of insulin resistance (HOMA-IR)[21] and β-cell function (HOMA-B)[21], and seven insulin secretion and action indices during oral glucose tolerance test (OGTT)[22]; The Genetic Investigation of ANthropometric Traits (GIANT) consortium for body mass index (BMI), waist-hip ratio (WHR), and WHR adjusted for BMI (WHRadjBMI)[23]; The Global Lipids Genetics Consortium (GLGC) for plasma high-density lipoprotein cholesterol (HDL), low-density lipoprotein cholesterol (LDL), total cholesterol (TC), and triglycerides (TG) levels[24].
Fig. 2.
Fig. 2.. Phenotypic changes of the mice fed with an AMLN diet.
(A) Change in glucose levels over time of TghPNPLA3-I148I, TghPNPLA3-I148M, and non-transgenic wide type mice fed with an AMLN diet for 20 weeks. Error bar represents standard deviation (SD). The significance level of the comparison between TghPNPLA3-I148I and TghPNPLA3-I148M was indicated as follows: **: p<0.01, ANOVA with Tukey’s multiple comparison test; (B) Change in insulin levels for 20 weeks. Error bar represents SD. The significance level of the comparison between TghPNPLA3-I148I and TghPNPLA3-I148M was indicated as follows: *: p<0.05, ***: p<0.001, ANOVA with Tukey’s multiple comparison test; (C) glucose tolerance test (GTT), Error bar represents SD. The significance level of the comparison between TghPNPLA3-I148I and TghPNPLA3-I148M was indicated as follows: *: p<0.05, ANOVA with Tukey’s multiple comparison test; and (D) insulin tolerance test (ITT) were performed at the 16th week of HFFC diet feeding. Error bar represents SD, ANOVA with Tukey’s multiple comparison test, all p>0.05; (E) Change in body weight of TghPNPLA3-I148I, TghPNPLA3-I148M, and non-transgenic wide type mice fed with the AMLN diet for 20 weeks. Error bar represents SD. The significance level of the comparison between TghPNPLA3-I148I and TghPNPLA3-I148M was indicated as follows: *: p<0.05, **: p<0.01, ANOVA with Tukey’s multiple comparison test; (F) Body composition analysis by magnetic resonance imaging (MRI). Fat tissue weight and non-fat lean mass were normalized by the body weight. Error bar represents SD. The significance level was indicated as follows: *: p<0.05, ns: not significant, ANOVA with Tukey’s multiple comparison test; (G) Epididymal white adipose tissue (EWAT) accumulation at the 20th week of AMLN diet feeding. EWAT accumulation was calculated as weight of EWAT normalized by the total peripheral adipose tissue weight and then further normalized by the body weight. Error bar represents SD. The significance level was indicated as follows: *: p<0.05, **: p<0.01, ANOVA with Tukey’s multiple comparison test; (H) Change in serum total cholesterol levels over 20 weeks. Error bar represents SD. The significance level of the comparison between TghPNPLA3-I148I and TghPNPLA3-I148M was indicated as follows: **: p<0.01, ANOVA with Tukey’s multiple comparison test; (I) Change in serum total triglycerides levels over 20 weeks. Error bar represents SD. ANOVA with Tukey’s multiple comparison test, all p>0.05; (J) The representative image of TghPNPLA3-I148I, TghPNPLA3-I148M, and non-transgenic wide type mouse after 20 weeks of AMLN diet feeding. Sample size: TghPNPLA3-I148I (n=7), TghPNPLA3-I148M (n=8), and non-transgenic wide type (n=7).
Fig. 3.
Fig. 3.. Underlying mechanism of PNPLA3 I148M in regulating pancreas function and inflammation, as well as adipose thermogenic and hepatic cholesterol metabolism pathways.
(A) Immunofluorescence double staining to identify insulin and glucagon secretion with antibodies against insulin (green) and glucagon (red) in non-transgenic wide type, TghPNPLA3-I148I or TghPNPLA3-I148M mouse pancreas. Nuclei were labeled with DAPI (blue). Scale bars: 20 m, 630X magnification. The quantifications of area of stained insulin and glucagon signals were shown below. Error bar represents standard deviation (SD). The significance level was indicated as follows: *: p<0.05, **: p<0.01, ANOVA with Tukey’s multiple comparison test; (B) Immunofluorescence staining for macrophage marker F4/80 (red) in non-transgenic wide type, TghPNPLA3-I148I and TghPNPLA3-I148M mouse pancreas. Nuclei were labeled with DAPI (blue). Scale bars: 20 μm, 630X magnification. The quantification of F4/80-positive area was shown in the right. The positive area was measured in randomly selected fields (three fields per section). Error bar represents SD. The significance level was indicated as follows: *: p<0.05, ANOVA with Tukey’s multiple comparison test; (C) Western blot analysis of the level of total and phospho-Akt (Ser473) proteins in liver and skeletal muscle tissue. α-Actinin was used as the loading control. The densitometry ratio of the expression of p-Akt and total Akt was demonstrated below. Error bar represents SD. The significance level was indicated as follows: **: p<0.01, ***: p<0.001, ANOVA with Tukey’s multiple comparison test; (D) Fold change in expression of thermogenic genes in interscapular brown adipose tissue, epididymal white adipose tissue and subcutaneous white adipose tissue. Error bar represents SD. The significance level was indicated as follows: *: p<0.05, **: p<0.01, ***: p<0.001, ANOVA with Tukey’s multiple comparison test; (E) Fold change in the cholesterol metabolism-related gene expression in liver. Error bar represents SD. The significance level was indicated as follows: *: p<0.05, ANOVA with Tukey’s multiple comparison test. Sample size: TghPNPLA3-I148I (n=7), TghPNPLA3-I148M (n=8), and non-transgenic wide type (n=7).
Fig. 4.
Fig. 4.. Schematic summary of the causal relationship between PNPLA3–148M driven NAFLD and obesity, diabetes and cholesterol metabolism.
Chol=cholesterol.

References

    1. Chalasani N, Younossi Z, Lavine JE, Charlton M, Cusi K, Rinella M, et al. The diagnosis and management of nonalcoholic fatty liver disease: Practice guidance from the American Association for the Study of Liver Diseases. Hepatology 2018;67:328–357. - PubMed
    1. Hardy T, Oakley F, Anstee QM, Day CP. Nonalcoholic Fatty Liver Disease: Pathogenesis and Disease Spectrum. Annu Rev Pathol 2016;11:451–496. - PubMed
    1. Mantovani A, Byrne CD, Bonora E, Targher G. Nonalcoholic Fatty Liver Disease and Risk of Incident Type 2 Diabetes: A Meta-analysis. Diabetes Care 2018;41:372–382. - PubMed
    1. Hu M, Phan F, Bourron O, Ferre P, Foufelle F. Steatosis and NASH in type 2 diabetes. Biochimie 2017;143:37–41. - PubMed
    1. Lonardo A, Lugari S, Ballestri S, Nascimbeni F, Baldelli E, Maurantonio M. A round trip from nonalcoholic fatty liver disease to diabetes: molecular targets to the rescue? Acta Diabetol 2019;56:385–396. - PubMed

Publication types