. 2020 May 4;10(5):1553-1561.
doi: 10.1534/g3.119.400972.

Network Analysis of Linkage Disequilibrium Reveals Genome Architecture in Chum Salmon

Affiliations

Network Analysis of Linkage Disequilibrium Reveals Genome Architecture in Chum Salmon

Garrett McKinney et al. G3 (Bethesda). .

Abstract

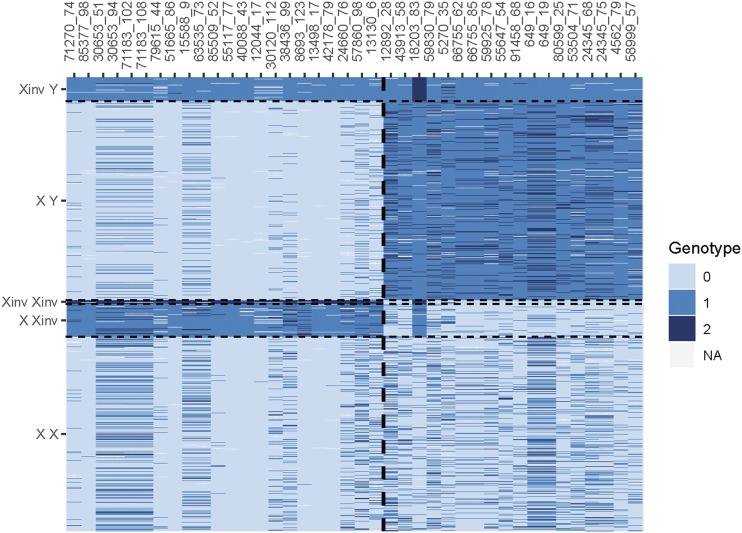
Many studies exclude loci that exhibit linkage disequilibrium (LD); however, high LD can signal reduced recombination around genomic features such as chromosome inversions or sex-determining regions. Chromosome inversions and sex-determining regions are often involved in adaptation, allowing for the inheritance of co-adapted gene complexes and for the resolution of sexually antagonistic selection through sex-specific partitioning of genetic variants. Genomic features such as these can escape detection when loci with LD are removed; in addition, failing to account for these features can introduce bias to analyses. We examined patterns of LD using network analysis to identify an overlapping chromosome inversion and sex-determining region in chum salmon. The signal of the inversion was strong enough to show up as false population substructure when the entire dataset was analyzed, while the effect of the sex-determining region on population structure was only obvious after restricting analysis to the sex chromosome. Understanding the extent and geographic distribution of inversions is now a critically important part of genetic analyses of natural populations. Our results highlight the importance of analyzing and understanding patterns of LD in genomic dataset and the perils of excluding or ignoring loci exhibiting LD. Blindly excluding loci in LD would have prevented detection of the sex-determining region and chromosome inversion while failing to understand the genomic features leading to high-LD could have resulted in false interpretations of population structure.

Keywords: chum salmon; inversion; linkage disequilibrium; network analysis; x-chromosome.


Figures

Figure 1
Figure 1
Map of sampling locations. Collections are colored by region, and shapes denote whether samples were genotyped using RADseq and GT-seq or GT-seq only.
Figure 2
Figure 2
Individual PCA using all loci for Yukon River collections. Both collections exhibit patterns of substructure.
Figure 3
Figure 3
A) Plot of linkage disequilibrium (pairwise r2) of SNPs aligned to O. mykiss chromosome 28 (chum LG 15). Each point is a SNP pair colored by LD. The pattern of elevated LD spans 20 Mb of chromosome 28. B) Network analysis with community detection identified three distinct sets of loci contributing to LD on LG15. Set 1 (red background) has 51 loci, set 2 (purple background) has 27 loci, and set 3 (green background) has 4 loci. Loci in sets 1 and 2 span the entire 20 Mb while loci in set 3 are linked due to close physical proximity.
Figure 4
Figure 4
A) Individual PCA of RADseq samples using all loci from LG15. Examination of locus loadings show that Axis 1 is primarily driven by loci in set 1 (inversion loci) and axis 2 is primarily driven by loci in set 2 (sex-associated loci). Labels for each cluster of individuals denote the putative chromosome type of individuals within the cluster with respect to inversion and sex. B) Individual PCA of RADseq and GT-seq samples using loci successfully developed into GT-seq assays. Samples are color coded by phenotypic sex with gray individuals having unassigned sex.
Figure 5
Figure 5
Genotypes for combined RADseq and GT-seq samples. Rows are samples ordered by sex (inferred from PCA cluster) and inversion type; columns are loci. Loci were separated by genomic feature to aid in visualization: inversion-associated loci are to the left of the dashed line and sex-associated loci are to the right of the dashed line. Within each genomic feature, loci are ordered by position. Individual genotypes are color coded with 0 and 2 representing alternate homozygous genotypes and 1 being a heterozygous genotype. Prefix of Oke_uwRAD was dropped from marker names for brevity.

References

    1. Ali O. A., O’Rourke S. M., Amish S. J., Meek M. H., Luikart G. et al. , 2016. RAD capture (Rapture): flexible and efficient sequence-based genotyping. Genetics 202: 389–400. 10.1534/genetics.115.183665 - DOI - PMC - PubMed
    1. Arostegui M. C., Quinn T. P., Seeb L. W., Seeb J. E., and McKinney G. J., 2019. Retention of a chromosomal inversion from an anadromous ancestor provides the genetic basis for alternative freshwater ecotypes in rainbow trout. Mol. Ecol. 28: 1412–1427. 10.1111/mec.15037 - DOI - PubMed
    1. Ayala D., Acevedo P., Pombi M., Dia I., Boccolini D. et al. , 2017. Chromosome inversions and ecological plasticity in the main African malaria mosquitoes. Evolution 71: 686–701. 10.1111/evo.13176 - DOI - PMC - PubMed
    1. Badyaev A. V., and Hill G. E., 2000. The evolution of sexual dimorphism in the house finch. I. Population divergence in morphological covariance structure. Evolution 54: 1784–1794. 10.1111/j.0014-3820.2000.tb00722.x - DOI - PubMed
    1. Barson N. J., Aykanat T., Hindar K., Baranski M., Bolstad G. H. et al. , 2015. Sex-dependent dominance at a single locus maintains variation in age at maturity in salmon. Nature 528: 405–408. 10.1038/nature16062 - DOI - PubMed

Publication types

LinkOut - more resources