. 2020 Apr 2;7(2):ENEURO.0320-19.2020.
doi: 10.1523/ENEURO.0320-19.2020. Print 2020 Mar/Apr.

Targeted Krüppel-Like Factor 4 Gene Knock-Out in Retinal Ganglion Cells Improves Visual Function in Multiple Sclerosis Mouse Model

Affiliations

Targeted Krüppel-Like Factor 4 Gene Knock-Out in Retinal Ganglion Cells Improves Visual Function in Multiple Sclerosis Mouse Model

Venu Talla et al. eNeuro. .

Abstract

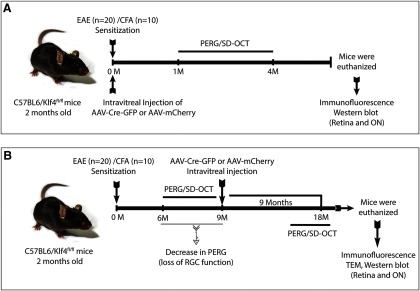
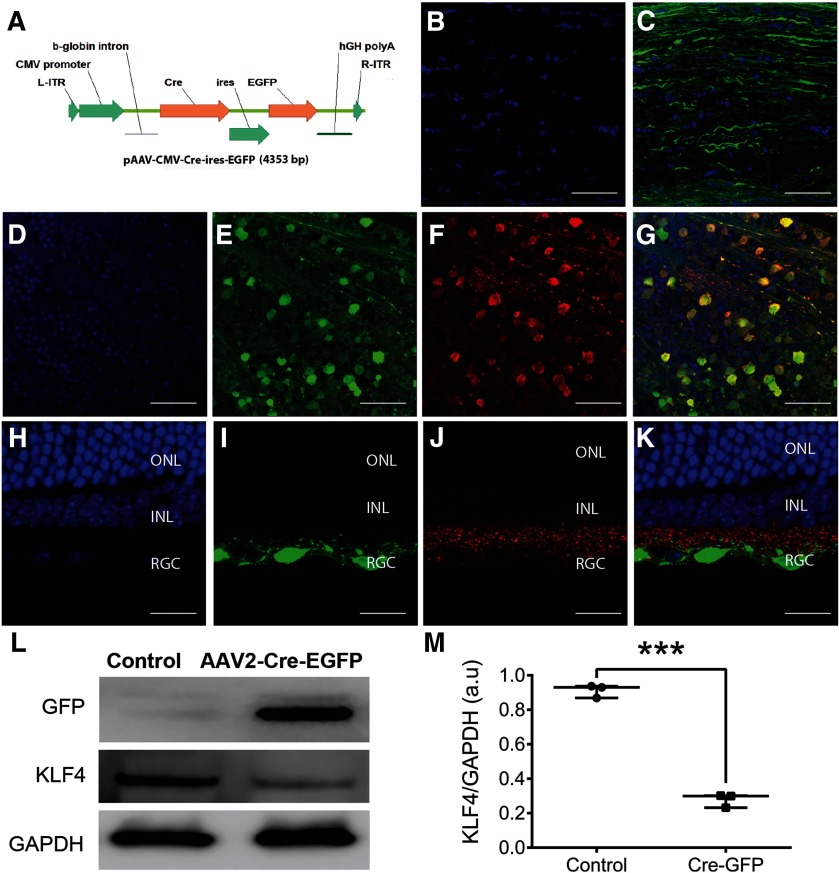
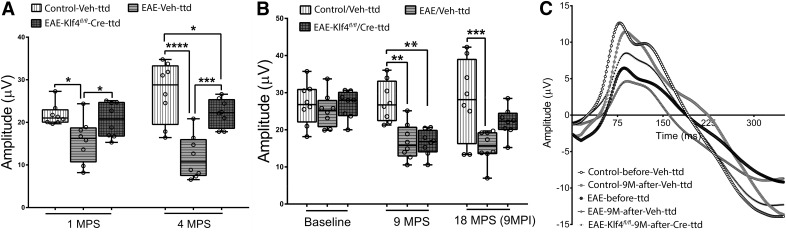
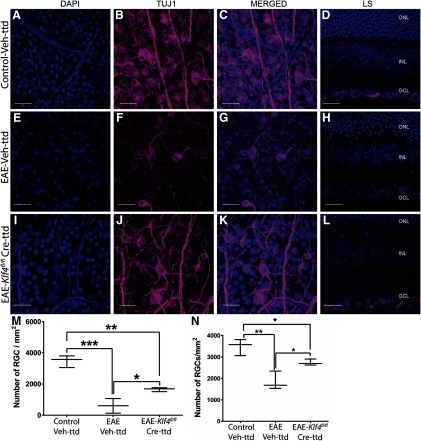
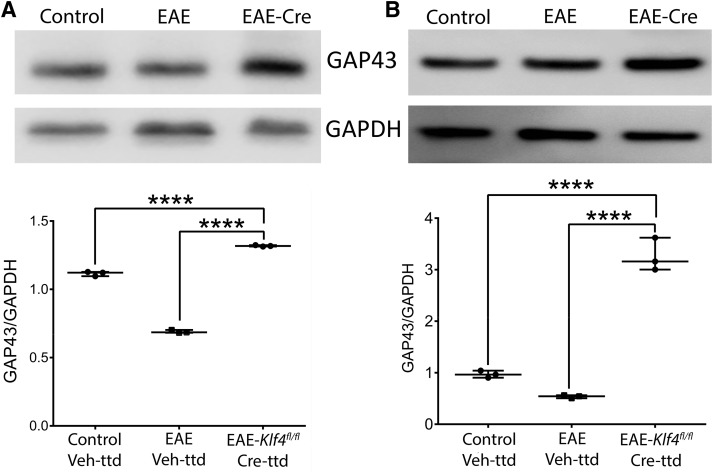
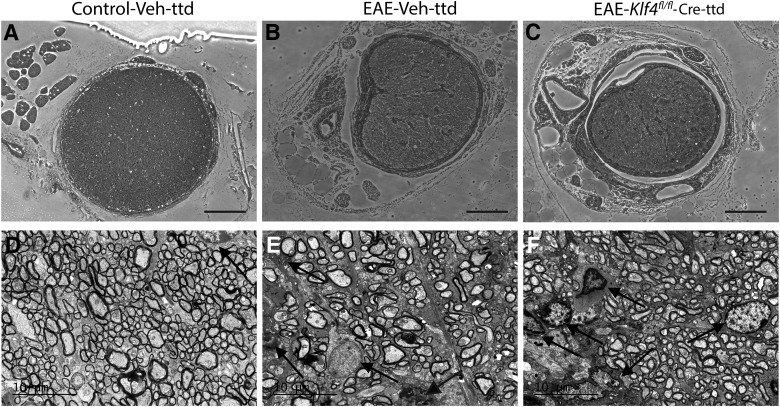
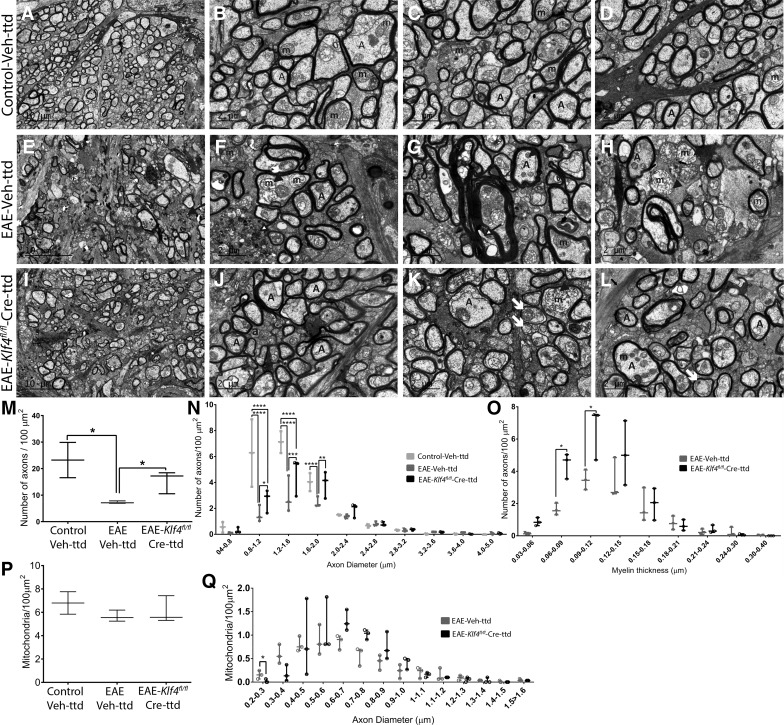
Axonal demyelination injury and neuronal degeneration are the primary causes of visual disability in multiple sclerosis (MS)-linked optic neuritis patients. Immunomodulatory therapies targeting inflammation have failed to avert the disease progression and no therapies exist to prevent the neuronal deficits seen in MS to date. Neuroprotective strategies targeting oligodendrocytes and astroglia have shown limited success due to a lack of axonal regeneration from injured neurons. In this study, we used the chronic experimental autoimmune encephalomyelitis (EAE) mouse model of MS to investigate the axonal regenerative approach to improve the neuronal function. Our approach focused on targeted knock-out (KO) of the developmentally regulated axon growth inhibitory Krüppel-like factor 4 (Klf4) gene in retinal ganglion cells (RGCs) of Klf4fl/fl mice by intravitreal delivery of AAV2-Cre-ires-EGFP recombinant virus (1) at the time of EAE sensitization and (2) after the onset of optic neuritis-mediated visual defects in the mice. Klf4 gene KO performed simultaneous with EAE sensitization prevented the visual loss as assessed by pattern electroretinograms (PERGs) in the mice and protected the RGCs from EAE-mediated death. More importantly, however, Klf4 gene KO after the onset of optic neuritis also resulted in RGC neuroprotection with additional restoration of their function, thereby improving the visual function outcomes in the EAE model. This study establishes the efficacy of Klf4 targeted knock-down in EAE even after the onset of disease symptoms, and thus should be further explored as a potential treatment strategy for MS/optic neuritis patients.

Keywords: EAE; MS; axon regeneration; demyelination; neuroprotection; optic neuritis.


Figures

Figure 1.
Figure 1.
Schematic showing experimental design. A, Experimental design for simultaneous EAE sensitization and rescue injections (Group I). B, Experimental design for Group II mice experiments where rescue injections were performed after the significant decrease in PERGs. PERG, Pattern electroretinograms; SD-OCT, Spectral domain optical coherence tomography.
Figure 2.
Figure 2.
Conditional KO of Klf4 gene in the retina using rAAV2-Cre-GFP. A, Schematic of the AAV2-Cre-EGFP vector. L-ITR: Left inverted terminal repeat; R-ITR: right inverted terminal repeat; Cre: Cre recombinase; ires: internal ribosome entry site; EGFP: enhanced green fluorescent protein; hGH poly A: bGH Poly adenylation signal. B, C, Immunostaining of ON longitudinal sections of one month after AAV-Cre-ires-EGFP injection mice showed DAPI-labeled ON resident cells (B) and GFP-labeled axon bundles (C). D–G, Immunostaining of retinal whole mounts at one month after AAV-Cre-ires-EGFP injection showed DAPI-labeled cell nuclei (D), GFP-positive cells (E), Thy1.2-positive RGCs (F), and co-localization of GFP in RGCs shown in merged image (G). H–K, Corresponding longitudinal sections showing DAPI-positive nuclei in all three retinal layers (H), GFP-expressing cells in RGC layers (I), stained positive for Thy1.2 RGC marker (J), and all three channels merged (K); n = 3 eyes. L, Immunoblotting of retina samples obtained one month after intravitreal injection of scAAV-CMV-Cre-ires-EGFP into Klf4fl/fl mice shows selective expression of GFP and decreased expression of KLF4 compared with control retina. The housekeeping GAPDH expression is shown in injected versus control retina. M, Box-whisker plot shows ImageJ quantitation of KLF4 knock-down in AAV-cre-GFP versus control. Box-plot elements include, center line, median; box limits, upper 75th and lower 25th percentile of the data; whiskers, lowest and highest data points. Samples derived from the same experiment and that gels/blots were processed in parallel for quantitative analysis. ONL, outer nuclear layer; INL, inner nuclear layer; RGC, RGC layer (***p = 0.0001–0.0009; unpaired Student’s t test; n = 6 eyes/group). Figure Contributions: Venu Talla acquired the data and generated the figure.
Figure 3.
Figure 3.
PERG analysis, rescue of visual function. A, Box and whisker plot showing PERG amplitudes of control-Veh-ttd, EAE-Veh-ttd, and EAE-Klf4fl/fl-Cre-ttd mice at 1 and 4 MPS where EAE sensitization and intravitreal injections were done simultaneously (n = 8 eyes/group). B, Box and whisker plot showing PERG amplitudes of Control, EAE and EAE-Klf4fl/fl mice at 9 MPS versus 18 MPS + 9 MPI of Veh-ttd or Cre-ttd mice. Box-plot elements include, center line, median; box limits, upper 75th and lower 25th percentile of the data; whiskers, lowest and highest data points. C, Representative PERG wave forms of CFA, EAE and EAE Klf4fl/fl mice at 9 MPS versus 18 MPS + 9 MPI of scAAV-CMV-mCherry or ssAAV-CMV-Cre-ires-GFP. PERGs were recorded three times for each mice/time point and mean PERGs with subtracted background was used for final analysis. Statistical analysis was performed by two-way ANOVA followed by Tukey’s multiple comparison test and p values were adjusted for multiple sample comparisons, p < 0.05 was considered to be statistically significant; *p = 0.01–0.05; **p = 0.001–0.009; ***p = 0.0001–0.0009, ****p < 0.0001; (n = 8 eyes for each group).Figure Contributions: Venu Talla acquired the data, analyzed, and generated the figure.
Figure 4.
Figure 4.
Retinal whole mounts and longitudinal sections: confocal microscopy of retinal whole mounts and corresponding longitudinal sections of (A–D) control-Veh-ttd, (E–H) EAE-Veh-ttd, and (I–L) EAE-Klf4fl/fl-Cre-ttd mice showing. (A, E, I) DAPI-positive cell nuclei, with (B, F, J) Tuj1-positive RGCs, along with (C, G, K) DAPI and Tuj1 merged images and (D, H, L) representative retinal longitudinal sections with DAPI- and Tuj1-positive RGCs. Box and whisker plot (M) compare the RGC counts in control-Veh-ttd, EAE-Veh-ttd, and EAE-Klf4fl/fl-Cre-ttd mice groups, in which ntravitreal injections were done after the PERGs were significantly decreased due to EAE. N, Compares the RGC counts in control-Veh-ttd, EAE-Veh-ttd, and EAE-Klf4fl/fl-Cre-ttd mice groups, in which intravitreal injections and EAE sensitizations were done simultaneously. Box-plot elements include, center line, median; box limits, upper 75th and lower 25th percentile of the data; whiskers, lowest and highest data points. ONL, outer nuclear layer; INL, inner nuclear layer; RGC, RGC layer. Statistical analysis was performed by one-way ANOVA followed by Tukey’s multiple comparison test, p < 0.05 is considered to be statistically significant; *p = 0.01–0.05; **p = 0.001–0.009, ***p = 0.0001–0.0009; n = 3 eyes/group. Scale bars: 100 μm.Figure Contributions: Venu Talla acquired the images. Rajeshwari Koilkonda did the RGC counting. Venu Talla generated the figure.
Figure 5.
Figure 5.
Axonal regeneration: immunoblotting of (A) ON and (B) retina samples obtained from 18 MPS/9 MPI of control-Veh-ttd, EAE-Veh-ttd, and EAE-Klf4fl/fl-Cre-ttd mice shows expression of GAP43 (top panels) and GAPDH (bottom panels) in all samples. GAP43 band intensities were higher in EAE-Klf4fl/fl-Cre-ttd mice compared with control or EAE Veh-ttd mice. Corresponding box-whisker plots at the bottom of the blots shows the ImageJ-based quantitative analysis of GAP43/GAPDH expression in ON and retina among three groups. Samples derived from the same experiment and that gels/blots were processed in parallel for quantitative analysis. Statistical analysis was performed by one-way ANOVA followed by Tukey’s multiple comparison test, a p < 0.05 is considered to be statistically significant; ****p < 0.0001–0.0009 (n = 6 eyes/group, experimental repeats = 3).Figure Contributions: Venu Talla acquired the data, analyzed, and generated the figure.
Figure 6.
Figure 6.
Histopathology and inflammation in EAE mice: A–C, Light microscopic images of the toluidine blue-stained ON sections obtained 18 MPS/9 MPI show normal healthy axons in control-Veh-ttd mice (A), whereas inflammatory infiltration and fibrosis seen in EAE-Veh-ttd (B), and EAE-Klf4fl/fl-Cre-ttd mice. D–F, Representative transmission electron micrographs show minimal to no cellular infiltration in control-Veh-ttd mice (D), whereas infiltration of astroglial cells was more evident in EAE-Veh-ttd (E) and EAE-Klf4fl/fl-Cre-ttd (F) mice ONs. Scale bars: 100 μm (light micrographs) and 10 μm (TEM images).Figure Contributions: Venu Talla and Rajeshwari Koilkonda acquired the images. Venu Talla generated the figure.
Figure 7.
Figure 7.
Axon counts, myelin, and mitochondria. Electron microscopy images of ON cross sections of (A–D) control-Veh-ttd mice shows healthy myelinated axons with normal mitochondria. E–H, EAE-Veh-ttd mice showed axonal loss and Wallerian-like degeneration (as shown by arrows in E, F), myelin degradation (as shown in G), and axons with either smaller or swollen mitochondria (shown with arrow heads in G, H). I–L, EAE-Klf4fl/fl-Cre-ttd mice ON with low caliber axons, axons with thinner myelin (showed with arrows in K), and normal as well as swollen mitochondria (arrowheads in K) were evident in EAE-Klf4fl/fl-Cre-ttd mice. M, Box and whisker plots compare axon counts among the three groups. N, Box and whisker plots compare the distribution of small to high diameter axons per 100-μm2 area in control-Veh-ttd, EAE-Veh-ttd, and EAE-Klf4fl/fl-Cre-ttd mice. O, Box and whisker plots compare the distribution of axons with low to high myelin thickness per 100-μm2 area in EAE-Veh-ttd versus EAE-Klf4fl/fl-Cre-ttd mice. P, Box and whisker plot compares the number of mitochondria per 100-μm2 area in control-Veh-ttd, EAE-Veh-ttd, and EAE-Klf4fl/fl-Cre-ttd mice ONs. Q, Box and whisker plot compares the mitochondrial number per 100-μm2 area with smaller to higher size in EAE-Veh-ttd versus EAE-Klf4fl/fl-Cre-ttd mice ONs. TEM imaging and axon counting was done by individual masked for the treatment groups. Statistical analyses were performed by one-way ANOVA followed by Tukey’s multiple comparison test for axon counts and mitochondrial counts. Two-way ANOVA followed by Tukey’s multiple comparison test was done for axon diameters. Two-way ANOVA followed by t test and statistical significance determined using the Holm–Sidak method, with α = 5% and computations assume that all rows are sample from populations with the same scatter (SD) was used for myelin thickness and mitochondrial size distribution analysis; p < 0.05 is considered to be statistically significant (n = 3 eyes/group, *p = 0.01–0.05, **p = 0.001–0.009, ***p = 0.0001–0.0009, ****p < 0.0001). A, axons; m, mitochondria. Scale bars: 10 μm (low-magnification images) and 2 μm (high-magnification images).Figure Contributions: Venu Talla and Rajeshwari Koilkonda acquired the images. Rajeshwari Koilkonda did the counting and diameters and myelin thickness measurements. Venu Talla and Rajeshwari Koilkonda analyzed the data. Venu Talla generated the figure.

References

    1. Adelman G, Rane SG, Villa KF (2013) The cost burden of multiple sclerosis in the United States: a systematic review of the literature. J Med Econ 16:639–647. 10.3111/13696998.2013.778268 - DOI - PubMed
    1. Ahn M, Kim J, Park C, Jung K, Moon C, Shin T (2015) Immunohistochemical study of Krüppel-like factor 4 in the spinal cords of rats with experimental autoimmune encephalomyelitis. Acta Histochem 117:521–527. 10.1016/j.acthis.2015.03.012 - DOI - PubMed
    1. Aktas O, Albrecht P, Hartung HP (2016) Optic neuritis as a phase 2 paradigm for neuroprotection therapies of multiple sclerosis: update on current trials and perspectives. Curr Opin Neurol 29:199–204. 10.1097/WCO.0000000000000327 - DOI - PubMed
    1. An J, Golech S, Klaewsongkram J, Zhang Y, Subedi K, Huston GE, Wood WH, III, Wersto RP, Becker KG, Swain SL, Weng N (2011) Krüppel-like factor 4 (KLF4) directly regulates proliferation in thymocyte development and IL-17 expression during Th17 differentiation. FASEB J 25:3634–3645. 10.1096/fj.11-186924 - DOI - PMC - PubMed
    1. Balcer LJ, Miller DH, Reingold SC, Cohen JA (2015) Vision and vision-related outcome measures in multiple sclerosis. Brain 138:11–27. 10.1093/brain/awu335 - DOI - PMC - PubMed

Publication types