. 2020 Mar 12;11(1):1351.
doi: 10.1038/s41467-020-15014-4.

Global plant trait relationships extend to the climatic extremes of the tundra biome

H J D Thomas  1 A D Bjorkman  2   3   4 I H Myers-Smith  2 S C Elmendorf  5 J Kattge  6   7 S Diaz  8   9 M Vellend  10 D Blok  11 J H C Cornelissen  12 B C Forbes  13 G H R Henry  14 R D Hollister  15 S Normand  16 J S Prevéy  17   18 C Rixen  18 G Schaepman-Strub  19 M Wilmking  20 S Wipf  18   21 W K Cornwell  22 P S A Beck  23 D Georges  2   24 S J Goetz  25 K C Guay  26 N Rüger  7   27 N A Soudzilovskaia  28 M J Spasojevic  29 J M Alatalo  30   31 H D Alexander  32 A Anadon-Rosell  20   33   34 S Angers-Blondin  2 M Te Beest  35   36 L T Berner  25 R G Björk  37   38 A Buchwal  39   40 A Buras  41 M Carbognani  42 K S Christie  43 L S Collier  44 E J Cooper  45 B Elberling  46 A Eskelinen  7   47   48 E R Frei  14   49 O Grau  50   51   52 P Grogan  53 M Hallinger  54 M M P D Heijmans  55 L Hermanutz  44 J M G Hudson  56 J F Johnstone  57 K Hülber  58 M Iturrate-Garcia  19 C M Iversen  59 F Jaroszynska  18   60   61 E Kaarlejarvi  34   62   63 A Kulonen  18 L J Lamarque  64 T C Lantz  65 E Lévesque  64 C J Little  19   66 A Michelsen  46   67 A Milbau  68 J Nabe-Nielsen  69 S S Nielsen  16 J M Ninot  33   34 S F Oberbauer  70 J Olofsson  36 V G Onipchenko  71 A Petraglia  42 S B Rumpf  58   72 R Shetti  20 J D M Speed  73 K N Suding  5 K D Tape  74 M Tomaselli  42 A J Trant  75 U A Treier  16 M Tremblay  64 S E Venn  76 T Vowles  37 S Weijers  77 P A Wookey  78 T J Zamin  53 M Bahn  79 B Blonder  80   81   82 P M van Bodegom  28 B Bond-Lamberty  83 G Campetella  84 B E L Cerabolini  85 F S Chapin 3rd  86 J M Craine  87 M Dainese  88   89 W A Green  90 S Jansen  91 M Kleyer  92 P Manning  93 Ü Niinemets  94 Y Onoda  95 W A Ozinga  96 J Peñuelas  50   51 P Poschlod  97 P B Reich  98   99 B Sandel  100 B S Schamp  101 S N Sheremetiev  102 F T de Vries  103
Affiliations

Global plant trait relationships extend to the climatic extremes of the tundra biome

H J D Thomas et al. Nat Commun. .

Abstract

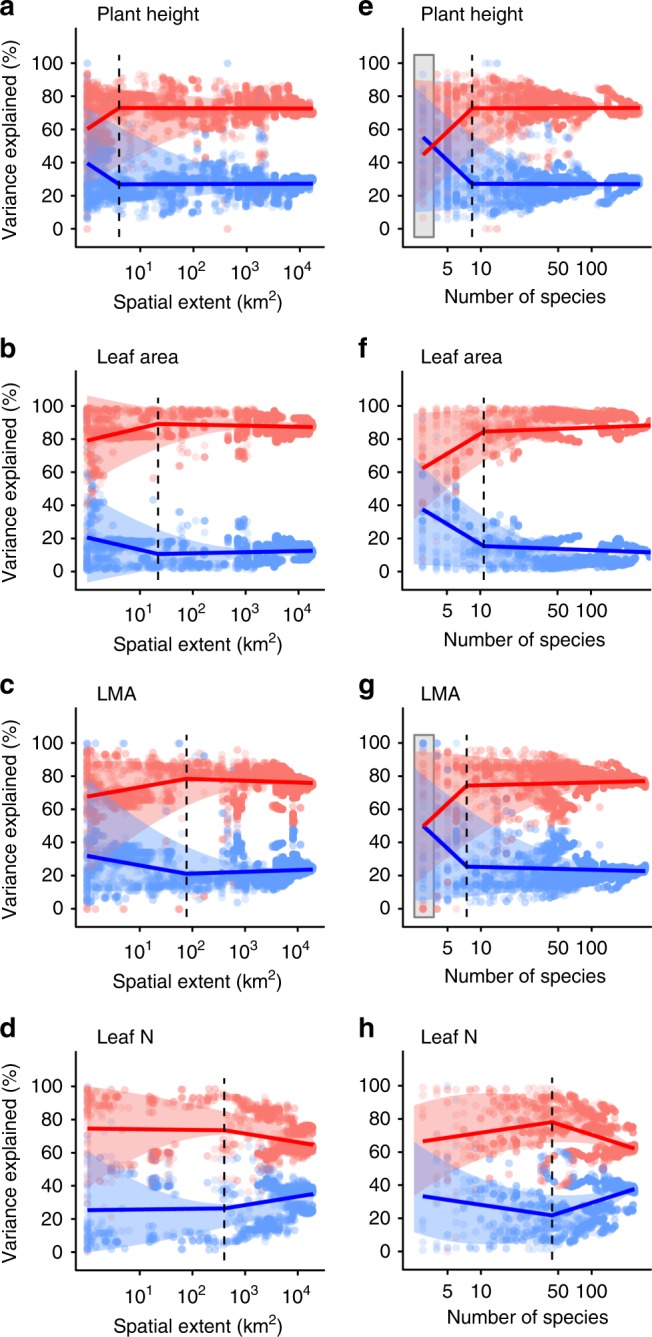
The majority of variation in six traits critical to the growth, survival and reproduction of plant species is thought to be organised along just two dimensions, corresponding to strategies of plant size and resource acquisition. However, it is unknown whether global plant trait relationships extend to climatic extremes, and if these interspecific relationships are confounded by trait variation within species. We test whether trait relationships extend to the cold extremes of life on Earth using the largest database of tundra plant traits yet compiled. We show that tundra plants demonstrate remarkably similar resource economic traits, but not size traits, compared to global distributions, and exhibit the same two dimensions of trait variation. Three quarters of trait variation occurs among species, mirroring global estimates of interspecific trait variation. Plant trait relationships are thus generalizable to the edge of global trait-space, informing prediction of plant community change in a warming world.


Conflict of interest statement

The authors declare no competing interests.

Figures

Fig. 1
Fig. 1. Tundra trait data within geographical and climate space.
a Map of trait observation sites for six plant traits, indicating global trait observations in TRY (grey points), tundra species observations in TRY (orange points) and TTT data (purple points). b Location of trait collection sites in climate space for all available plant species (grey) and tundra species (blue). Major biomes are mapped onto climate space (T-Tundra; B-Boreal Forest; TG-Temperate Grassland; TeF-Temperate Deciduous Forest; TeRF-Temperate Rain Forest; TrF-Tropical Deciduous Forest; TrRF-Tropical Rain Forest; Sa-Savanna; D–Desert). c Number of trait observations (upper panel) and species (lower panel) for all available plant species (grey) and tundra species (blue), by latitude. Dotted curves indicate global distributions with the inclusion of TTT collected data.
Fig. 2
Fig. 2. Global trait relationships are maintained in the tundra biome despite constrained size, but not resource economic, traits among tundra species.
a Global trait-space defined by six plant traits for 1,358 plant species in the global dataset (grey points) and 219 tundra species (blue points). b Distribution of trait space for tundra species only. Note that PCA axes are reversed in tundra data relative to global data. Points are coloured by temperature category, corresponding to the mean annual temperature of trait collection sites for each species (Cold < −1 °C, Mid > −1 °C but <1 °C, Warm >1 °C, Supplementary Fig. 1). Arrows indicate the direction and weighting of trait vectors. We also tested the consistency of the patterns found (c) within global trait space and for (d) tundra trait space using subset of “extreme” tundra species that included only those species found only north of the Arctic circle or at sites with a MAT < 0 °C.
Fig. 3
Fig. 3. Sources of trait variation for six plant traits in the tundra biome.
a Relative proportion of trait variation explained by functional group (deciduous shrubs, evergreen shrubs, graminoids, forbs; yellow), species (red) and within species (blue). b Total trait variation, represented by the coefficient of variation (ratio of the standard deviation to the mean), and component sources of trait variation.
Fig. 4
Fig. 4. Sources of trait variation across geographic scales.
Among-species trait variation (red) accounts for the majority of total trait variation across the tundra, but the importance of within-species trait variation (blue) increases at local scales and at low species richness in most traits. Sources of trait variation across geographical scale (ad) and species richness (eh) for plant height, leaf area, LMA and leaf nitrogen (see also Supplementary Figs. 5–7). Coloured lines indicate linear break point model fits with one break point (dashed line). Grey boxes indicate where differences between among-species and within-species variation are not significant (P > 0.05).

References

    1. Wright IJ, et al. The worldwide leaf economics spectrum. Nature. 2004;428:821–827. doi: 10.1038/nature02403. - DOI - PubMed
    1. Chave J, et al. Towards a worldwide wood economics spectrum. Ecol. Lett. 2009;12:351–366. doi: 10.1111/j.1461-0248.2009.01285.x. - DOI - PubMed
    1. Westoby M, Jurado E, Leishman MR. Comparative evolutionary ecology of seed size. Trends Ecol. Evol. 1992;7:368–372. doi: 10.1016/0169-5347(92)90006-W. - DOI - PubMed
    1. Iversen CM, et al. The unseen iceberg: plant roots in arctic tundra. N. Phytologist. 2015;205:34–58. doi: 10.1111/nph.13003. - DOI - PubMed
    1. Westoby M. A leaf-height-seed (LHS) plant ecology strategy scheme. Plant Soil. 1998;199:213–227. doi: 10.1023/A:1004327224729. - DOI

Publication types