. 2020 Mar 12;11(1):1339.
doi: 10.1038/s41467-020-15203-1.

Lipidomic and biophysical homeostasis of mammalian membranes counteracts dietary lipid perturbations to maintain cellular fitness

Affiliations

Lipidomic and biophysical homeostasis of mammalian membranes counteracts dietary lipid perturbations to maintain cellular fitness

Kandice R Levental et al. Nat Commun. .

Abstract

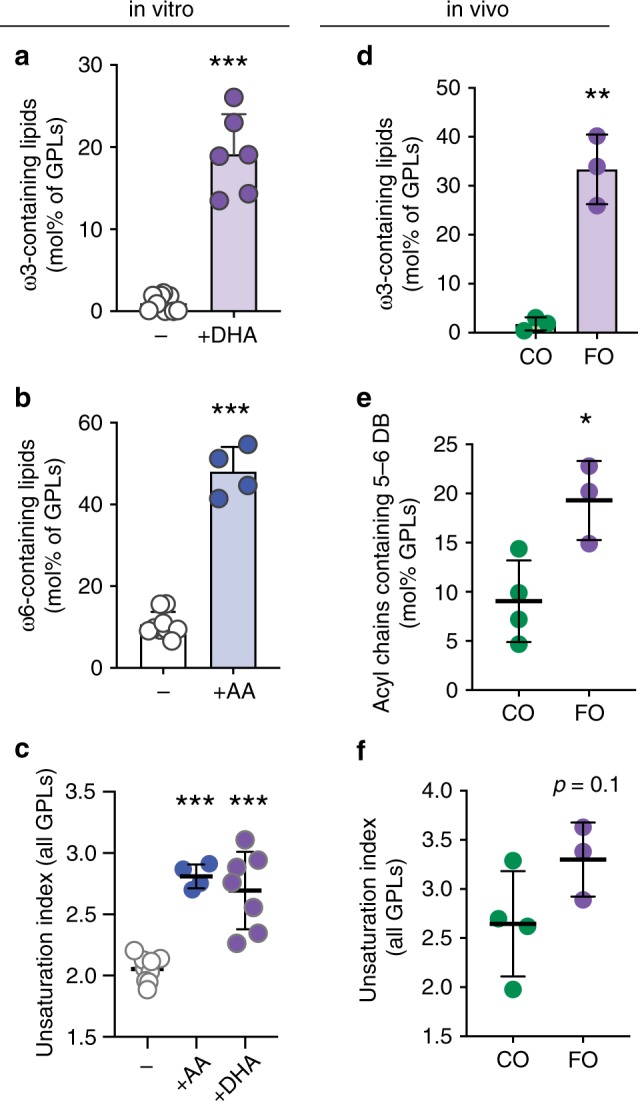
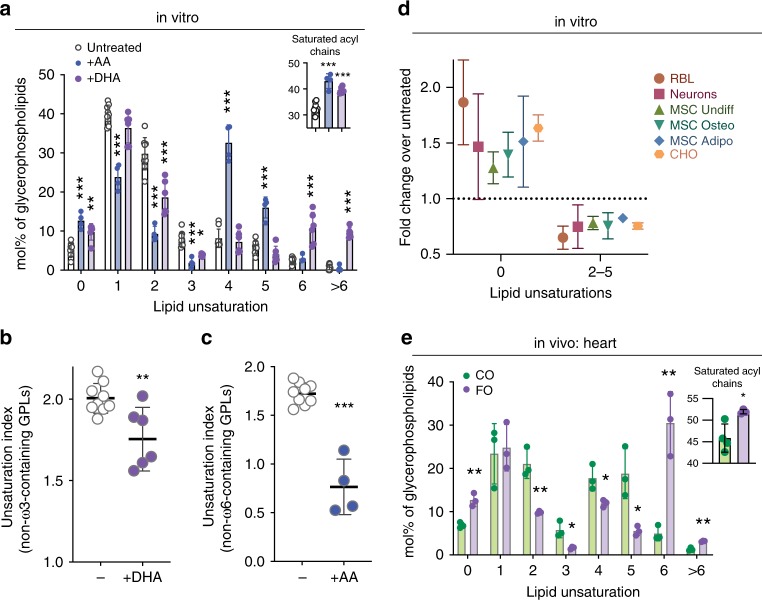
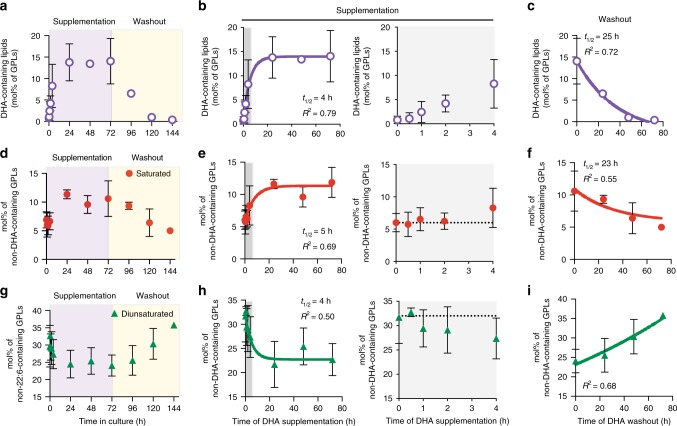
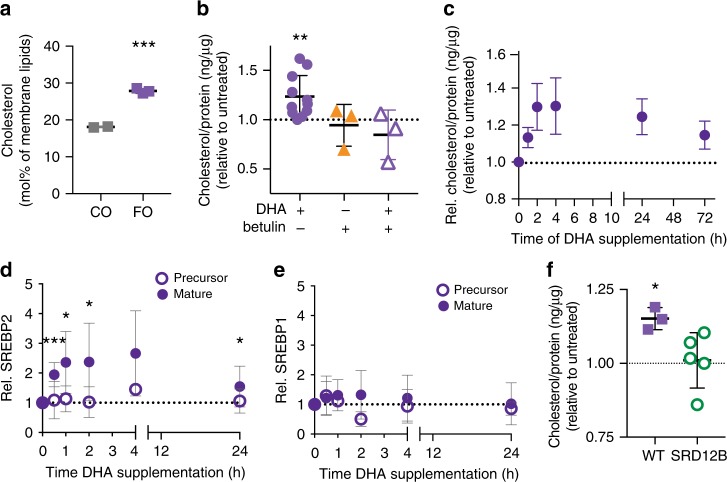
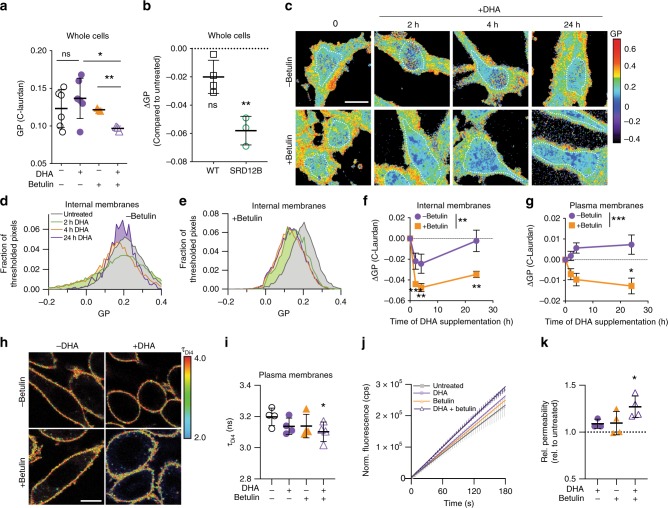
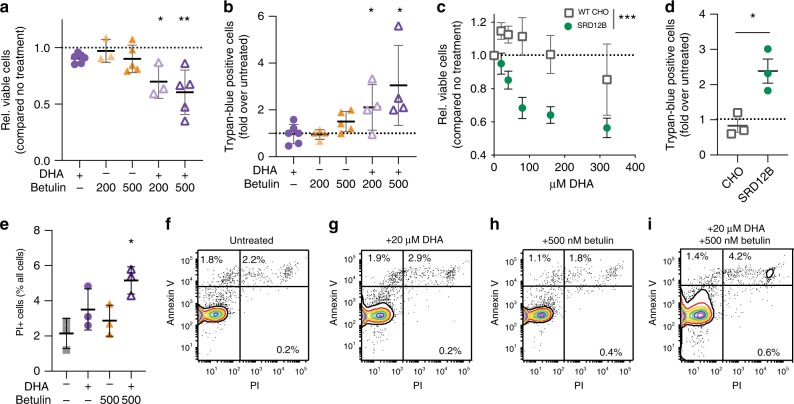
Proper membrane physiology requires maintenance of biophysical properties, which must be buffered from external perturbations. While homeostatic adaptation of membrane fluidity to temperature variation is a ubiquitous feature of ectothermic organisms, such responsive membrane adaptation to external inputs has not been directly observed in mammals. Here, we report that challenging mammalian membranes by dietary lipids leads to robust lipidomic remodeling to preserve membrane physical properties. Specifically, exogenous polyunsaturated fatty acids are rapidly incorporated into membrane lipids, inducing a reduction in membrane packing. These effects are rapidly compensated both in culture and in vivo by lipidome-wide remodeling, most notably upregulation of saturated lipids and cholesterol, resulting in recovery of membrane packing and permeability. Abrogation of this response results in cytotoxicity when membrane homeostasis is challenged by dietary lipids. These results reveal an essential mammalian mechanism for membrane homeostasis wherein lipidome remodeling in response to dietary lipid inputs preserves functional membrane phenotypes.


Conflict of interest statement

The authors declare no competing interests.

Figures

Fig 1
Fig 1. Supplemented PUFAs are robustly incorporated into membrane phospholipids in vitro and in vivo.
Supplementation of culture media with PUFAs for 3 days (20 μM) leads to a dramatic increase in (a) ω−3 PUFA-containing membrane lipids in RBL cells supplemented with DHA and (b) ω−6 PUFA-containing membrane lipids supplemented with AA. (c) Both treatments result in significantly increased overall unsaturation of membrane lipids. The unsaturation index reflects a concentration-weighted average lipid unsaturation. (d) Mice fed a diet rich in fish oil (FO) have significantly more lipids containing ω−3 PUFAs compared to corn oil (CO) fed mice. (e) Incorporation of dietary ω−3 PUFAs increases cardiac tissue lipids containing very highly unsaturated (5 or 6 double bonds) acyl chains, resulting in an (f) increase in the overall unsaturation of membrane glycerophospholipids. Individual experiments (ac) or animals (df) are shown. Bars represent mean ± SD. **p < 0.01, ***p < 0.001 for unpaired t test compared to untreated. Treatment with saturated (PA) or monounsaturated (OA) fatty acids in these conditions had no effect on the lipidome (see Fig. S2). Source data are provided as a Source Data file.
Fig. 2
Fig. 2. Lipidome remodeling induced by PUFA incorporation.
a Lipidome-wide remodeling of lipid unsaturation induced by DHA or AA supplementation. Both PUFAs induce significantly increased saturated lipids and decrease lipids containing di- and tri-unsaturated lipids. Inset shows the mol% of fully saturated acyl chains in GPLs. b, c The unsaturation index (concentration-weighted average lipid unsaturation) of lipids not containing the supplemented FAs and their derivatives is significantly reduced upon PUFA supplementation. For accurate estimates of lipidomic remodeling, the supplemented FAs and their derivatives are removed from the analysis, as the rather extreme over-abundance of those species upon supplementation suppresses the visualization of compensatory effects (e.g. for DHA supplementation, lipids containing 22:6, 20:5, or 24:6 are removed and then the unsaturation index of the “remaining” lipids is calculated). d DHA-mediated lipidomic remodeling, indicated by increased saturated lipids and decreased polyunsaturated lipids (2–5 unsaturations), is consistent across multiple cell types, including isolated rat hippocampal neurons, cultured human MSCs, and MSCs differentiated into adipogenic or osteogenic lineages. e Lipid unsaturation profile in membrane lipids isolated from murine heart tissue after feeding with CO versus FO. Incorporation of ω-3 PUFAs into membrane lipids (see Fig. 1d) is associated with lipidomic remodeling, namely higher levels of saturated lipids. Inset shows the mol% of fully saturated acyl chains in GPLs. All data are average ±SD for n ≥ 3 biological replicates. (a) and (e) are two-way ANOVA with Sidak’s multiple comparison test. (bc) and insets are student’s t test compared to untreated. *p < 0.05, **p < 0.01, ***p < 0.001. Source data are provided as a Source Data file.
Fig. 3
Fig. 3. Time course of DHA incorporation and lipidome remodeling.
ac Time course of DHA incorporation into GPLs following supplementation, then wash-out. Time course of nearly concomitant (df) saturated lipid and (gi) di-unsaturated lipid changes induced by DHA supplementation. The gray areas in (b), (e), and (h) are shown in extended charts to the right of each panel to illustrate the timing of the remodeling. All data shown are average ±SD for n ≥ 3 biological replicates. All fits shown are first-order kinetic models. Source data are provided as a Source Data file.
Fig 4
Fig 4. Cholesterol upregulation by DHA supplementation.
a Cholesterol levels are higher in membranes isolated from murine heart tissue after feeding with FO compared to CO. b Membrane cholesterol is significantly increased by DHA supplementation of cultured RBLs. Effect is abrogated by simultaneous treatment with 200 nM betulin. c Time course suggests cholesterol increase is a rapid response to DHA-mediated membrane perturbation. d The “mature”, transcription-competent form of SREBP2 is rapidly produced in response to DHA supplementation; n > 6. e SREBP1 proteolytic processing is not significantly affected by DHA supplementation; n = 4. f Cholesterol is significantly increased in WT CHO cells treated with DHA; this effect is abrogated in cells with a defect in SREBP activation (SRD12B; S1P-negative). All data shown are average ±SD for n ≥ 3 biological replicates; ***p < 0.001 in (a) is one-sample t test between groups; *p < 0.05, **p < 0.01, ***p < 0.001 in (b), (d), and (f) are one-sample t tests compared to untreated. Full representative Western blots shown in Supplementary Fig. 6. Source data are provided as a Source Data file.
Fig 5
Fig 5. Physical membrane homeostasis is disrupted by inhibition of lipidomic response.
a Spectroscopy of C-Laurdan-labeled homogenized whole cell membranes shows that neither DHA nor betulin alone affected membrane packing (GP) after 24 h, whereas DHA + betulin significantly reduced membrane packing. b Similarly, DHA supplementation had no effect on WT CHO cells after 24 h, whereas SRD-12B cells (defective in SREBP processing) had significantly reduced membrane packing. c GP maps of RBL cells treated with DHA and/or betulin demonstrate temporal changes in lipid packing (GP). The white dotted lines denote the areas from which the GP of the internal membranes was calculated. d, e GP histograms of internal membranes from images in c. Leftward shift in histograms denotes less tightly packed, more fluid membranes. f, g ΔGP represents GP of treated cells normalized to untreated within each experiment. Internal membranes are initially fluidized by excess DHA-containing lipids (purple), then recover to baseline by 24 h. In contrast, internal membrane packing does not recover in betulin-treated cells (orange). g DHA supplementation had no significant effect on packing at the plasma membrane (PM); however, when betulin is added to inhibit lipidomic remodeling, the PM also becomes significantly more fluid upon DHA supplementation. The effect of betulin treatment in PMs was significant (p < 0.001) by 2-way ANOVA. h Fluorescence lifetime imaging of Di4 to probe membrane packing in the PM. Warmer colors represent higher lifetimes (e.g. more tightly packed membranes). i Only the combined DHA + betulin treatment significantly reduced Di4 lifetime. j Exemplary plots of accumulation of fluorescein fluorescence during incubation with FDA. k PM permeability to FDA increases by treatment with DHA + betulin. Average ±SD for n ≥ 3 biological replicates. *p < 0.05, **p < 0.01, ***p < 0.001. (a) is a student's t test between groups. (b), (d), (e), and (k) are one-sample t tests compared to untreated. (fg) is a two-way ANOVA to compare effect of treatment; each time point for betulin-treated cells was significantly different from zero (p < 0.01). (i) shows paired t tests compared to untreated. In (j), linear regressions are shown. Scale bars are 10 μm. Source data are provided as a Source Data file.
Fig 6
Fig 6. Inhibition of homeostatic lipidome remodeling induces non-apoptotic cytotoxicity.
a Neither DHA nor betulin alone were cytotoxic in RBLs, whereas their combination significantly reduced viability. Full dose-response in Supplementary Fig. 10a b 24 h of DHA + betulin treatment significantly increased trypan-positive cells. c In SRD-12B cells, which fail to upregulate cholesterol and saturated lipids upon DHA treatment (see Fig. 4d and Supp Fig. S6), DHA significantly inhibited cell growth, in contrast to control WT CHO cells. d In SRD-12B cells, DHA significantly increased the proportion of TB+ cells, in contrast to WT CHO cells. e DHA + betulin treatment for 24 h significantly increased the proportion of PI+ cells. fi Flow cytometry showed no increase in AnxV+/PI− cells (reflective of apoptosis), while the AnxV+/PI+ cells (non-apoptotic cell death) were increased. Flow cytometry positive controls shown in Fig. S13. All data shown as mean ± SD for ≥3 independent experiments. (a), (b), and (d) are one-sample t tests compared to untreated; (e) is student’s t test compared to untreated; (c) is two-way ANOVA for effect of treatment. *p < 0.05, **p < 0.01, ***p < 0.001. Source data are provided as a Source Data file.

Similar articles

Cited by

References

    1. Krogh A, Larsson B, von Heijne G, Sonnhammer EL. Predicting transmembrane protein topology with a hidden Markov model: application to complete genomes. J. Mol. Biol. 2001;305:567–580. doi: 10.1006/jmbi.2000.4315. - DOI - PubMed
    1. Janmey PA, Kinnunen PK. Biophysical properties of lipids and dynamic membranes. Trends cell Biol. 2006;16:538–546. doi: 10.1016/j.tcb.2006.08.009. - DOI - PubMed
    1. Los DA, Murata N. Membrane fluidity and its roles in the perception of environmental signals. Biochim Biophys. Acta. 2004;1666:142–157. doi: 10.1016/j.bbamem.2004.08.002. - DOI - PubMed
    1. Andersen OS, Koeppe RE., II. Bilayer thickness and membrane protein function: an energetic perspective. Annu Rev. Biophys. Biomol. Struct. 2007;36:107–130. doi: 10.1146/annurev.biophys.36.040306.132643. - DOI - PubMed
    1. Covino R, et al. A eukaryotic sensor for membrane lipid saturation. Mol. Cell. 2016;63:49–59. doi: 10.1016/j.molcel.2016.05.015. - DOI - PubMed

Publication types