. 2020 Mar 12;11(1):1343.
doi: 10.1038/s41467-020-15198-9.

Digenic inheritance of mutations in EPHA2 and SLC26A4 in Pendred syndrome

Affiliations

Digenic inheritance of mutations in EPHA2 and SLC26A4 in Pendred syndrome

Mengnan Li et al. Nat Commun. .

Abstract

Enlarged vestibular aqueduct (EVA) is one of the most commonly identified inner ear malformations in hearing loss patients including Pendred syndrome. While biallelic mutations of the SLC26A4 gene, encoding pendrin, causes non-syndromic hearing loss with EVA or Pendred syndrome, a considerable number of patients appear to carry mono-allelic mutation. This suggests faulty pendrin regulatory machinery results in hearing loss. Here we identify EPHA2 as another causative gene of Pendred syndrome with SLC26A4. EphA2 forms a protein complex with pendrin controlling pendrin localization, which is disrupted in some pathogenic forms of pendrin. Moreover, point mutations leading to amino acid substitution in the EPHA2 gene are identified from patients bearing mono-allelic mutation of SLC26A4. Ephrin-B2 binds to EphA2 triggering internalization with pendrin inducing EphA2 autophosphorylation weakly. The identified EphA2 mutants attenuate ephrin-B2- but not ephrin-A1-induced EphA2 internalization with pendrin. Our results uncover an unexpected role of the Eph/ephrin system in epithelial function.


Conflict of interest statement

The authors declare no competing interests.

Figures
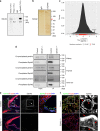
Fig. 1
Fig. 1. Identification of pendrin as an interacting protein of EphA2.
a, b Immunoprecipitation of EphA2 from kidney lysate. Specific precipitation of EphA2 was confirmed by western blotting analysis (a) and by silver staining (b) of precipitated protein compared to IgG control. Indicated numbers in a represent relative amount of precipitated EphA2 and EphA2 passed thorough immunoprecipitation compared to input (pass). c Identification of pendrin by label free quantification in mass spectrometry-based protomics analysis of EphA2 immunoprecipitate as compared to IgG control. Pendrin is the protein with the highest enrichment among membrane localized proteins. The ratio distribution of proteins identified is shown as a kernel density estimate. Localization of transmembrane proteins in the distribution is indicated red in the rug. d Confirmation of the protein complex by immunoprecipitation using an anti-EphA2 antibody. Precipitated proteins from the kidney, the thyroid and the inner ear from control and EphA2 KO mice were analyzed by western blotting analysis with the EphA2 and the anti-pendrin antibodies respectively. e Immunostaining of the inner ear using anti-EphA2 specific antibody (green or gray, arrowhead) with phalloidin (red, F-actin) and DAPI (blue, nucleus). The specificity of the signal against EphA2 was confirmed in the EphA2 KO inner ear. SL spiral ligament, SV stria vascularis, SP spiral prominence. f Immunostaining of the thyroid using anti-EphA2 specific antibody (green) with phalloidin (red, F-actin) and DAPI (blue, nucleus). The specific signal of EphA2 was confirmed in the EphA2 KO thyroid. The strong signal of EphA2 was observed at basal membrane (arrow). Although the signal is weak, EphA2 expression was also confirmed at apical surface (arrowhead). Source data are provided as a Source Data file.
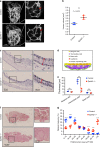
Fig. 2
Fig. 2. Morphological analysis of EphA2 KO mice phenotype in the inner ear and thyroid.
a View of the inner ear of control (upper panels) and EphA2 KO mice (lower panels) visualized by µCT. Arrows in the sagittal section indicate the lumen in the cochlea. b Lumen volume was quantified. Lines indicate mean value from three animals with SD. **p < 0.01 by student t-test. ce Thickness of stria vascularis in the EphA2 KO mice was reduced compared to that in control mice. c H&E staining of the inner ear are shown. Dot-line indicates the boarder of cell layers. d SV was consisted of mainly three cell types, maginal cells, intermedia cells and basal cells as shown in (d). H&E staining of the inner ear revealed a decreased thickness of the intermedia cell layter in EphA2 KO mice. e Average data from 4 animals are presented. Lines indicate mean value from four animals with SD. **p < 0.01 by student t-test. f, g EphA2 KO mice exhibited Thyroid goitre. H&E staining of thyroid sections are shown in (f). Proportion of follicle lumen area in control and EphA2 KO mice is presented in the graph (g). Mean ± SD.; one-way ANOVA; ****p < 0.0001, ***p < 0.001, **p < 0.01. Source data are provided as a Source Data file.
Fig. 3
Fig. 3. Compromised localization of pendrin in EphA2 KO mice.
a Immunostaining of pendrin in the inner ear of control and EphA2 KO mice. Green, pendrin; red, actin; blue, DAPI. Arrowheads indicate the immunoreactive signal corresponding to pendrin. b Immunostaining of pendrin in the thyroid of control and EphA2 KO mice. Green, pendrin; red, actin; blue, DAPI. Arrowheads indicate the immunoreactive signal corresponding to pendrin. c Immunostaining of pendrin in the kidney of control and EphA2 KO mice. Green, pendrin; red, actin; blue, DAPI. Arrows and arrowheads indicate the immunoreactive signal corresponding to pendrin. d Immunostaining of KCNJ10 in the inner ear of control and EphA2 KO mice. KCNJ10 expression in stria vascularis shown in green was reduced in EphA2 KO mice. e Average data from four animals are presented. Lines indicate mean value from 4 animals with SD. ***p < 0.001 by Studentʼs t-test. Source data are provided as a Source Data file.
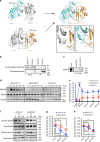
Fig. 4
Fig. 4. Ephrin-B2 is a ligand of EphA2.
a Overall structure of the EphA2/ephrin-A1, EphA4/ephrin-B2, and EphA2/ephrin-B2 complexes. Protein Data Bank codes are indicated. In addition to a loose fit of the ephrin-B2 G-H loop in the EphA4 ligand-binding channel, a second contact region in the EphA4-ephrin-B2 interface involving extensive surface polar contacts may form binding of EphA4 to ephrin-B2 (i). The side chain hydrogen bond between Gln40 of EphA4 and Gln106 of ephrin-B2 (ii) and the side chain salt bridge between Glu42 and Lys109 of ephrin-B2 (i) might form the binding of ephrin-B2 and EphA4. b Immunoprecipitation of ephrin-B2 with EphA2. Precipitated proteins analyzed by immunoblot. c Pull-down analysis using ephrin-B2-Fc fusion protein. Co-precipated EphA2 is shown by immunoblot analysis. d The effect of ephrin-B2 and ephrin-A1 stimulation on EphA2 autophosphorylation. Cultured MDCK II cells were stimulated with ligands for the indicated time. e Relative amount of phospho-EphA2 is shown. Mean ± SEM.; one-way ANOVA; ****p < 0.0001, ***p < 0.001, **p < 0.01, *p < 0.05; (n = 3). f The effect of ephrin-B2 and ephrin-A1 stimulation on EphA2 and pendrin internalization. Samples were analyzed by western blotting with indicated antibodies. e Relative amount of cell surface EphA2 (g) or pendrin (h) is shown. Mean ± SEM.; one-way ANOVA; *p < 0.05; (n = 3). Source data are provided as a Source Data file.
Fig. 5
Fig. 5. Some pathogenic variants of pendrin are not affected by EphA2/ephrin-B2 regulation.
a, b Immunoprecipitation of EphA2 with mutated pendrin. myc-pendrin A372V, L445W, Q446R, G672E were not co-immunoprecipitated with EphA2. Densitometric quantifications are shown (b). Mean ± SEM; one-way ANOVA with Bonferroni post hoc analyses; *p < 0.05; (n = 3). c, d Immunoprecipitation of EphA2 with mutated pendrin. Immunocomplex of myc-pendrin L117F, S166N and F355L was not affected. Densitometric quantifications are shown (d). Mean ± SEM; (n = 3). e, f Internalization of EphA2 and mutated pendrin triggered by ephrin-B2 stimulation. Pendrin S166N was not internalized after ephrin-B2 stimulation while EphA2 and other mutated pendrins were not affected. f Relative amount of cell surface pendrin is shown. Mean ± SEM; one-way ANOVA; **p < 0.01; *p < 0.05; (n = 3). Source data are provided as a Source Data file.
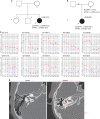
Fig. 6
Fig. 6. Identification and characterization of EphA2 mutation from hearing loss patients with EVA.
a, b Pedigree chart of the patients carrying mono-allelic EPHA2 and SLC26A4 mutations. c Audiograms of the patient with mono-allelic EPHA2 p.T511M and SLC26A4 p.T410M mutations. d Temporal bone computed tomography (CT) scan of the patient with mono-allelic EPHA2 p.T511M and SLC26A4 p.T410M mutations. The arrow indicates the vestibular aqueduct in the patient and the healthy control.
Fig. 7
Fig. 7. Identified EphA2 mutations affect its ability to bind ephrin-B2 but not ephrin-A1.
a Pulldown assay using ephrin-A1 or ephrin-B2 Fc fusion proteins with V5-EphA2 and V5-mutated EphA2. Input and pulldown protein with Fc fusion proteins are shown by immunoblot analysis with anti-V5 antibody. Relative amount of pulled down EphA2 is shown below. Mean ± SEM.; two-way ANOVA; **p < 0.01; *p < 0.05; (wt, n = 6; mt, n = 3). b The effect of identified mutations on ephrin-A1 and ephrin-B2 induced EphA2 internalization. After surface biotinylation, samples were analyzed by western blotting analysis using an anti-V5 antibody. Relative amount of cell surface EphA2 is shown below. Mean ± SEM; one-way ANOVA; *p < 0.05; (n = 3). c The effect of identified mutations on ephrin-A1 and ephrin-B2 induced pendrin internalization. After surface biotinylation, samples were analyzed by western blotting analysis using an anti-pendrin antibody. Relative amount of cell surface pendirn is shown below. Mean ± SEM; one-way ANOVA; *p < 0.05; (n = 3). d Immunoprecipitation of mutated EphA2 with pendrin. EphA2 mutations do not affect the binding ability of EphA2 with pendrin. Densitometric quantifications are shown below. Mean ± SEM; (n = 3). Source data are provided as a Source Data file.

References

    1. Everett LA, et al. Pendred syndrome is caused by mutations in a putative sulphate transporter gene (PDS) Nat. Genet. 1997;17:411–422. doi: 10.1038/ng1297-411. - DOI - PubMed
    1. Everett LA, Morsli H, Wu DK, Green ED. Expression pattern of the mouse ortholog of the Pendred’s syndrome gene (Pds) suggests a key role for pendrin in the inner ear. Proc. Natl Acad. Sci. USA. 1999;96:9727–9732. doi: 10.1073/pnas.96.17.9727. - DOI - PMC - PubMed
    1. Reardon W, et al. Pendred syndrome-100 years of underascertainment? QJM. 1997;90:443–447. doi: 10.1093/qjmed/90.7.443. - DOI - PubMed
    1. Wall SM, Lazo-Fernandez Y. The role of pendrin in renal physiology. Annu. Rev. Physiol. 2015;77:363–378. doi: 10.1146/annurev-physiol-021014-071854. - DOI - PubMed
    1. Usami S, et al. Non-syndromic hearing loss associated with enlarged vestibular aqueduct is caused by PDS mutations. Hum. Genet. 1999;104:188–192. doi: 10.1007/s004390050933. - DOI - PubMed

Publication types

MeSH terms

Supplementary concepts