. 2020 Mar 12;10(1):4574.
doi: 10.1038/s41598-020-61242-5.

Regulation of keratin network dynamics by the mechanical properties of the environment in migrating cells

Affiliations

Regulation of keratin network dynamics by the mechanical properties of the environment in migrating cells

Anne Pora et al. Sci Rep. .

Abstract

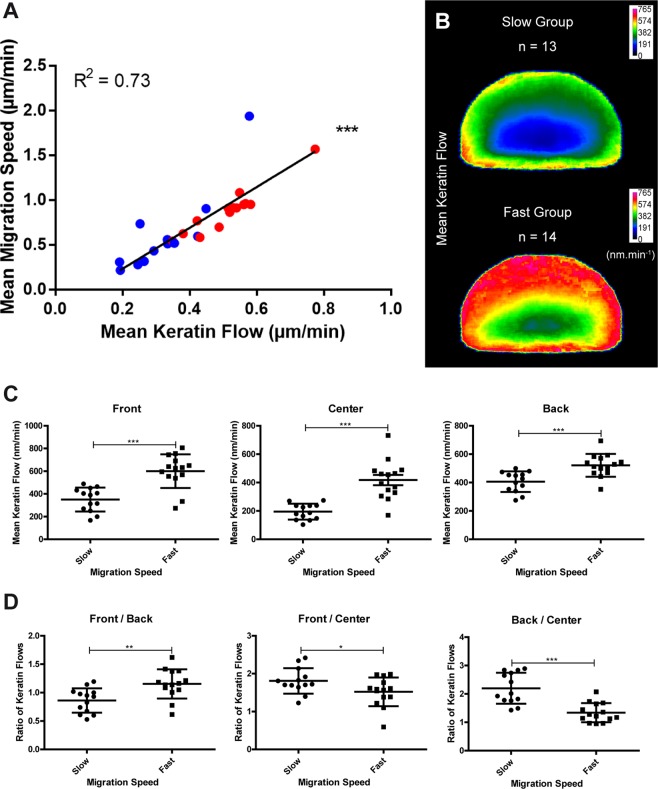
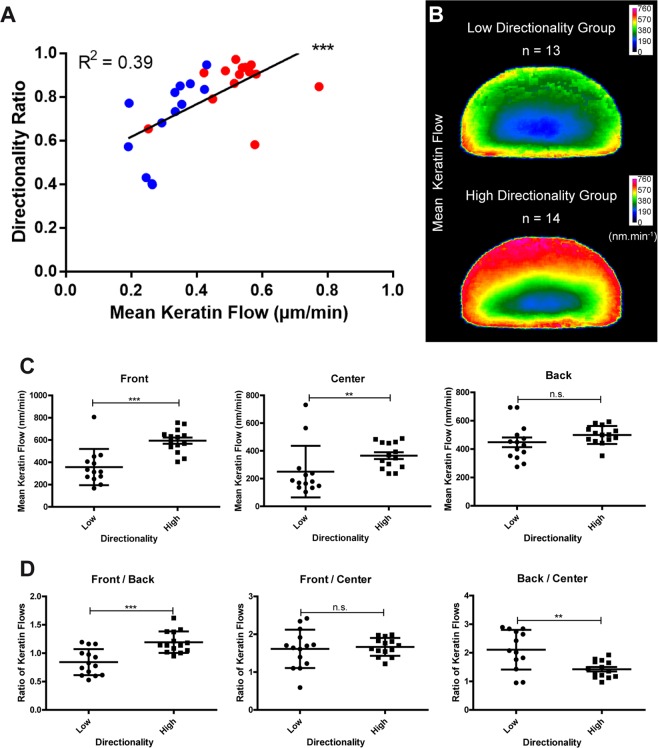
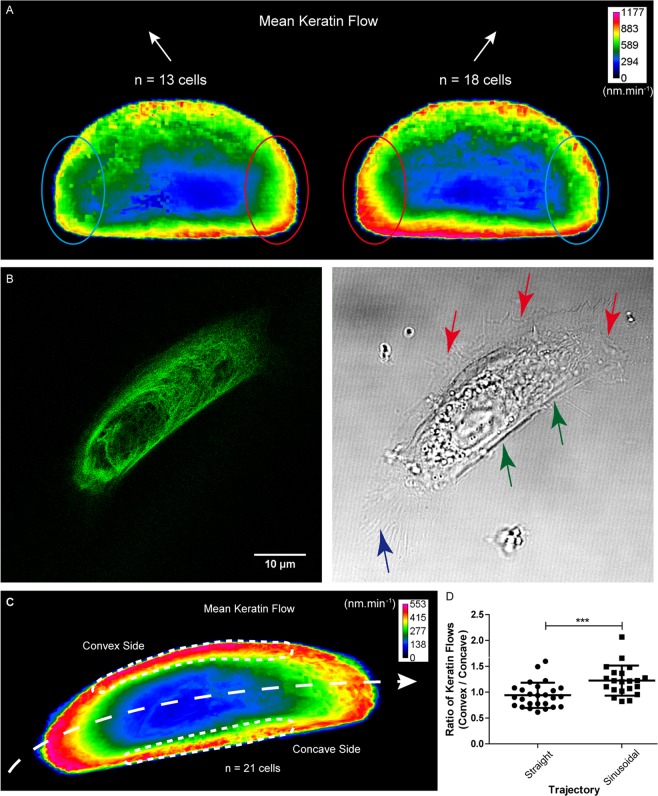
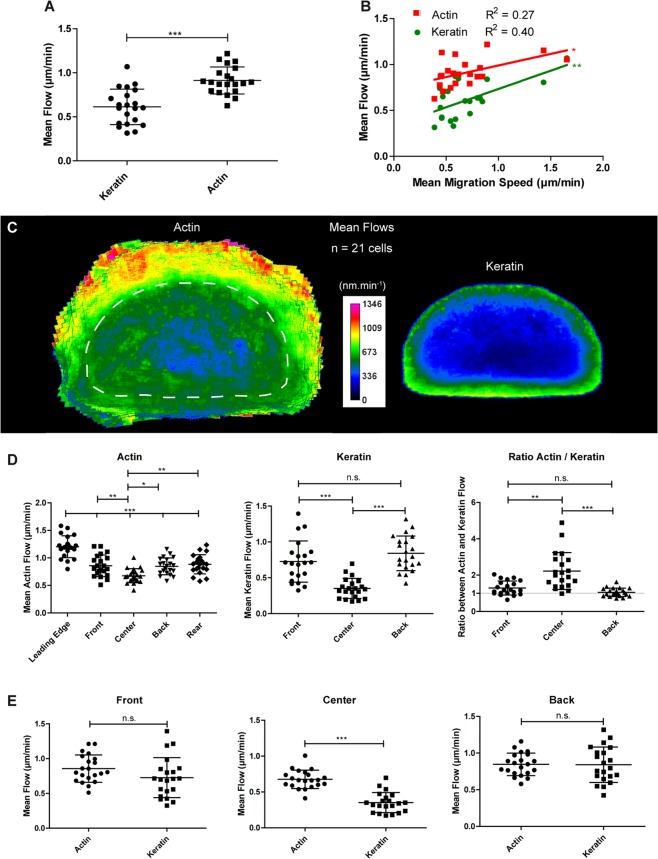
Keratin intermediate filaments provide mechanical resilience for epithelia. They are nevertheless highly dynamic and turn over continuously, even in sessile keratinocytes. The aim of this study was to characterize and understand how the dynamic behavior of the keratin cytoskeleton is integrated in migrating cells. By imaging human primary keratinocytes producing fluorescent reporters and by using standardized image analysis we detect inward-directed keratin flow with highest rates in the cell periphery. The keratin flow correlates with speed and trajectory of migration. Changes in fibronectin-coating density and substrate stiffness induces concordant changes in migration speed and keratin flow. When keratinocytes are pseudo-confined on stripes, migration speed and keratin flow are reduced affecting the latter disproportionately. The regulation of keratin flow is linked to the regulation of actin flow. Local speed and direction of keratin and actin flow are very similar in migrating keratinocytes with keratin flow lagging behind actin flow. Conversely, reduced actin flow in areas of high keratin density indicates an inhibitory function of keratins on actin dynamics. Together, we propose that keratins enhance persistence of migration by directing actin dynamics and that the interplay of keratin and actin dynamics is modulated by matrix adhesions.


Conflict of interest statement

The authors declare no competing interests.

Figures

Figure 1
Figure 1
The keratin flow in migrating nHEKs has a well-defined spatial distribution. Data were extracted from live-cell confocal fluorescence images (objective 63 x) of 27 transiently transfected nHEK K5-YFP cells migrating on fibronectin-coated glass (30 min recording, 1 image.min−1; see also Supplementary Fig. S4). (A-A”) The mean speed of the keratin flow is depicted as a heat map (A) and as column scatter plots of the cell front, center and back (A’). The ratios of the mean speeds of keratin flow determined in different parts of the cells are shown in (A”). The heatmaps were obtained after shape normalization. Highest flow is found at the periphery of the cell, while lowest flow was found close to the nucleus. For (A’,A”), ANOVA was used for statistical analysis (P < 0.0001) followed by Tukey’s test between all pairs of columns. (B-B’) Vector map of a single cell recording and column scatter plots representing the direction of keratin flow. 90° is defined as the direction of migration. Kruskal-Wallis test was used for statistical analysis (P < 0.0001) followed by Dunn’s multiple comparison test between all pairs of columns. The flow is retrograde in the front and center, and in the direction of migration at the back end. n.s., not significant. The figure is modified from.
Figure 2
Figure 2
Higher migration speed correlates with increased keratin flow. Data were extracted from live-cell confocal fluorescence images (same as those used for Fig. 1) of nHEKs transiently transfected with K5-YFP. (A) Graph of the mean migration speed in relation to the mean keratin flow. Each dot represents one cell (n = 27). Higher keratin flow correlates with higher migration speed and the increase appears linear. Statistical analysis was performed using Spearman correlation (P < 0.0001, R² = 0.73). Red and blue denotes migrating cells with high and low directionality, respectively. (B–D) The cells were grouped as slow (n = 13) comprising cells with a migration speed < 0.65 µm.min−1 and fast (n = 14) comprising cells with a migration speed > 0.65 µm.min−1. (B) Heat maps of the mean normalized keratin flow in the slow (top) and fast (bottom) group after shape normalization. (C) Column scatter plots of the mean keratin flow in the cell front, center and the back of both groups. (D) Column scatter plots of the ratios between the mean keratin flow in different areas of fast and slow moving nHEKs. Note that the two groups have significantly different mean migration speeds. There is an overall increase in the keratin flow between both groups. The strongest increase is found in the cell center, the lowest in the back of the cell. Statistical analysis was performed using unpaired Student t-test (P < 0.0001 in D (with Welch correction in center area); P = 0.0037 in D (front/back); P = 0.0457 in D (front/center); P < 0.0001 in D (back/center)). The figure is modified from.
Figure 3
Figure 3
Higher directionality ratio of migration correlates with increased keratin flow. Data were extracted from live-cell confocal images (same as those used for Figs. 1 and 2) of transiently transfected K5-YFP nHEKs. (A) Graph of the directionality ratio in relation to the mean keratin flow. Each dot represents one cell (n = 27). Higher keratin flow correlates with higher directionality ratio. Statistical analysis was performed using Spearman correlation test (P = 0.0001, R² = 0.3896). Red and blue denote fast and slow migrating cells, respectively. (B–D) The cells were divided into a low directionality group (n = 13) comprising cells with a directionality ratio < 0.84 and a high directionality group (n = 14) comprising cells with a directionality ratio > 0.84. (B) Heat maps of the mean keratin flow in the low (top) and high directionality groups (bottom) after shape normalization. (C) Column scatter plots of the mean keratin flow in the cell front, center and the back of both groups. The two groups show significantly different directionality ratios. There is an overall increase in keratin flow in the high directionality versus the low directionality group. The strongest increase is found in the front and center of the cell. The following statistical tests were used: Mann-Whitney test (P = 0.0005 for front area in D; P = 0.0053 for center area in C), unpaired Student t-test (P = 0.532 for back area in C; P < 0.0001 for front/back in D), Student t-test with Welch’s correction (P = 0.9424 for front/center in D; P = 0.0051 for back/center in C). The figure is modified from.
Figure 4
Figure 4
Change in direction of migration induces symmetry break in keratin flow patterns. Keratin flow was determined in K5-YFP nHEKs in different situations. (A) Fluorescence recordings of nHEKs producing K5-YFP and migrating on fibronectin-coated glass slides were selected for cells that either turned left or right during 30 min confocal time-lapse imaging (n = 11 with 60 s intervals and n = 20 with 120 s intervals) as judged from CMove analysis. The heat maps depict the shape-normalized mean keratin flow patterns of 13 cells turning left and 18 cells turning right. Note that areas with higher flow are located directly opposite to the new direction of migration, i.e. at the right back corner of cells turning left and vice versa (compare corresponding areas at the left and right back of the cells circled in red (higher flow) and blue (lower flow)). (B) The live-cell confocal fluorescence and corresponding phase contrast image (objective 63 x) of an K5-YFP nHEK migrating toward the right on a micropatterned fibronectin-coated sinusoidal stripe (width 15 µm, curvature 0.02 µm−1) is taken from corresponding Movie 2. The elongated cell adapts to the line width and the nucleus is shifted towards the back. Highly dynamic filopodia and lamellopodia are seen at the front and convex cell margins (red arrows) whereas the concave margin is straight (green arrows) and the cell rear extends long retraction fibers (blue arrow). (C) Heat map of the mean normalized keratin flow derived from fluorescence recordings of 21 K5-YFP nHEKs migrating on a sinusoidal stripe after shape normalization. Highest flow is found in the front and convex margin. (D) Column scatter plots depicting the ratio between the average keratin flow in the convex and concave part of cells migrating on sinusoidal stripes (n = 21). For comparison K5-YFP nHEKs migrating on straight stripes (width 15 µm; n = 26) were imaged. Statistical analysis was performed using Mann-Whitney test (P = 0.0007). Higher asymmetry in the keratin flow is seen for cells on sinusoidal than on straight stripes. The figure is modified from.
Figure 5
Figure 5
Confinement impedes migration speed and keratin flow. K5-YFP nHEK migration was restricted to micropatterned 15 µm wide fibronectin-coated stripes. As control, K5-YFP-expressing nHEKs were seeded on fibronectin-coated coverslips that were prepared by deep UV illumination exactly like the micropatterned coverslips but covering the entire glass surface of the coverslip (i.e. without mask). Fluorescence images were recorded by confocal laser microscopy (objective 63 ×, 1 image.min−1 for 30 min; n = 26 for cells on micropattern; n = 13 for control cells). (A) Fluorescence and corresponding brightfield image of a K5-YFP nHEK migrating on a fibronectin-coated stripe (see corresponding Movie 3). The cell is elongated and the nucleus (green arrow) is shifted towards the back. The front of the cell (red arrow) is rich in lamellipodia and filopodia, while the back (blue arrow) contains multiple retraction fibers. (B) Column scatter blots depict the effect of confinement for mean cell area and mean cell eccentricity. Unpaired Student t-test (P = 0.018 for mean cell area; P < 0.0001 for mean cell eccentricity). (C) Graphical representation of the stripe-induced pseudo-confinement on mean migration speed. Mann-Whitney test (P < 0.0001). (D) Graphical representation of the mean keratin flow depending on stripe-induced confinement. Unpaired Student t-test (P < 0.0001). (E) Graph depicting the relationship between the mean migration speed and mean keratin flow with or without confinement. For a given migration speed, keratin flow is slower for cells forced to migrate on stripes than for free migrating cells. Pearson correlation (Control: P < 0.0001, R² = 0.7859; Stripes: P = 0.009, R² = 0.2509). (F) Heatmap representing the mean speed of the keratin flow after shape normalization in K5-YFP nHEKs migrating on a stripe. (G) Column scatter plots of the speed of the keratin flow in the front, center and back of cells migrating on stripes. (H) Column scatter plots of the ratios between the speed of the keratin flow in different areas of cells migrating on stripes. For (G,H) Kruskal-Wallis test was used for statistical analysis (P < 0.0001) then Dunn’s test between all pairs of columns. The figure is modified from.
Figure 6
Figure 6
Increased ECM coating density induces a decrease in migration speed and keratin flow. Data were extracted from confocal images (30 min recordings, 1 image.min−1; objective 63 x) of transiently transfected K5-YFP nHEKs migrating on glass with low (n = 14) or high fibronectin coating density (n = 10). (A) Column scatter plots show fibronectin density in relation to mean cell area (left) and mean cell eccentricity (right). Unpaired Student t-test for mean cell area (P = 0.8011) and Student t-test with Welch’s correction for mean cell eccentricity (P = 0.3966; n.s., not significant). Note that the cell morphology is not affected by different coating densities. (B) Graphical representation of migration characteristics in relation to coating density. At left, mean migration speed is shown (Mann-Whitney test; P = 0.0434); at right, the directionality ratio is depicted (unpaired Student t-test; P = 0.0017). An increase in coating density correlates with a decrease in migration speed and directionality. (C) Depicts relationship between keratin flow and fibronectin coating density. Unpaired Student t-test (P = 0.0029). (D) Graph of mean migration speed versus mean keratin flow. For a given migration speed, the corresponding keratin flow is similar irrespective of the coating density. Pearson correlation (low fibronectin coating density: P = 0.0063, R² = 0.4765; high fibronectin coating density: P = 0.0047, R² = 0.6530). (E) Heat maps showing the mean keratin flow in shape-normalized nHEKs migrating on low and high density fibronectin (n = 14 and n = 10, respectively). (F) Quantification of the effect of fibronectin coating densities on keratin flow in the cell front, center and back. Reduction is seen in all cell regions with the strongest decrease in the cell center. Unpaired Student t-test (P = 0.0174; front), Student t-test with Welch’s correction (P = 0.0044; center) and Mann-Whitney test (P = 0.0109; back). (G) The column scatter plots show keratin flow ratios in different cell regions at low and high fibronectin coating density. Unpaired Student t-test (P = 0.0684; front/back), Mann-Whitney test (P = 0.3641; front/center), and unpaired Student t-test (P = 0.0148; back/center). The figure is modified from.
Figure 7
Figure 7
Decreased substrate stiffness induces an increase in migration speed and keratin flow. Data were extracted from confocal images (30 min recordings, 1 image.min−1; objective 63 x) of transiently transfected K5-YFP nHEKs migrating on elastomeric substrates with high (1.2 MPa; n = 12) and low stiffness (1.5 kPa; n = 26). (A) Column scatter plots show the relationship between substrate stiffness and mean cell area (left) and mean cell eccentricity (right). Unpaired Student t-test (P = 0.4327 for mean cell area; P = 0.0007 for mean cell eccentricity). (B) Graphical representation of migration characteristics depending on the elastic modulus of the substrate. Mean migration speed is shown at left (Mann-Whitney test; P = 0.0035), directionality ratio at right (unpaired Student t-test; P = 0.0524). (C) Column scatter plots of the mean keratin flow depending on the elastic modulus of the substrate. Unpaired Student t-test; P = 0.0012). (D) Graph shows the relationship between mean migration speed and mean keratin flow in cells grown on substrates with different elastic moduli. Pearson correlation (glass coated with high fibronectin (fn): P = 0.0047, R² = 0.6530 [n = 10]; 1.2 MPa: P < 0.0001, R² = 0.8434; 1.5 kPa P = 0.0035, R² = 0.3034). (E) Heat maps of the mean keratin flow in shape-normalized nHEKs migrating on PDMS substrates with an elastic modulus of 1.2 MPa (n = 12) or 1.5 kPa (n = 26). (F) The column scatter plots show the effect of the elastic modulus of the substrate for keratin flow in the cell front, center and back. Unpaired Student t-test (P = 0.3434, front; P = 0.2165, center; P = 0.0105, back). (G) The column scatter plots show the ratios of keratin flow in different cell regions on substrates with high (1.2 Mpa) and low stiffness (1.5 kPa). Unpaired Student t-test (P = 0.1014, front/back; P = 0.3876, front/center, P = 0.9756, back/center). On softer substrates the increase in keratin flow is clearly detectable in the back of the cells. The figure is modified from.
Figure 8
Figure 8
Actin and keratin interact dynamically during migration. Data were extracted from live-cell confocal images (objective 63 x) of nHEKs transiently co-transfected with K5-YFP and LifeAct-DsRed constructs (n = 21) migrating on fibronectin-coated glass (30 min recording, 2 images.min−1; see also Movie 4). (A) Column scatter plot of the mean keratin and actin flow. Unpaired Student t-test (P < 0.0001). (B) Graph showing the mean actin and keratin flow in relation to the migration speed. Pearson correlation (for keratin P = 0.0022, R2 = 0.3974 and for actin P = 0.0152 and R2 = 0.2724). (C) Heat maps of the mean actin and keratin flows in shape-normalized migrating nHEKs. The signal shown for the actin flow outside the normalized shape corresponds to peripheral areas where actin can be found but no keratin (dotted line demarcates area with keratins). In these areas, the average flow was calculated only over the number of cells in which actin was detectable. (D) Left: Graphical representation of the speed of actin flow in five different areas of the cell. ANOVA (P < 0.0001) followed by Tukey’s test on all pairs of columns. Middle: Graphical representation of the speed of keratin flow in three different areas of the cell. ANOVA (P < 0.0001) followed by Tukey’s test on all pairs of columns. Right: Graphical representation of the ratio between actin and keratin flows in three different areas of the cells where both cytoskeletal components are detected. Kruskal-Wallis test (P < 0.0001) followed by Dunn’s test. (E) Column scatter plots of the actin and the keratin flow in the front, center and back of cells where both cytoskeletal components are detected. Unpaired Student t-test, left (P = 0.0932); unpaired Student t-test, middle (P < 0.0001); t-test with Welch’s correction, right (P = 0.9412). The figure is modified from.

References

    1. Doyle AD, Petrie RJ, Kutys ML, Yamada KM. Dimensions in cell migration. Curr. Opin. Cell Biol. 2013;25:642–649. doi: 10.1016/j.ceb.2013.06.004. - DOI - PMC - PubMed
    1. Ladoux B, Mege RM, Trepat X. Front-Rear Polarization by Mechanical Cues: From Single Cells to Tissues. Trends Cell Biol. 2016;26:420–433. doi: 10.1016/j.tcb.2016.02.002. - DOI - PMC - PubMed
    1. Leduc C, Etienne-Manneville S. Intermediate filaments in cell migration and invasion: the unusual suspects. Curr. Opin. Cell Biol. 2015;32:102–112. doi: 10.3390/cells8030231. - DOI - PubMed
    1. Herrmann, H. & Aebi, U. Intermediate Filaments: Structure and Assembly. Cold Spring Harb Perspect Biol8, 10.1101/cshperspect.a018242 (2016). - PMC - PubMed
    1. Jacob, J. T., Coulombe, P. A., Kwan, R. & Omary, M. B. Types I and II Keratin Intermediate Filaments. Cold Spring Harb Perspect Biol10, 10.1101/cshperspect.a018275 (2018). - PMC - PubMed

Publication types

LinkOut - more resources