

Abundant human anti-Galα3Gal antibodies display broad pathogen reactivity
- PMID: 32165720
- PMCID: PMC7067764
- DOI: 10.1038/s41598-020-61632-9
Abundant human anti-Galα3Gal antibodies display broad pathogen reactivity
Abstract
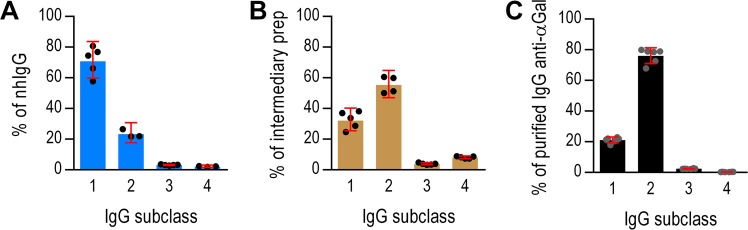
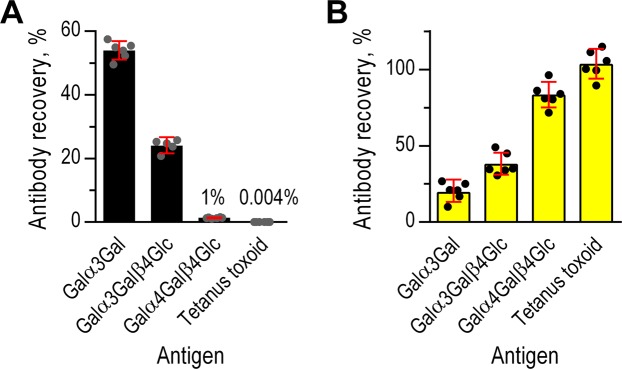
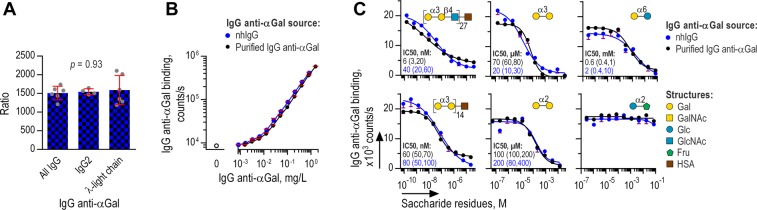
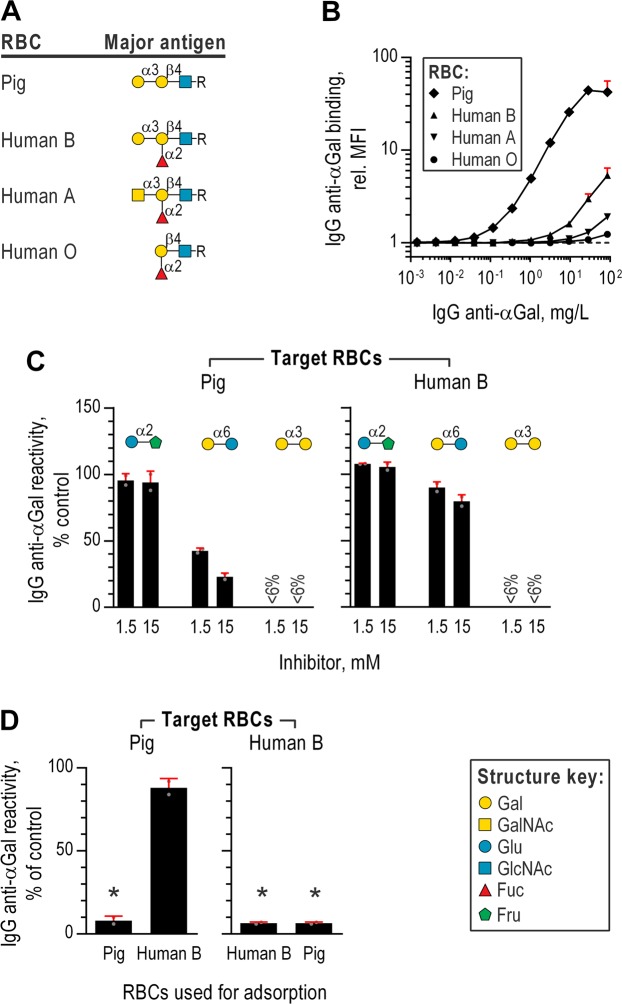
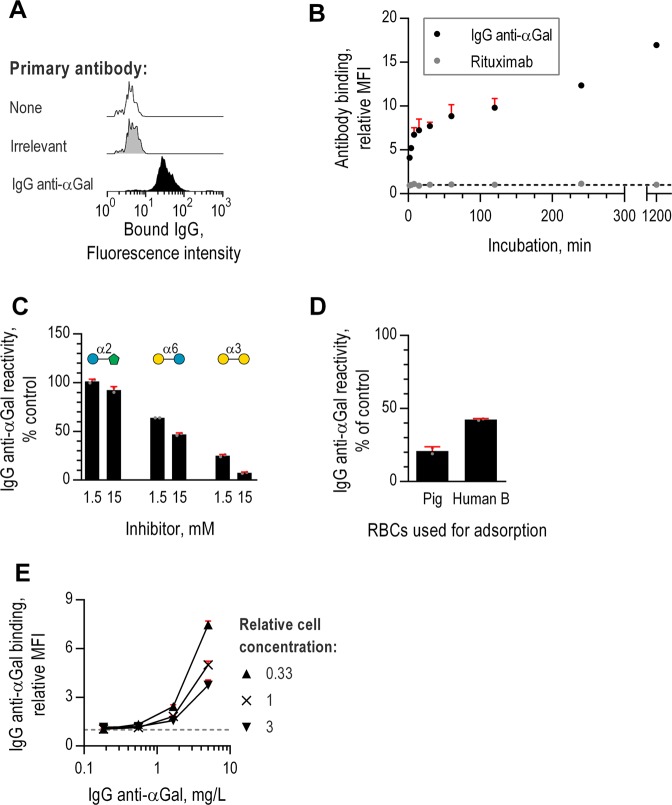
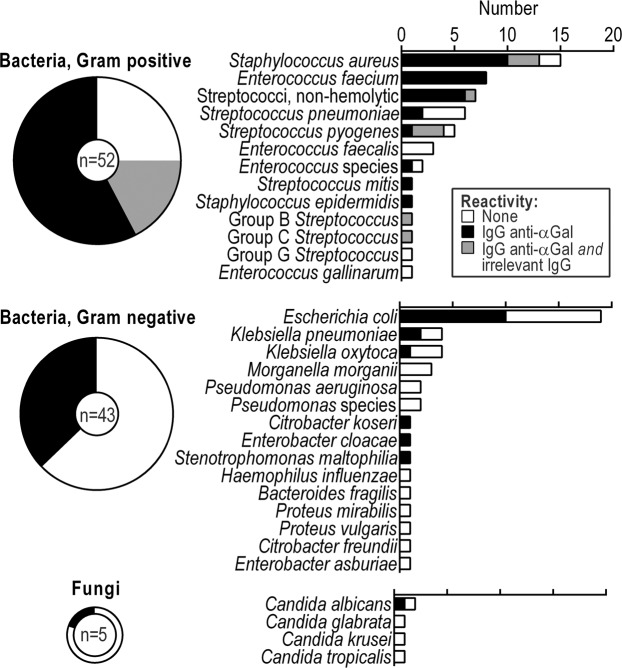
Antibodies of the IgG class to terminal Galα3Gal (IgG anti-αGal) is abundant in human plasma and are reported to bind most sepsis-causing Gram-negative bacteria. However, these seminal findings, made more than two decades ago, have not been reexamined. Our aim was to assess IgG anti-αGal´s pathogen reactivity. We affinity purified IgG anti-αGal from a therapeutic grade normal human IgG pool applying two rounds of positive selection with Galα3Gal-coupled beads and included removal of column matrix reactive antibodies. The purified antibodies were rigorously characterized in terms of specificity and purity in various solid-phase immunoassays. We used flow cytometry to study reactivity against 100 consecutive clinical isolates diagnosed as cause of sepsis in humans. We found that the purified IgG anti-αGal displays high specificity for Galα3Gal. Also, IgG anti-αGal at 5 mg/L bound 56 out of 100 pathogens with predilection for Gram-positive bacteria binding 39 out of 52 strains. We confirm that although IgG anti-αGal comprise a small fraction of the human antibody pool (~0.1%), these antibodies targets an impressively large part of pathogens causing invasive disease.
Conflict of interest statement
The authors declare no competing interests.
Figures
Similar articles
-
Complement activation by human IgG antibodies to galactose-α-1,3-galactose.Immunology. 2020 Sep;161(1):66-79. doi: 10.1111/imm.13229. Epub 2020 Jul 14. Immunology. 2020. PMID: 32583419 Free PMC article.
-
The isolation and characterization of human natural alphaGal-specific IgG antibodies applicable to the detection of alphaGal-glycosphingolipids.J Immunoassay Immunochem. 2005;26(2):145-56. doi: 10.1081/ias-200051999. J Immunoassay Immunochem. 2005. PMID: 15794123
-
Biological variation of anti-αGal-antibodies studied by a novel Time-Resolved ImmunoFluorometric Assay.J Immunol Methods. 2011 Oct 28;373(1-2):26-35. doi: 10.1016/j.jim.2011.07.017. Epub 2011 Jul 30. J Immunol Methods. 2011. PMID: 21835180
-
The human natural anti-αGal antibody targets common pathogens by broad-spectrum polyreactivity.Immunology. 2021 Apr;162(4):434-451. doi: 10.1111/imm.13297. Epub 2021 Jan 4. Immunology. 2021. PMID: 33340093 Free PMC article.
-
Characteristics of α-Gal epitope, anti-Gal antibody, α1,3 galactosyltransferase and its clinical exploitation (Review).Int J Mol Med. 2016 Jan;37(1):11-20. doi: 10.3892/ijmm.2015.2397. Epub 2015 Oct 30. Int J Mol Med. 2016. PMID: 26531137 Free PMC article. Review.
Cited by
-
Functional and Structural Characterization of a Potent C1q Inhibitor Targeting the Classical Pathway of the Complement System.Front Immunol. 2020 Jul 17;11:1504. doi: 10.3389/fimmu.2020.01504. eCollection 2020. Front Immunol. 2020. PMID: 32849513 Free PMC article.
-
Nanobodies Provide Insight into the Molecular Mechanisms of the Complement Cascade and Offer New Therapeutic Strategies.Biomolecules. 2021 Feb 17;11(2):298. doi: 10.3390/biom11020298. Biomolecules. 2021. PMID: 33671302 Free PMC article. Review.
-
Biosynthesis of α-Gal Epitopes (Galα1-3Galβ1-4GlcNAc-R) and Their Unique Potential in Future α-Gal Therapies.Front Mol Biosci. 2021 Nov 4;8:746883. doi: 10.3389/fmolb.2021.746883. eCollection 2021. Front Mol Biosci. 2021. PMID: 34805272 Free PMC article. Review.
-
Complement activation by human IgG antibodies to galactose-α-1,3-galactose.Immunology. 2020 Sep;161(1):66-79. doi: 10.1111/imm.13229. Epub 2020 Jul 14. Immunology. 2020. PMID: 32583419 Free PMC article.
-
The History of Carbohydrates in Type I Allergy.Front Immunol. 2020 Oct 9;11:586924. doi: 10.3389/fimmu.2020.586924. eCollection 2020. Front Immunol. 2020. PMID: 33163001 Free PMC article. Review.
References
-
- WHO. Antimicrobial resistance: global report on surveillance 2014 (2014).
-
- Yu PB, Holzknecht ZE, Bruno D, Parker W, Platt JL. Modulation of natural IgM binding and complement activation by natural IgG antibodies: a role for IgG anti-Gal alpha1-3Gal antibodies. J. Immunol. 1996;157:5163–5168. - PubMed
Publication types
MeSH terms
Substances
LinkOut - more resources
Full Text Sources
