Review
. 2020;216(2):21.
doi: 10.1007/s11214-020-00646-1. Epub 2020 Feb 24.

Ice Giant Circulation Patterns: Implications for Atmospheric Probes

Affiliations
Review

Ice Giant Circulation Patterns: Implications for Atmospheric Probes

Leigh N Fletcher et al. Space Sci Rev. 2020.

Abstract

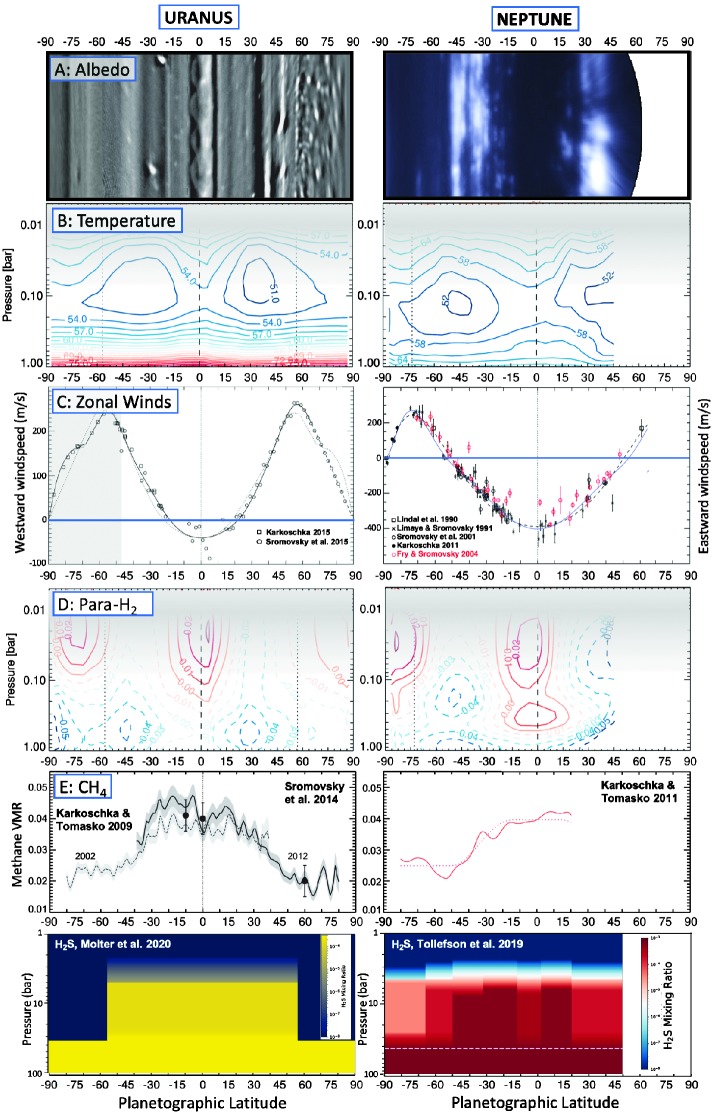
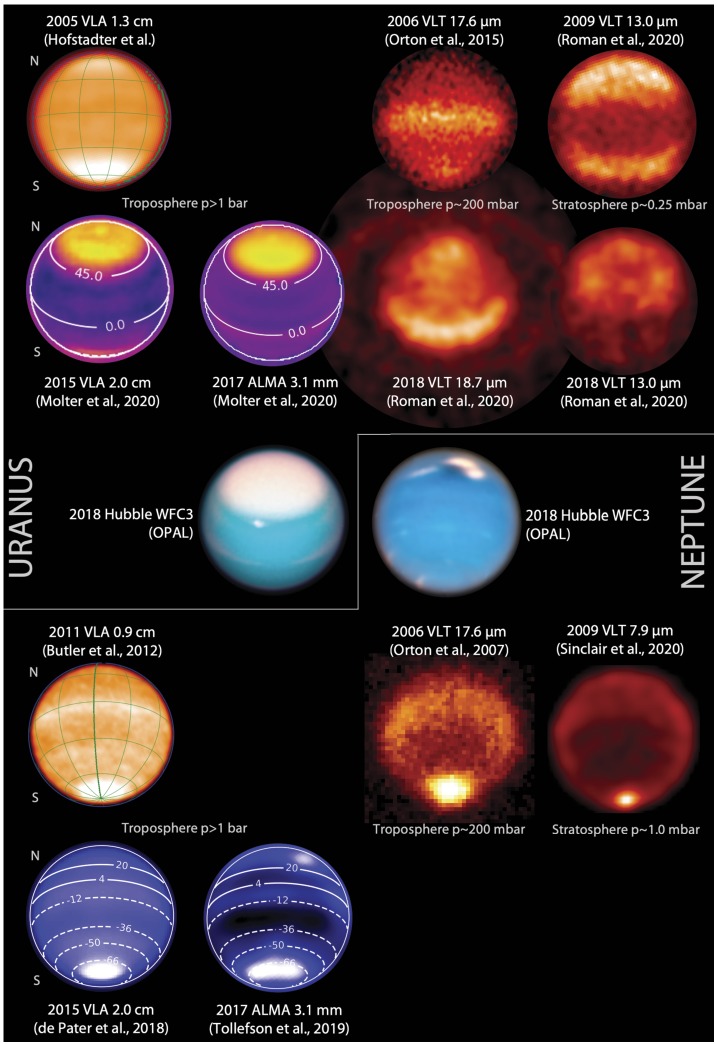
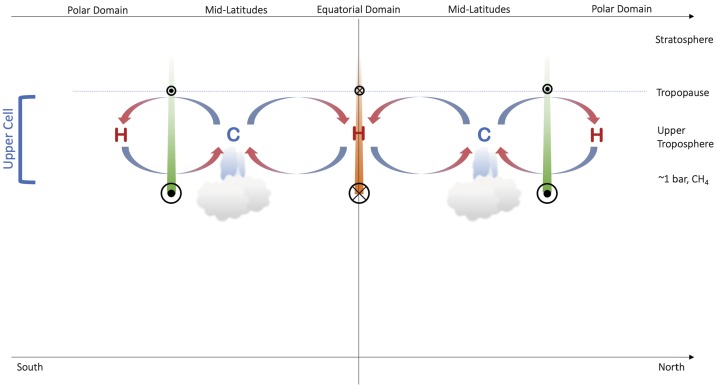
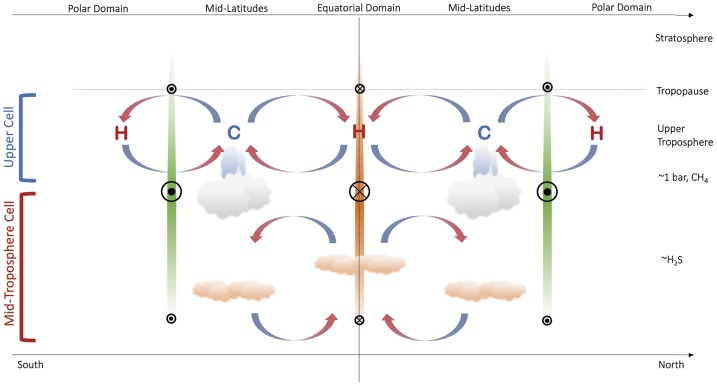
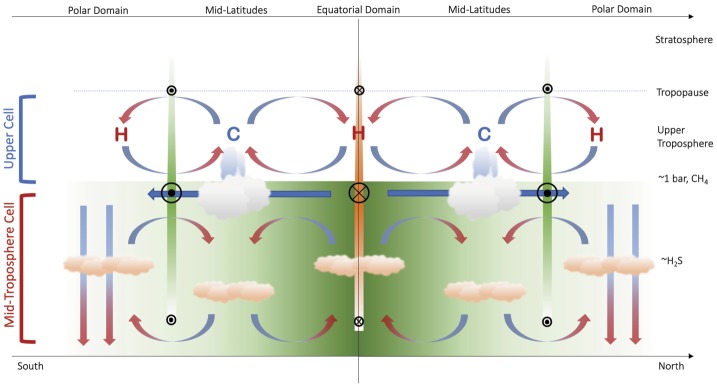
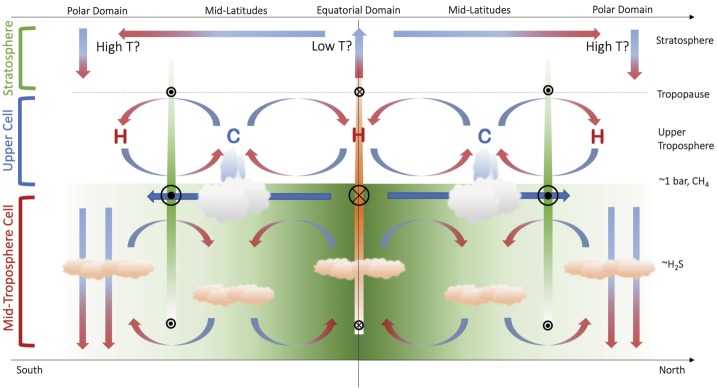
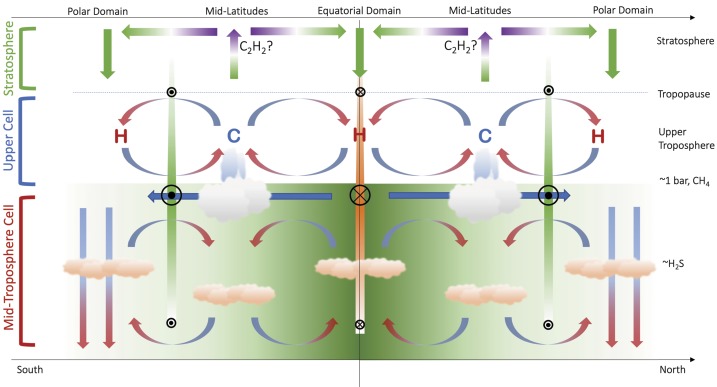
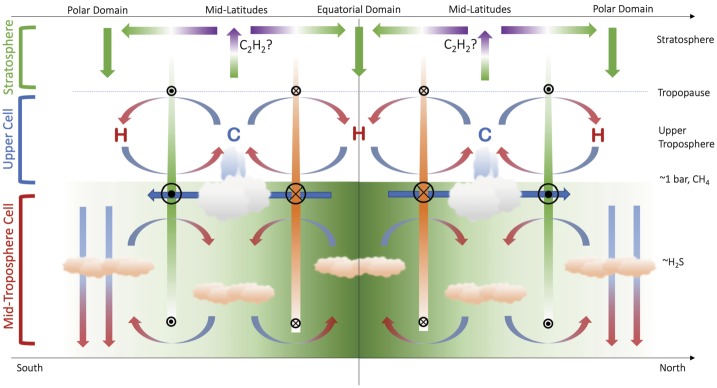
Atmospheric circulation patterns derived from multi-spectral remote sensing can serve as a guide for choosing a suitable entry location for a future in situ probe mission to the Ice Giants. Since the Voyager-2 flybys in the 1980s, three decades of observations from ground- and space-based observatories have generated a picture of Ice Giant circulation that is complex, perplexing, and altogether unlike that seen on the Gas Giants. This review seeks to reconcile the various competing circulation patterns from an observational perspective, accounting for spatially-resolved measurements of: zonal albedo contrasts and banded appearances; cloud-tracked zonal winds; temperature and para-H2 measurements above the condensate clouds; and equator-to-pole contrasts in condensable volatiles (methane, ammonia, and hydrogen sulphide) in the deeper troposphere. These observations identify three distinct latitude domains: an equatorial domain of deep upwelling and upper-tropospheric subsidence, potentially bounded by peaks in the retrograde zonal jet and analogous to Jovian cyclonic belts; a mid-latitude transitional domain of upper-tropospheric upwelling, vigorous cloud activity, analogous to Jovian anticyclonic zones; and a polar domain of strong subsidence, volatile depletion, and small-scale (and potentially seasonally-variable) convective activity. Taken together, the multi-wavelength observations suggest a tiered structure of stacked circulation cells (at least two in the troposphere and one in the stratosphere), potentially separated in the vertical by (i) strong molecular weight gradients associated with cloud condensation, and by (ii) transitions from a thermally-direct circulation regime at depth to a wave- and radiative-driven circulation regime at high altitude. The inferred circulation can be tested in the coming decade by 3D numerical simulations of the atmosphere, and by observations from future world-class facilities. The carrier spacecraft for any probe entry mission must ultimately carry a suite of remote-sensing instruments capable of fully constraining the atmospheric motions at the probe descent location.

Keywords: Atmospheres; Dynamics; Giant planets.


Figures

Fig. 1
Fig. 1
Collation of the key observables for the atmospheric circulation of Uranus (left) and Neptune (right). Row A shows examples of the albedo structures. For Uranus, we use a combination of Voyager-2 imagery poleward of 60S (Karkoschka 2015) and Keck H-band imagery in 2012 northward of 60S (Sromovsky et al. 2015). For Neptune, we use Keck H-band imagery from October 2003 (de Pater et al. 2014). Temperatures in row B were derived from Voyager/IRIS observations (Orton et al. ; Fletcher et al. 2014). Zonal winds in row C were derived from a variety of sources (only Voyager 2 in the grey region, Karkoschka 2015), and this row has been modified from (Sanchez-Lavega et al. 2019). The extent of disequilibrium for para-H2 in row D (sub-equilibrium in dotted lines indicating upwelling, super-equilibrium in solid lines indicating subsidence) were derived from Voyager/IRIS observations (Orton et al. ; Fletcher et al. 2014). Grey shading in B and D indicates that extrapolations of temperature and para-H2 for p<70 mbar (i.e., above the tropopause) are not constrained by the Voyager/IRIS data. The latitudinal distribution of methane in row E is from Karkoschka and Tomasko (2009), Sromovsky et al. (2014), Karkoschka and Tomasko (2011)—the dotted line for Neptune is an idealised form of the CH4 distribution. The deep distribution of H2S in row F is based upon a combination of VLA and ALMA observations of Uranus (Molter et al. 2020) and Neptune Tollefson et al. (2019). Figures have been modified from their original sources for ease of comparison
Fig. 2
Fig. 2
Montage of thermal emission observations of Uranus (top) and Neptune (bottom) that help characterise ice giant circulation. On the left, centimetre-wave observations from the VLA (Butler et al. ; de Pater et al. ; Molter et al. 2020) and millimetre-wave observations from ALMA (Tollefson et al. ; Molter et al. 2020) sense opacity variations in the deep troposphere. Fainted banded structure is visible on both planets, although maps were constructed from many hours of data, smearing features in longitude. On the right, 17–18 μm observations sense upper tropospheric temperatures (Orton et al. 2007b, 2015), whereas 7.9 and 13.0 μm sense stratospheric temperatures via methane and acetylene emission, respectively (Roman et al. ; Sinclair et al. 2020). Two sets of Uranus data are shown, one near equinox (top row) when both poles were visible, and one in 2015–18 (second row) when the north pole was in view. Hubble/WFC3 images of Uranus and Neptune in 2018 are shown in the centre for context, courtesy of the OPAL programme (https://archive.stsci.edu/prepds/opal/). All images have been oriented so that the north pole is at the top. On both planets, the dominant features at centimetre/millimetre wavelengths are the very bright poles, interpreted as regions of dry, subsiding air parcels at pressures greater than 1 bar. Note that Uranus’ large polar region extends to ±45, while Neptune’s extends only to 65S
Fig. 3
Fig. 3
Schematic depicting the meridional circulation in the upper tropospheres of Uranus and Neptune based on (i) tropospheric temperatures, denoted by ‘C’ and ‘H‘’ for cold and hot, respectively; (ii) the deviation of para-H2 from equilibrium; (iii) simplistic inferences of enhanced cloud activity at mid-latitudes; and (iv) the inferred decay of the winds with altitude. Retrograde winds are indicated by orange bars and circles with crosses; prograde winds are indicated by green bars with circles with dots. This circulation pattern is suggested to be present between the tropopause at 0.1 bar and the CH4 condensation level at p>1 bar
Fig. 4
Fig. 4
Modified schematic of the meridional circulation in the upper tropospheres of Uranus and Neptune (Fig. 3) to account for the observation that Neptune’s equatorial jet becomes more retrograde with altitude, potentially requiring the equator to be cooler than mid-latitudes (see main text). We have arbitrarily hypothesised the same trend in Uranus’ equatorial retrograde jet, and in the polar prograde jets on both planets, neither of which have been proven or dis-proven by the available data. Retrograde winds are indicated by orange bars and circles with crosses; prograde winds are indicated by green bars with circles with dots
Fig. 5
Fig. 5
Modified schematic of the meridional circulation, now extending from the upper troposphere into the mid-troposphere. Large-scale equator-to-pole transport, with rising motions at low latitudes (i.e., within 20–30 of the equator, consistent with the wind patterns inferred in Fig. 4) and strong polar subsidence, has been included to account for the latitudinal distributions of CH4 and H2S—the green equator-to-pole shading represents this gradient. Small-scale rising at high latitudes may explain the existence of polar clouds (Sromovsky et al. 2014) and excess H2S humidity at Neptune’s south pole (Irwin et al. 2019b), but this has to exist within a region of net subsidence to explain microwave observations. Here we see a tier of two stacked cells, potentially separated in the p1-bar region. The sense of the mid-tropospheric circulation near 1 bar, equatorward across the prograde jets, would be consistent with an (unproven) eddy-driven prograde jet, as is found on Jupiter and Saturn. The closure of the circulation at high pressures is arbitrary, but microwave observations suggest the polar subsidence persists to at least p50 bar
Fig. 6
Fig. 6
Modified schematic of the tropospheric circulation shown in Fig. 5, adding the large-scale equator-to-pole motions inferred in the stratospheres of Uranus and Neptune if we consider the observed brightness to be a result of latitudinal temperature variations (an alternative is shown in Fig. 7). Note that the suggested latitudes of stratospheric subsidence (poleward of ±25 on Uranus, poleward of 70S on Neptune) are different between the two worlds. At pressures exceeding 5 bar, the region of polar subsidence on Uranus is smaller than the stratospheric region, extending down to ±45, whereas on Neptune the stratospheric and deep tropospheric areas of subsidence poleward of 65S cover similar spatial areas
Fig. 7
Fig. 7
An alternative schematic for the stratospheric circulation following Roman et al. (2020), if we assume the observed brightness of Uranus is the result of latitudinal hydrocarbon variations rather than temperatures. In this case, the mid-latitude upwelling overshoots from the troposphere into the stratosphere, carrying CH4 aloft to be photolysed to C2H2, which is subsequently transported towards the equator and pole
Fig. 8
Fig. 8
Modified meridional circulation pattern in the troposphere and stratosphere (Fig. 7) to split the equatorial retrograde jet, moving its peak winds to be coincident with the locations of maximal thermal windshear. This is entirely hypothetical, but could explain contrasts in temperature, composition, and albedo observed by different authors. Furthermore, small-scale structure in the low-latitude zonal winds could indeed be present, but not yet identified in Voyager or Earth-based cloud-tracking observations

References

    1. Achterberg R.K., Conrath B.J., Gierasch P.J. Cassini CIRS retrievals of ammonia in Jupiter’s upper troposphere. Icarus. 2006;182:169–180. doi: 10.1016/j.icarus.2005.12.020. - DOI
    1. Andrews D.G., Holton J.R., Leovy C.B. Middle Atmosphere Dynamics. New York: Academic Press; 1987.
    1. Aplin K.L., Harrison R.G. Determining solar effects in Neptune’s atmosphere. Nat. Commun. 2016;7:11976. doi: 10.1038/ncomms11976. - DOI - PMC - PubMed
    1. Atreya S.K., Ponthieu J.J. Photolysis of methane and the ionosphere of Uranus. Planet. Space Sci. 1983;31:939–944. doi: 10.1016/0032-0633(83)90149-6. - DOI
    1. Atreya S.K., Romani P.N. Photochemistry and clouds of Jupiter. In: Hunt G.E., editor. Saturn and Uranus. 1985. pp. 17–68.

LinkOut - more resources