. 2019:282:10.1016/j.micromeso.2019.03.018.
doi: 10.1016/j.micromeso.2019.03.018.

An experimental and modelling study of water vapour adsorption on SBA-15

Affiliations

An experimental and modelling study of water vapour adsorption on SBA-15

Alessio Centineo et al. Microporous Mesoporous Mater. 2019.

Abstract

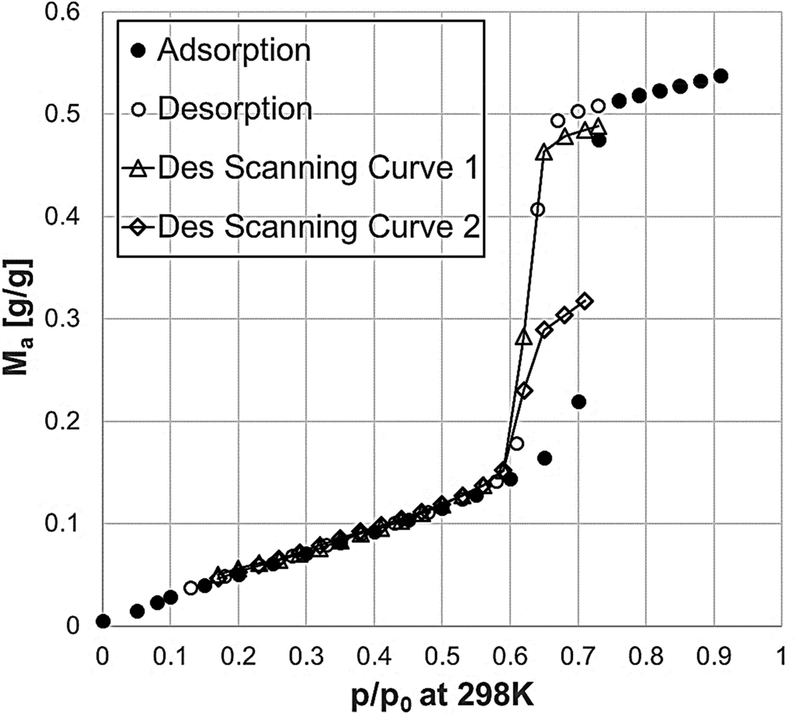
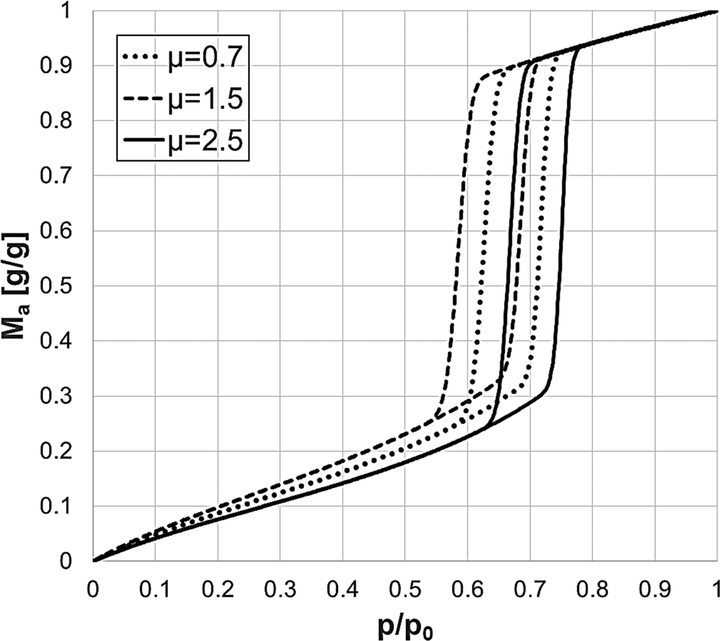
Many publications have been dedicated to the study of water vapour adsorption on the ordered silica-based material Santa Barbara Amorphous-15 (SBA-15). However, two aspects still need to be clarified: whether the solid is stable under repeated adsorption-desorption cycles and whether the experimental data can be predicted with a simple yet accurate analytical equilibrium model. In this study, SBA-15 showed good long-term structural stability when exposed to repeated adsorption-desorption cycles using water vapour as adsorptive up to 90 % relative humidity at 288 K, 298 K and 308 K. The reproducibility of the equilibrium isotherm was investigated using different commercial gravimetric instruments designed for water vapour adsorption measurements. The experimental measurements show a modification of the microporous structure of the solid after the first full isotherm measurement. Some water is strongly adsorbed and trapped during the first experiment on a fresh sample. After the first adsorption-desorption cycle, the water isotherm is characterized by a low value of the Henry law constant and by a nearly vertical capillary condensation and evaporation branches. Quite interestingly, the experimental scanning curves do not simply cross from one branch to the other as would be expected for cylindrical independent pores. The experimental data are correlated using new analytical models able to predict the amount adsorbed in the entire concentration range for the main adsorption-desorption branches and for the adsorption-desorption scanning curves.

Keywords: Equilibrium modelling; SBA-15 stability; Scanning curves; Water vapour adsorption.


Figures

Fig. A1.
Fig. A1.
Representation of the adsorbed layers on a cylindrical surface.
Fig. A2.
Fig. A2.
Comparison between the original BET model and the multilayer adsorption model on cylindrical surface given in Eq. (13).
Fig. A3.
Fig. A3.
Cylindrical meniscus of the multilayer adsorbed phase.
Fig. A4.
Fig. A4.
Hemispherical meniscus of the capillary condensed phase.
Fig. A5.
Fig. A5.
Representation of the adsorption-condensation mechanism when increasing the partial pressure of water vapour.
Fig. A6.
Fig. A6.
Representation of the desorption-evaporation mechanism when decreasing the partial pressure of water vapour.
Fig. 1.
Fig. 1.
Experimental uptake curves and relative humidity at 298 K. Sample dry mass 7.6 mg.
Fig. 2.
Fig. 2.
Adsorption-Desorption runs on SBA-15 fresh sample at 298 K. The continuous lines are only a guide for the eyes.
Fig. 3.
Fig. 3.
Adsorption-Desorption runs on SBA-15 fresh sample and replications on the same sample at 298 K. The continuous lines are only a guide for the eyes.
Fig. 4.
Fig. 4.
Adsorption-Desorption isotherm of Ar on SBA-15 fresh sample and used sample. The continuous lines are only a guide for the eyes.
Fig. 5.
Fig. 5.
Comparison between the fresh sample and the water-used sample. PSD and pore volume of SBA-15 from argon adsorption-desorption at 87 K.
Fig. 6.
Fig. 6.
Comparison between the fresh sample and the water-used sample. PSD of the microporous region.
Fig. 7.
Fig. 7.
Adsorption-Desorption runs on SBA-15 fresh sample at 308 K. The continuous lines are only a guide for the eyes.
Fig. 8.
Fig. 8.
Stability test for water vapour adsorption on SBA-15 at 308 K. The repeat run was performed after 2 months and five adsorption-desorption cycles.
Fig. 9.
Fig. 9.
Experimental desorption scanning curves for water vapour adsorption on SBA-15 at 298 K. The continuous lines are only a guide for the eyes.
Fig. 10.
Fig. 10.
Experimental adsorption scanning curves for water vapour adsorption on SBA-15 at 298 K. The continuous lines are only a guide for the eyes.
Fig. 11.
Fig. 11.
Correlation of the experimental data with the BET model [17] for different concentration ranges.
Fig. 12 –
Fig. 12 –
Correlation of the experimental data with the model of Rajniak et al. [41] for different concentration ranges.
Fig. 13.
Fig. 13.
Correlation of the experimental data with the model of Moore et al. [44] for different concentration ranges.
Fig. 14.
Fig. 14.
Correlation of the experimental data with the model of Liu et al. [36] for different concentration ranges.
Fig. 15.
Fig. 15.
Effect of the parameter J on the shape of the equilibrium isotherm model.
Fig. 16.
Fig. 16.
Effect of the first layer thickness d (nm) on the shape of the equilibrium isotherm model.
Fig. 17.
Fig. 17.
Effect of the BET equilibrium constant C on the shape of the equilibrium isotherm model.
Fig. 18.
Fig. 18.
Effect of the desorption angle θ on the shape of the equilibrium isotherm model.
Fig. 19.
Fig. 19.
Effect of the PSD dispersion σ on the shape of the equilibrium isotherm model.
Fig. 20.
Fig. 20.
Effect of the PSD mean value μ on the shape of the equilibrium isotherm model.
Fig. 21.
Fig. 21.
Effect of the parameter κ on the shape of the equilibrium isotherm model.
Fig. 22.
Fig. 22.
Experimental adsorption-desorption runs and model correlation at 288 K, 298 K, and 308 K.
Fig. 23.
Fig. 23.
Experimental desorption scanning curves and perfectly cylindrical pores model correlation at 298 K
Fig. 24.
Fig. 24.
Experimental adsorption scanning curves and perfectly cylindrical pores model correlation at 308 K.
Fig. 25.
Fig. 25.
Qualitative representation of the sub-pores inside each main pore of the SBA-15.
Fig. 26.
Fig. 26.
Desorption scanning curve and non-perfectly cylindrical pores model correlation at 298 K.
Fig. 27.
Fig. 27.
Adsorption scanning curves and non-perfectly cylindrical pores model correlation at 298 K.

References

    1. Zhao G, Zhao Z, Wu J, Ye D, Synthesis of hydrophobic mesoporous material MFS and its adsorption properties of water vapor, J. Spectrosc 2014 (2014). doi:10.1155/2014/965037. - DOI
    1. Chaudhary V, Sharma S, An overview of ordered mesoporous material SBA-15: synthesis, functionalization and application in oxidation reactions, J. Porous Mater 24 (2017) 741–749. doi:10.1007/s10934-016-0311-z. - DOI
    1. Rahmat N, Abdullah AZ, Mohamed AR, A review: Mesoporous Santa Barbara amorphous-15, types, synthesis and its applications towards biorefinery production, Am. J. Appl. Sci 7 (2010) 1579–1586. doi:10.3844/ajassp.2010.1579.1586. - DOI
    1. Yanagisawa T, Shimizu T, Kuroda K, Kato C, The preparation of alkyltrimethylammonium-kanemite complexes and their conversion to microporous materials, Bull. Chem. Soc. Jpn 63 (1990) 988–992. doi:10.1246/bcsj.63.988. - DOI
    1. Ferdousi M, Pazouki M, Hessari FA, Kazemzad M, Simultaneous control of rod length and pore diameter of SBA-15 for PPL loading, J. Porous Mater 23 (2016) 453–463. doi:10.1007/s10934-015-0099-2. - DOI

LinkOut - more resources