. 2018 Aug 20:2:2398212818794820.
doi: 10.1177/2398212818794820. eCollection 2018 Jan-Dec.

Hyperglycaemia does not increase perfusion deficits after focal cerebral ischaemia in male Wistar rats

Affiliations

Hyperglycaemia does not increase perfusion deficits after focal cerebral ischaemia in male Wistar rats

Lisa A Thow et al. Brain Neurosci Adv. .

Abstract

Background: Hyperglycaemia is associated with a worse outcome in acute ischaemic stroke patients; yet the pathophysiological mechanisms of hyperglycaemia-induced damage are poorly understood. We hypothesised that hyperglycaemia at the time of stroke onset exacerbates ischaemic brain damage by increasing the severity of the blood flow deficit.

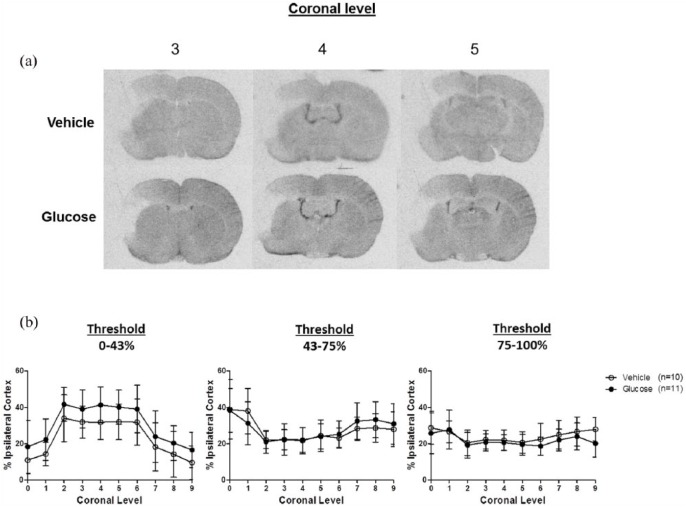
Methods: Adult, male Wistar rats were randomly assigned to receive vehicle or glucose solutions prior to permanent middle cerebral artery occlusion. Cerebral blood flow was assessed semi-quantitatively either 1 h after middle cerebral artery occlusion using 99mTc-D, L-hexamethylpropyleneamine oxime (99mTc-HMPAO) autoradiography or, in a separate study, using quantitative pseudo-continuous arterial spin labelling for 4 h after middle cerebral artery occlusion. Diffusion weighted imaging was performed alongside pseudo-continuous arterial spin labelling and acute lesion volumes calculated from apparent diffusion coefficient maps. Infarct volume was measured at 24 h using rapid acquisition with refocused echoes T2-weighted magnetic resonance imaging.

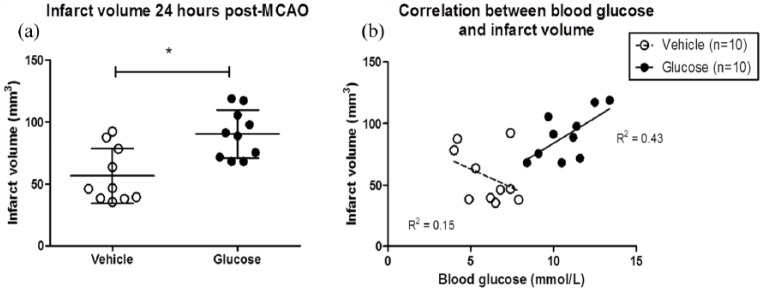
Results: Glucose administration had no effect on the severity of ischaemia when assessed by either 99mTc-HMPAO autoradiography or pseudo-continuous arterial spin labelling perfusion imaging. In comparison to the vehicle group, apparent diffusion coefficient-derived lesion volume 2-4 h post-middle cerebral artery occlusion and infarct volume 24 h post-middle cerebral artery occlusion were significantly greater in the glucose group.

Conclusions: Hyperglycaemia increased acute lesion and infarct volumes but there was no evidence that the acute blood flow deficit was exacerbated. The data reinforce the conclusion that the detrimental effects of hyperglycaemia are rapid, and that treatment of post-stroke hyperglycaemia in the acute period is essential but the mechanisms of hyperglycaemia-induced harm remain unclear.

Keywords: Cerebral blood flow; animal model; focal ischaemia; hyperglycaemia; magnetic resonance imaging.


Conflict of interest statement

Declaration of conflicting interests: The author(s) declared no potential conflicts of interest with respect to the research, authorship and/or publication of this article.

Figures

Figure 1.
Figure 1.
Representative autoradiograms depicting threshold analysis of 99mTc-HMPAO uptake. The cortex ipsilateral to MCAO (outlined in green) and contralateral cortex (outlined in red) was manually delineated (top left). The pale region in the ipsilateral cortex represents an area with reduced uptake of 99mTc-HMPAO indicating reduced CBF induced by MCAO in the cerebral cortex. In subsequent images, the green pixels represent the area of the ipsilateral cortex where 99mTc-HMPAO uptake was within 0%–43%, 43%–75% and 75%–100% of the contralateral cortex.
Figure 2.
Figure 2.
Autoradiograms showing 99mTc-HMPAO concentration in coronal levels 3, 4 and 5, at 1 h post-MCAO from a representative vehicle and glucose-treated rat (a). Ischaemia is visible topographically within the ipsilateral cortex in both groups to a similar extent. Line graphs illustrating the % area of the ipsilateral cortex, across 10 coronal levels (rostral to caudal), with CBF that is severely (0%–43%), moderately (43%–75%) and mildly (75%–100%) reduced relative to the contralateral cortex (b). Data are presented as mean ± standard deviation. Differences between groups are not statistically significant: two-way ANOVA.
Figure 3.
Figure 3.
Quantitative CBF maps displaying hypoperfused tissue at 1 and 4 h post-MCAO over six coronal slices (a). The darker regions represent areas with reduced blood flow and these were predominantly in the ipsilateral cortex, as a result of distal MCAO. Temporal evolution of the perfusion deficit 1–4 h after MCAO (b). The perfusion deficit volume was calculated by applying an abnormal perfusion threshold of 30 mL/100 g/min to CBF maps. Data are presented as mean ± standard deviation. Differences between groups are not statistically significant: repeated measures two-way ANOVA with Bonferroni’s post-test.
Figure 4.
Figure 4.
Apparent diffusion coefficient (ADC) lesions at 1 h (white areas) and 4 h (red areas) post-MCAO across the equivalent six coronal slices (a). The images are from the median animal of the vehicle and glucose treatment groups. ADC-derived lesion volume measured 1–4 h after MCAO (b). ADC lesion volume was calculated by applying an abnormal diffusion threshold of 0.53 × 10−3 mm2/s. Data are presented as mean ± standard deviation. *P < 0.05 compared with vehicle rats using a repeated measures two-way ANOVA with Bonferroni’s post-test.
Figure 5.
Figure 5.
Scatter plot showing the T2-derived infarct volumes measured 24 h after MCAO in each rat (a). The horizontal line on the scatter plot represents the mean. *P < 0.05 compared with vehicle group using a Student’s unpaired t-test. A Pearson’s correlation was performed between the T2-derived infarct volume and blood glucose levels measured at 4 h post-MCAO in the vehicle and glucose groups (b). There was a significant, positive correlation between T2-derived infarct volume and blood glucose levels in rats that received glucose (R2 = 0.43, P = 0.04) but not vehicle (R2 = 0.15, P = 0.3).
Figure 6.
Figure 6.
Spatial distributions of perfusion–diffusion mismatch tissue across six coronal slices (caudal to rostral) at 1 and 4 h after MCAO (a). The images displayed are from the median animal of each group. The red region depicts the perfusion deficit defined by applying an absolute threshold of 30 mL/100 g/min. The white region depicts the ADC lesion defined by applying an ADC threshold of 0.53 × 10−3 mm2/s. On slices where there was a perfusion deficit but no ADC lesion the perfusion deficit area was considered as mismatch tissue. Perfusion–diffusion mismatch volumes 1–4 h post-MCAO (b). There was no statistical difference between vehicle- and glucose-treated groups by repeated measures two-way ANOVA.

Similar articles

Cited by

References

    1. Anderson RE, Tan WK, Martin HS, et al. (1999) Effects of glucose and PaO2 modulation on cortical intracellular acidosis, NADH redox state, and infarction in the ischemic penumbra. Stroke 30(1): 160–170. - PubMed
    1. Bartus RT, Dean RL, Cavanaugh K, et al. (1995) Time-related neuronal changes following middle cerebral artery occlusion: Implications for therapeutic intervention and the role of calpain. Journal of Cerebral Blood Flow & Metabolism 15(6): 969–979. - PubMed
    1. Baskerville TA, McCabe C, Weir CJ, et al. (2012) Noninvasive MRI measurement of CBF: Evaluating an arterial spin labelling sequence with 99mTc-HMPAO CBF autoradiography in a rat stroke model. Journal of Cerebral Blood Flow & Metabolism 32(6): 973–977. - PMC - PubMed
    1. Bevers MB, Vaishnav NH, Pham L, et al. (2016) Hyperglycemia is associated with more severe cytotoxic injury after stroke. Journal of Cerebral Blood Flow & Metabolism 37(7): 2577–2583. - PMC - PubMed
    1. Campbell BC, Macrae IM. (2015) Translational perspectives on perfusion-diffusion mismatch in ischemic stroke. International Journal of Stroke 10(2): 163–162. - PubMed

LinkOut - more resources