

Mortality Risk Profiles for Sepsis: A Novel Longitudinal and Multivariable Approach
- PMID: 32166273
- PMCID: PMC7063956
- DOI: 10.1097/CCE.0000000000000032
Mortality Risk Profiles for Sepsis: A Novel Longitudinal and Multivariable Approach
Abstract
To determine if a set of time-varying biological indicators can be used to: 1) predict the sepsis mortality risk over time and 2) generate mortality risk profiles.
Design: Prospective observational study.
Setting: Nine Canadian ICUs.
Subjects: Three-hundred fifty-six septic patients.
Interventions: None.
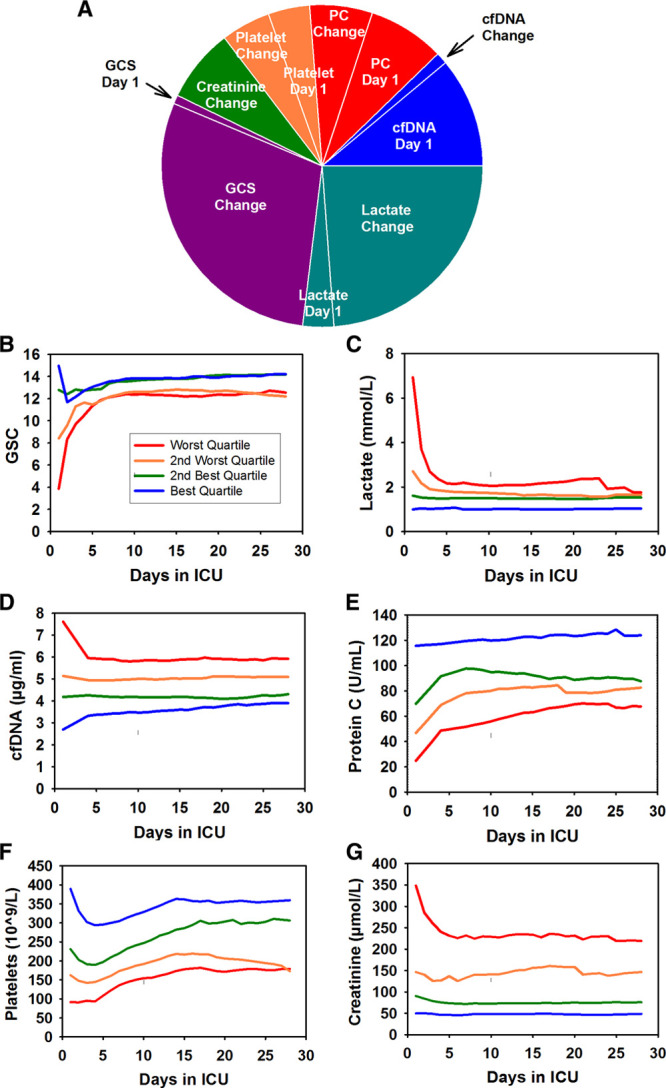
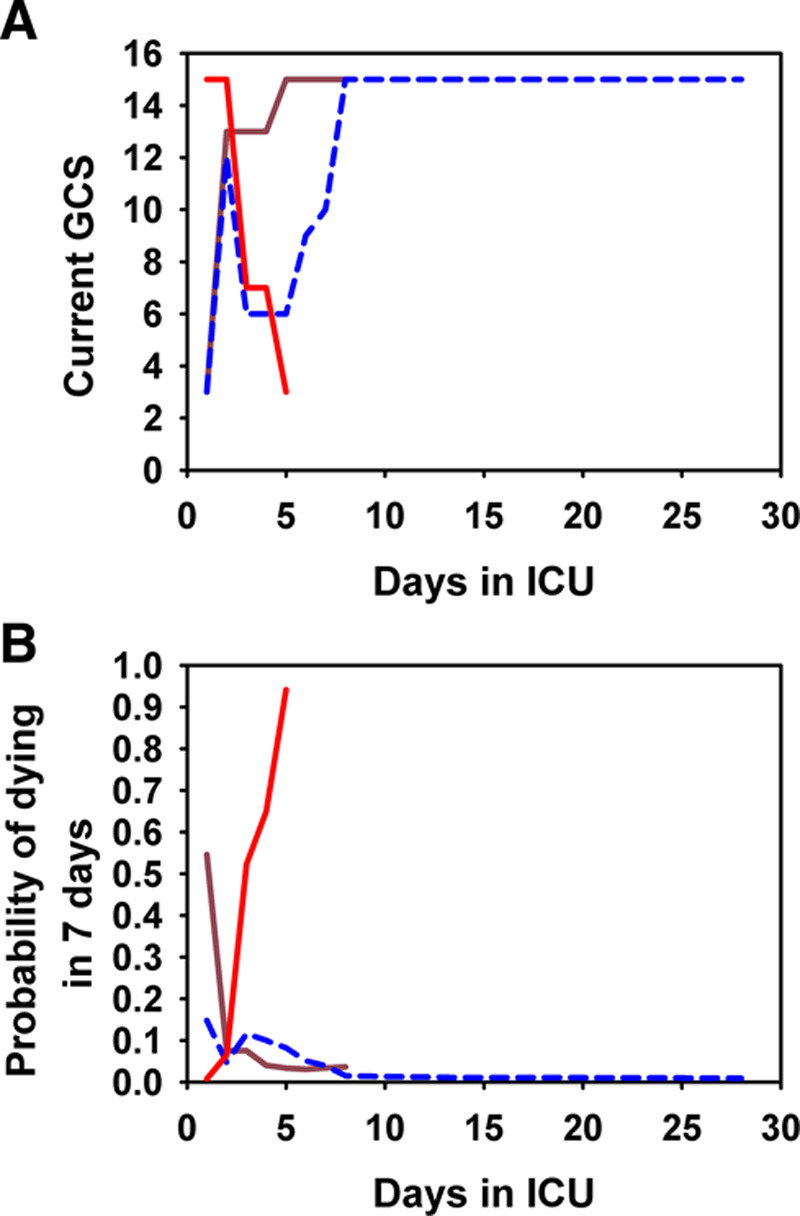
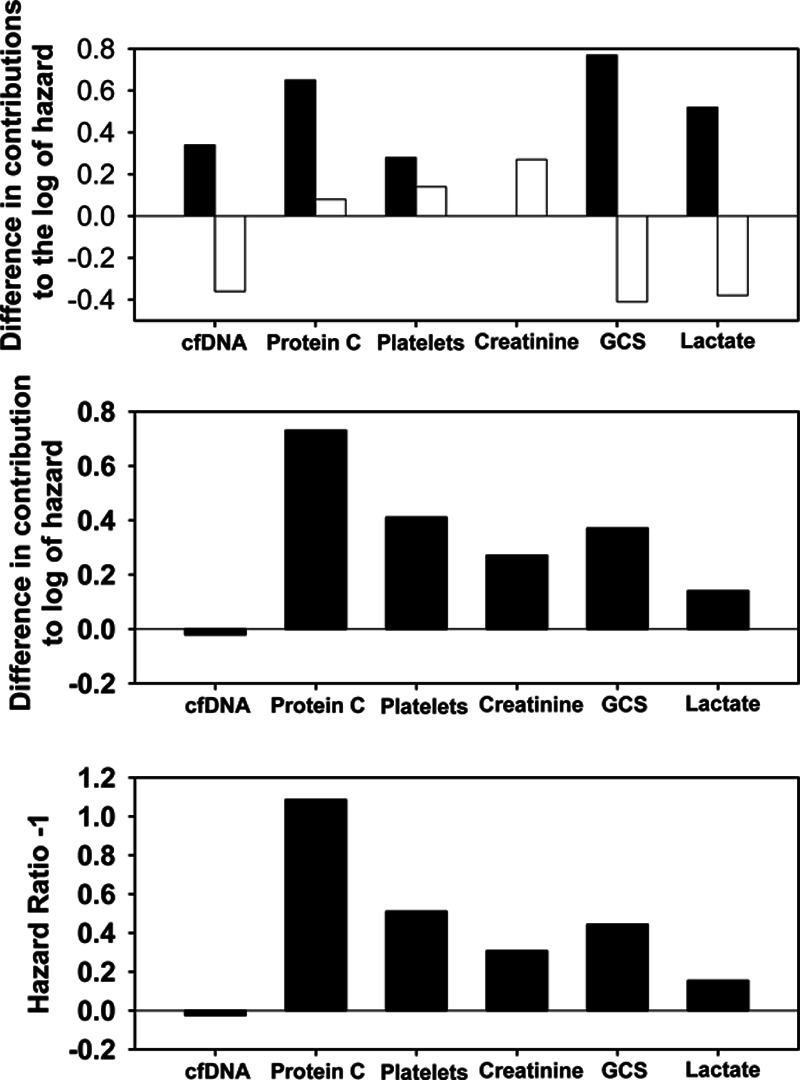
Measurements and main results: Clinical data and plasma levels of biomarkers were collected longitudinally. We used a complementary log-log model to account for the daily mortality risk of each patient until death in ICU/hospital, discharge, or 28 days after admission. The model, which is a versatile version of the Cox model for gaining longitudinal insights, created a composite indicator (the daily hazard of dying) from the "day 1" and "change" variables of six time-varying biological indicators (cell-free DNA, protein C, platelet count, creatinine, Glasgow Coma Scale score, and lactate) and a set of contextual variables (age, presence of chronic lung disease or previous brain injury, and duration of stay), achieving a high predictive power (conventional area under the curve, 0.90; 95% CI, 0.86-0.94). Including change variables avoided misleading inferences about the effects of day 1 variables, signifying the importance of the longitudinal approach. We then generated mortality risk profiles that highlight the relative contributions among the time-varying biological indicators to overall mortality risk. The tool was validated in 28 nonseptic patients from the same ICUs who became septic later and was subject to 10-fold cross-validation, achieving similarly high area under the curve.
Conclusions: Using a novel version of the Cox model, we created a prognostic tool for septic patients that yields not only a predicted probability of dying but also a mortality risk profile that reveals how six time-varying biological indicators differentially and longitudinally account for the patient's overall daily mortality risk.
Keywords: biomarkers; longitudinal analysis; mortality; mortality risk profiles; sepsis.
Copyright © 2019 The Authors. Published by Wolters Kluwer Health, Inc. on behalf of the Society of Critical Care Medicine.
Conflict of interest statement
Drs. Liaw, Dwivedi, and Medeiros received support for article research from the Canadian Institutes of Health Research (CIHR). Drs. Liaw and Medeiros disclosed government work. Dr. Fox-Robichaud’s institution received funding from CIHR, CIHR/Natural Sciences and Engineering Research Council of Canada, and Hamilton Academic Hospital Fund. Dr. Dodek’s institution received funding from McMaster University. Dr. Winston received grant support from the Alberta Lung Association and the Canadian Intensive Care Foundation. Dr. Lellouche received compensation for patient inclusions in the study, and he disclosed he is a co-founder, administrator, and consultant of Oxynov, R&D company. Dr. Marshall received patient recruitment fees per CIHR grant, and he received funding from Data Monitoring Committee, Asahi Kasei Pharmaceuticals and Baxter. The remaining authors have disclosed that they do not have any potential conflicts of interest.
Figures
References
-
- Vincent JL, Marshall JC, Namendys-Silva SA, et al. ; ICON investigators Assessment of the worldwide burden of critical illness: The Intensive Care Over Nations (ICON) audit. Lancet Respir Med 20142380–386 - PubMed
-
- Fleischmann C, Scherag A, Adhikari NK, et al. ; International Forum of Acute Care Trialists Assessment of global incidence and mortality of hospital-treated sepsis. Current estimates and limitations. Am J Respir Crit Care Med 2016193259–272 - PubMed
-
- Torio CM, Andrews RM. National Inpatient Hospital Costs: The Most Expensive Conditions by Payer, 2011: Statistical Brief #160 2006Rockville, MD: Agency for Healthcare Research and Quality - PubMed
LinkOut - more resources
Full Text Sources
