. 2020 May;23(5):831-840.
doi: 10.1111/ele.13487. Epub 2020 Mar 12.

Predation risk shapes the degree of placentation in natural populations of live-bearing fish

Affiliations

Predation risk shapes the degree of placentation in natural populations of live-bearing fish

Andres Hagmayer et al. Ecol Lett. 2020 May.

Abstract

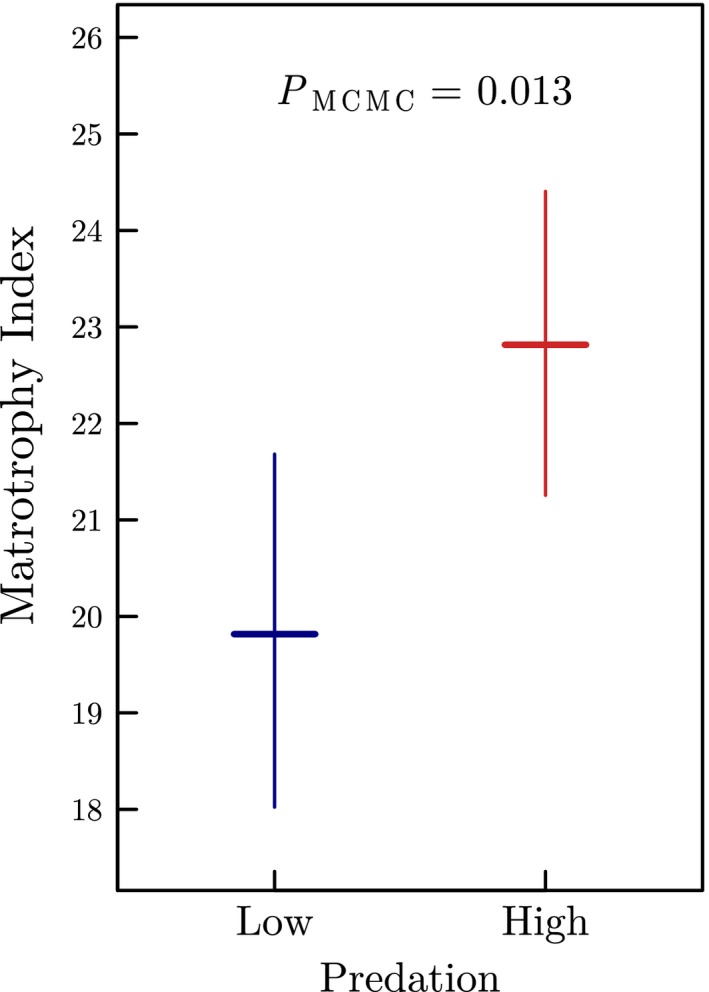
The placenta is a complex life-history trait that is ubiquitous across the tree of life. Theory proposes that the placenta evolves in response to high performance-demanding conditions by shifting maternal investment from pre- to post-fertilisation, thereby reducing a female's reproductive burden during pregnancy. We test this hypothesis by studying populations of the fish species Poeciliopsis retropinna in Costa Rica. We found substantial variation in the degree of placentation among natural populations associated with predation risk: females from high predation populations had significantly higher degrees of placentation compared to low predation females, while number, size and quality of offspring at birth remained unaffected. Moreover, a higher degree of placentation correlated with a lower reproductive burden and hence likely an improved swimming performance during pregnancy. Our study advances an adaptive explanation for why the placenta evolves by arguing that an increased degree of placentation offers a selective advantage in high predation environments.

Keywords: Life-history; Poeciliidae; Trexler-DeAngelis; live-bearing; matrotrophy; placenta; placentotrophy; predation; superfetation; viviparity.


Figures

Figure 1
Figure 1
The degree of placentation in Poeciliopsis retropinna populations, expressed as the Matrotrophy Index (MI ± 95% posterior density CI), in relation to high and low predation risk (piscivorous predator species present or absent, respectively). The MI is predicted for a female of overall average standard length and proportion of body fat (i.e. body fat = 0.16, standard length = 53 mm). The posterior Bayesian P‐value (P MCMC) is given at the top.
Figure 2
Figure 2
Life‐history characteristics of Poeciliopsis retropinna in relation to predation risk. (a) Egg dry mass at fertilisation (developmental stage 2), (b) Offspring dry mass at birth (developmental stage 45), (c) Proportion egg fat at fertilisation, (d) Proportion offspring fat at birth, (e) dry reproductive allotment, (f) brood size, (g) maternal fecundity (number embryos in all broods combined), and (h) degree of superfetation (± 95% CI) as a function of high and low predation risk (piscivorous predator species present or absent; left panels) and predator community (G: Gobiomorus maculatus; E: Eleotris picta; P: Parachromis dovii; right panels) estimated in the models described in Table S2–S9, S22–S29. Except in (e), all model predictions account for the proportion of maternal body fat and maternal standard length, which are kept constant at the overall population mean (i.e. body fat = 0.16, standard length = 53 mm). In (e) and (g–h), the developmental stage of the most‐developed brood carried by the female is kept constant at the overall median (i.e. developmental stage 42.5). Data points (red: high predation; blue: low predation) correspond to the ‘jittered’ raw data. Sample size and P‐value are given at the top of each panel. Significant codes: P < 0.001***, < 0.01**, ≤ 0.05*, > 0.05 n.s.
Figure 3
Figure 3
(a) Graphical illustration of the relationships between predation, egg dry mass at fertilisation (i.e. developmental stage 2), offspring dry mass at birth (i.e. developmental stage 45), brood size, fecundity, superfetation, and absolute dry reproductive allotment. The direction of the arrows represents the directionality of the relationships. The numbers equal standardised partial regression coefficients (i.e. the strength of the relationships), which take values between −1 and 1. Grey arrows represent the covariances between the residuals of the responses measured on the same observational unit. (b) Standardised effect size of predation on the reproductive allotment mediated through the maternal life‐history traits (± 95% CI). These values equal the contribution of each of the maternal life‐history traits to differences in the reproductive allotment among predation regimes. The paths via superfetation and brood size are summed together, as both are mediated via fecundity. Note that (a) and (b) show that the total effect of predation on the reduction of reproductive allotment is mainly mediated through egg mass at fertilisation.

References

    1. Arnold, S.J. , Pfrender, M.E. & Jones, A.G. (2001). The adaptive landscape as a conceptual bridge between micro‐ and macroevolution. Genetica, 112–113, 9–32. - PubMed
    1. Banet, A.I. & Reznick, D.N. (2008). Do placental species abort offspring? Testing an assumption of the Trexler‐DeAngelis model. Functional Ecology, 22, 323–331.
    1. Banet, A.I. , Au, A.G. & Reznick, D.N. (2010). Is mom in charge? Implications of resource provisioning on the evolution of the placenta. Evolution, 64, 3172–3182. - PubMed
    1. Bashey, F. (2006). Cross‐generational environmental effects and the evolution of offspring size in the Trinidadian Guppy Poecilia reticulata . Evolution, 60, 348–361. - PubMed
    1. Basolo, A.L. & Wagner, W.E. (2004). Covariation between predation risk, body size and fin elaboration in the green swordtail, Xiphophorus helleri . Biol. J. Linn. Soc., 83, 87–100.