. 2020 May;34(5):6166-6184.
doi: 10.1096/fj.201901920R. Epub 2020 Mar 13.

Flow-regulated endothelial glycocalyx determines metastatic cancer cell activity

Affiliations

Flow-regulated endothelial glycocalyx determines metastatic cancer cell activity

Solomon A Mensah et al. FASEB J. 2020 May.

Abstract

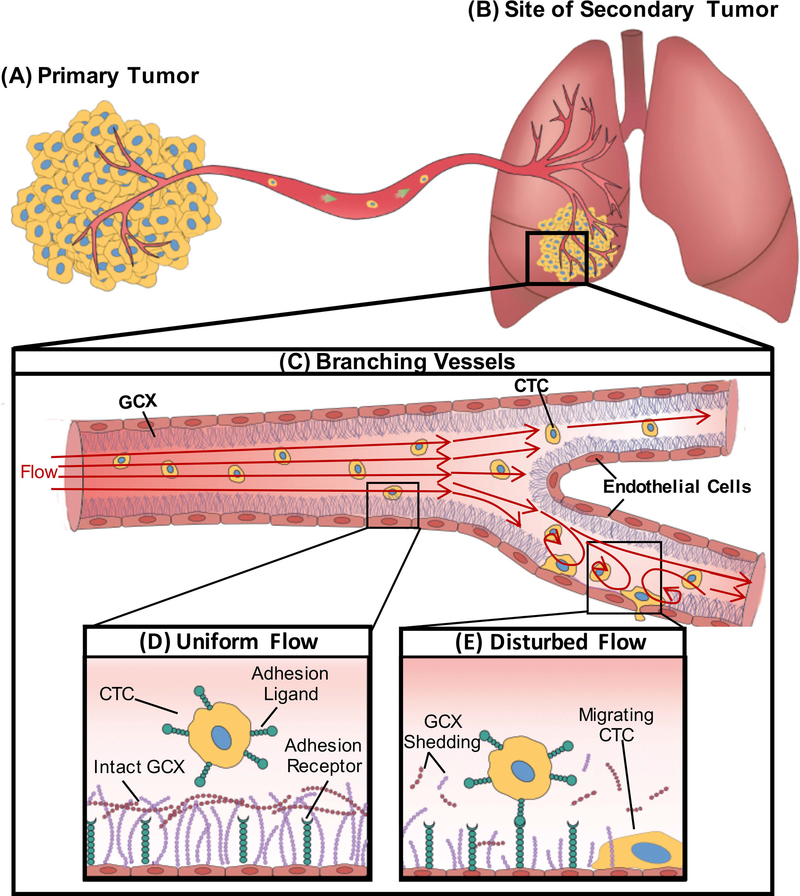
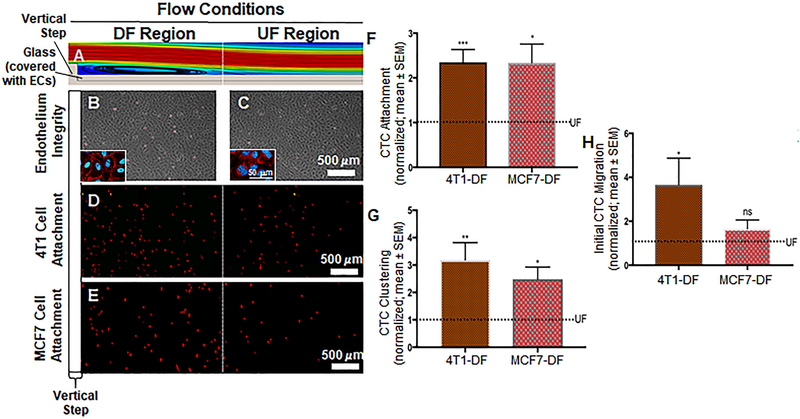
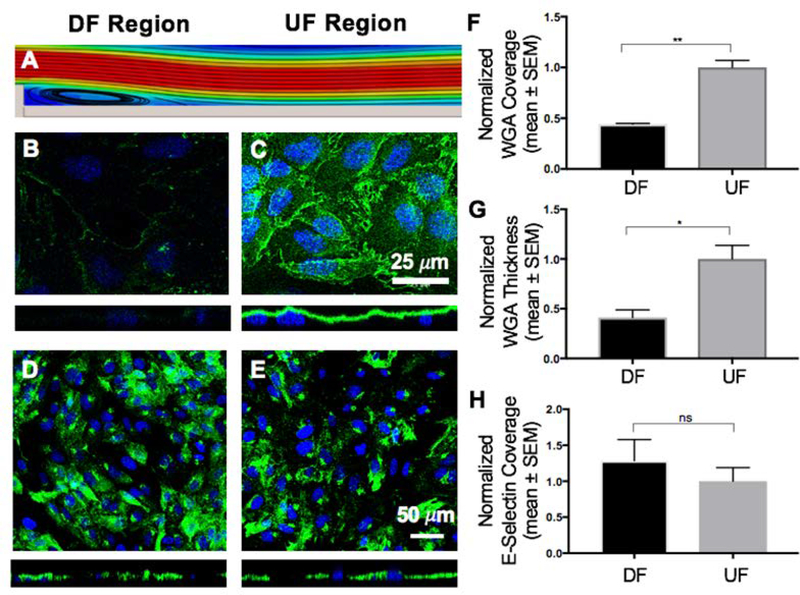
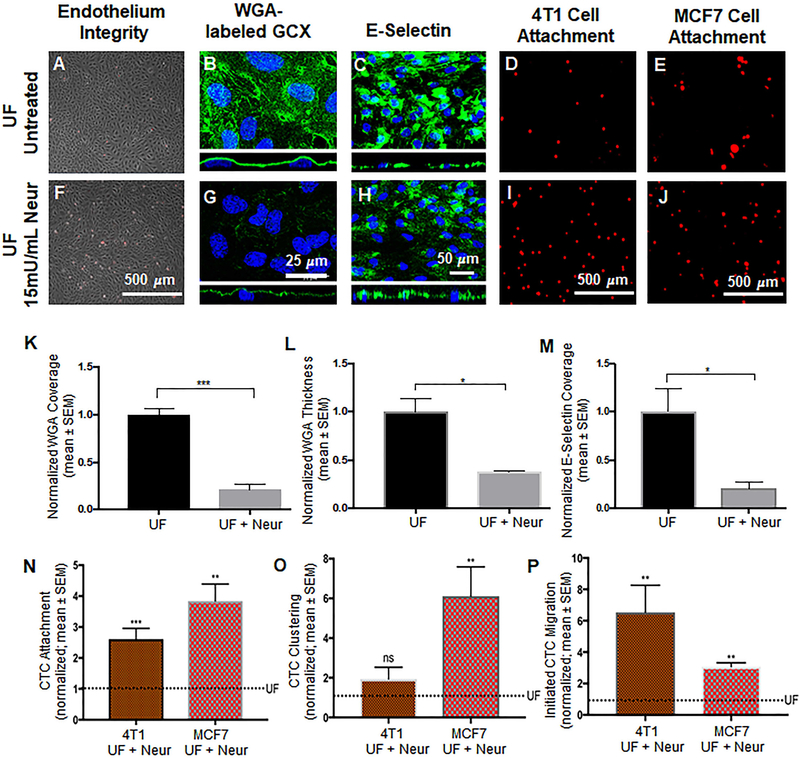
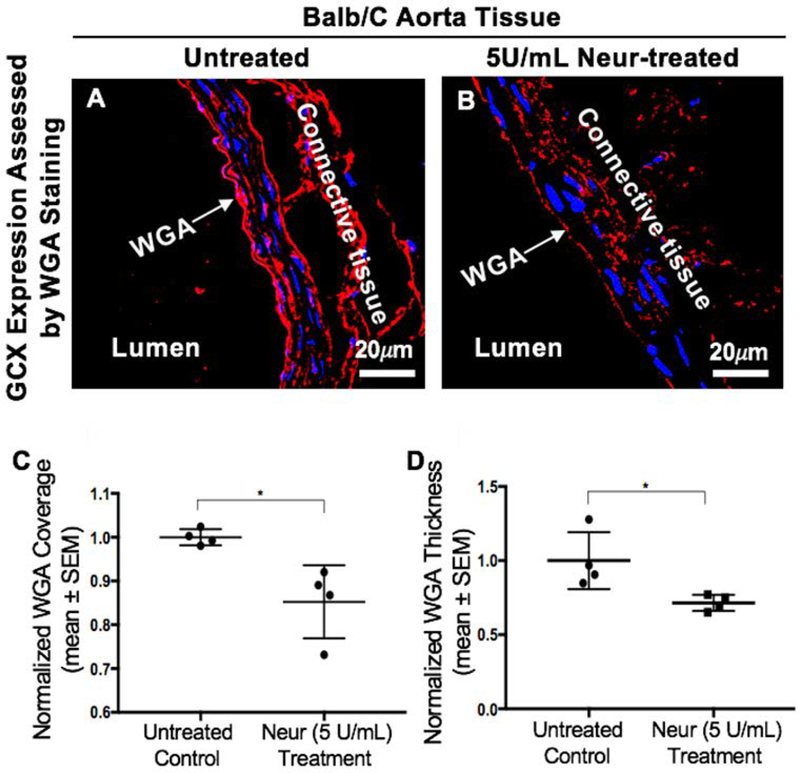
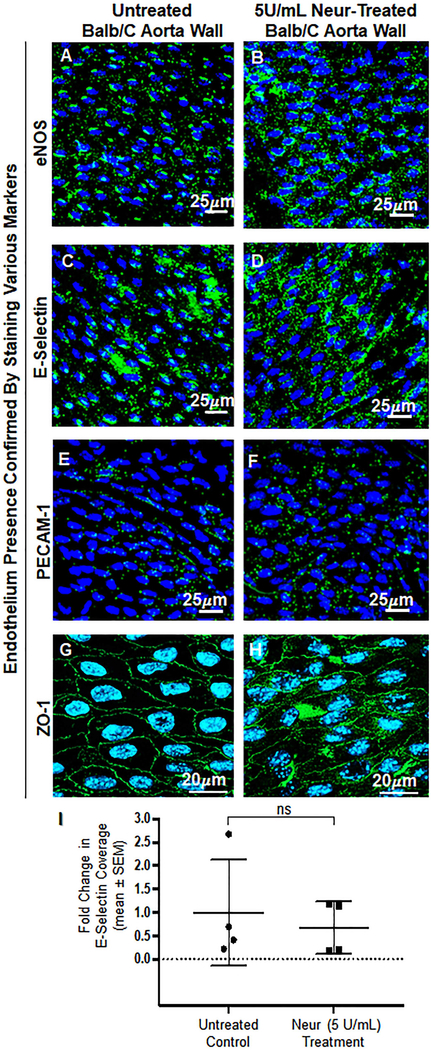
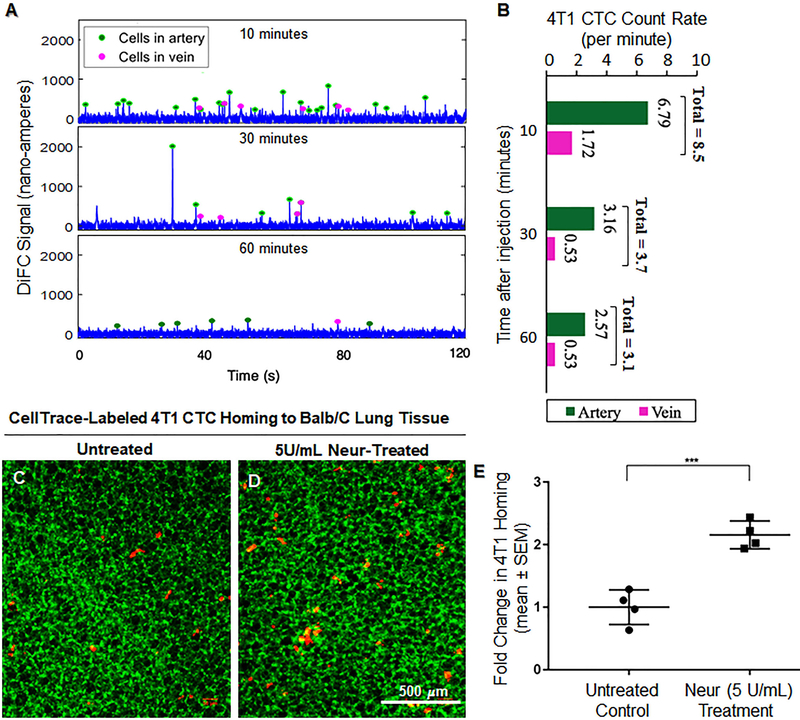
Cancer metastasis and secondary tumor initiation largely depend on circulating tumor cell (CTC) and vascular endothelial cell (EC) interactions by incompletely understood mechanisms. Endothelial glycocalyx (GCX) dysfunction may play a significant role in this process. GCX structure depends on vascular flow patterns, which are irregular in tumor environments. This work presents evidence that disturbed flow (DF) induces GCX degradation, leading to CTC homing to the endothelium, a first step in secondary tumor formation. A 2-fold greater attachment of CTCs to human ECs was found to occur under DF conditions, compared to uniform flow (UF) conditions. These results corresponded to an approximately 50% decrease in wheat germ agglutinin (WGA)-labeled components of the GCX under DF conditions, vs UF conditions, with undifferentiated levels of CTC-recruiting E-selectin under DF vs UF conditions. Confirming the role of the GCX, neuraminidase induced the degradation of WGA-labeled GCX under UF cell culture conditions or in Balb/C mice and led to an over 2-fold increase in CTC attachment to ECs or Balb/C mouse lungs, respectively, compared to untreated conditions. These experiments confirm that flow-induced GCX degradation can enable metastatic CTC arrest. This work, therefore, provides new insight into pathways of secondary tumor formation.

Keywords: disturbed flow; endothelial cells; glycocalyx; intercellular interactions; metastatic cancer cells.


Conflict of interest statement

Conflicts of Interest: The authors declare no conflict of interest.

Figures

Figure 1:
Figure 1:
A schematic showing the effect of DF patterns on endothelial GCX and circulating cancer cell attachment to the endothelium. A. Cancer cells within the primary tumor gain migratory properties and leave the primary tumor, intravasate through a nearby blood vessel, enter the bulk flow, and B. form secondary tumor sites in distant organs including the lungs. C. Geometric changes within the blood vessel results in different flow patterns. D. UF regions of blood vessels are known to have intact GCX resulting in the inability of CTC to attach to the endothelium. E. Branched areas will produce DF; we hypothesize that this DF will result in degradation of the endothelial GCX enhancing attachment of CTC to the endothelium.
Figure 2:
Figure 2:
A. A glass slide covered with ECs was placed at the bottom of the flow chamber. The ECs were exposed to a dynamic flow pattern that was generated by the introduction of a vertical step in the flow path. This computer aided simulation shows some of the flow pattern features. Here, the DF region is exaggerated for illustration purposes. It can be seen that eddy currents form immediately after the step, which is characterized by flow detachment, eddy current and reattachment sections. In addition, the DF region includes a transition in which the flow gradually adapts until it becomes UF. The transition region is followed by the UF region where the flow is void of any disturbances. Additional details can be found in Fig. S2 and its caption. B and C. Phase contrast images indicating healthy HUVEC monolayer after the introduction of both DF and UF. Insets show VE-cadherin labeled cells as further indication that endothelial layer is still intact in both DF and UF. D and E. Attachment of 4T1 breast cancer cells (D; red dots) and MCF7 cells (E; red dots) to the endothelium respectively. As expected cancer cells preferred to attach to the DF area than the UF area. F. Number of 4T1 and MCF7 breast cancer cells attached to the DF-conditioned endothelium. The dotted line represents normalized UF data. Significant increase in the attachment of cancer cells in the DF region compared to UF region. G. Number of cancer cell clusters formed in the DF region. The dotted line represents normalized UF data. We observed a significant increase in the clustering of 4T1 and MCF7 breast cancer cells to the endothelium in comparison with UF regions. H. Initial migration of 4T1 and MCF7 breast cancer cells through the DF-conditioned endothelium. The dotted line represents normalized UF data. Compared to UF regions, we observed a significant increase in the initial migration of cancer cells through the DF region, compared to UF areas. All data “Normalized with UF”. Student t test was used to compare DF vs. UF. Sample sizes: 4T1 attachment N=9, MCF7 attachment N=5. Significance is compared to the UF condition and denoted as *P<0.05, **P<0.01, ***P>0.001, or not significant (ns).
Figure 3:
Figure 3:
Effect of DF and UF patterns on the GCX and the expression of E-selectin. A. Computer aided simulation of DF formation immediately after the step (refer to Fig. 2A and Fig. S2 for more details). B. The coverage and thickness of GCX is significantly low within the DF region (green is WGA-labeled GCX and blue is DAPI-labeled nuclei). C. In the UF region the GCX is shown to be abundantly expressed both in coverage and thickness. D and E. Expression of the endothelial surface adhesion molecule E-selectin. The introduction of different flow patterns did not affect the coverage of HUVEC by E-selectin. F, G and H. Data quantification for GCX coverage, GCX thickness, and E-selectin coverage, respectively, on the surface of HUVEC. F. GCX coverage in UF region compared to DF region. G. GCX thickness in UF region compared to DF region. H. E-selectin coverage in UF region compared to DF region. All data “Normalized with UF”. Student t test was used to compare DF vs. UF. Sample sizes: WGA-labeled GCX expression N=3, E-selectin expression N=9. Significance is denoted as *P<0.05, **P<0.01, or not significant (ns).
Figure 4:
Figure 4:
Effect of the presence of Neur on cancer attachment, GCX expression, and E-selectin coverage. A and F. Phase contrast images revealing intact and healthy HUVEC monolayers in untreated conditions and after treatment with Neur. B and G. WGA-labeled GCX in UF (B) regions is abundant. Addition of Neur enzyme to the UF environment (G) abolishes WGA-labeled GCX. C and H. Coverage of HUVEC by E-selectin in conditions of isolated UF versus conditions of UF together with Neur enzyme. D and I. Attachment of 4T1 cells to HUVEC in UF region, prior to or after the introduction of 15mU/mL of Neur. E and J. Attachment of MCF7 cells to HUVEC in UF region, prior to or after the introduction of 15mU/mL of Neur. K and L. The quantification of coverage and thickness of GCX labeled by WGA, respectively. M. Coverage of E-selectin in UF with enzyme treatment, compared to UF conditions. N, O, and P. Data quantification of the attachment, clustering and the initial migration of 4T1 and MCF7 breast cancer cells to HUVEC monolayers, respectively. All data are normalized with UF results. Student’s t test was used to compare “UF” vs. “UF + Neur”. Sample sizes are as follows: GCX expression N=3, E-selectin coverage N=6, 4T1 data N=7, MCF7 data N=4. Significance is denoted as *P<0.05, **P<0.01, ***P<0.001, or not significant (ns).
Figure 5:
Figure 5:
Expression of GCX in the abdominal aorta of Balb/c mice. A. Control mice showing a uniform layer of GCX within the lumen of the abdominal aorta. B. After treatment of Balb/c mice with 5 U/mL of Neur we observed a decrease in the expression of GCX, with the layer showing discontinuity in coverage across the lumen of the abdominal aorta. C. Data quantification for coverage of GCX. D. Data quantification for the thickness of GCX. The sample size (N) is 4 for WGA-labeled GCX, data was statistically analyzed using the student t-test, and the statistical significance between the two groups is denoted as *P<0.05.
Figure 6:
Figure 6:
En face confirmation of intact endothelium after treatment with 5 U/mL of Neur. A and B. Expression of eNOS before and after the treatment with Neur enzyme. Images show that eNOS is expressed around the nucleus of ECs. C and D. E-selectin coverage before and after the treatment with enzyme. E-selectin is expression across the surface of the endothelium. E and F. PECAM-1 staining before and after the treatment of enzyme. Visual inspection show the presence of PECAM-1 across the entire surface of the endothelium. G and H. ZO-1 staining before and after enzyme treatment. Images show the endothelial cell-cell boundaries clearly and confirm endothelial barrier integrity. I. Data quantification for E-selectin showing a non-significant difference in expression of E-selectin on the endothelium between control and enzyme treated mice. All data are normalized with UF results. Student’s t test was used to compare endothelium from untreated mice to endothelium from Neur-treated mice. The sample size (N) is 4. NS denotes “not significant”.
Figure 7:
Figure 7:
In vivo attachment of 4T1 breast cancer cells to the lungs of BALB/C mice. A and B. In vivo data detected on diffuse in vivo flow cytometry (DiFC) system. Representative 120-second sequences of DiFC data show the number of cells in blood flow is decreasing over time after injection (A). The average CTC count rates detected in ventral caudal artery and ventral caudal vein and calculated in 15-minutes intervals, according to previously published methods [45], is also shown (B). C. Untreated control mice showing a limited attachment of 4T1 cancer cells to the lungs (green is the lung tissue and red dots are 4T1 breast cancer cells). D. We observed an increase in the attachment of 4T1 breast cancer cells to the lungs of BALB/C mice treated with 5U/mL of Neur. E. Data quantification showing a statistically significant increase in the attachment of 4T1 breast cancer cells to the lungs of BALB/C mice after treatment with 5U/mL of Neur. The sample size (N) is 4, data was statistically analyzed using the student t-test, and the statistical significance between the two groups is denoted as ***P<0.001.

Similar articles

Cited by

References

    1. Rai S, Nejadhamzeeigilani Z, Gutowski NJ, and Whatmore JL, Loss of the endothelial glycocalyx is associated with increased E-selectin mediated adhesion of lung tumour cells to the brain microvascular endothelium. J Exp Clin Cancer Res, 2015. 34: p. 105. - PMC - PubMed
    1. De Souza LM, Robertson BM, and Robertson GP, Future of circulating tumor cells in the melanoma clinical and research laboratory settings. Cancer Lett, 2017. 392: p. 60–70. - PubMed
    1. Goel S, Duda DG, Xu L, Munn LL, Boucher Y, Fukumura D, and Jain RK, Normalization of the vasculature for treatment of cancer and other diseases. Physiol Rev, 2011. 91(3): p. 1071–121. - PMC - PubMed
    1. Hashizume H, Baluk P, Morikawa S, McLean JW, Thurston G, Roberge S, Jain RK, and McDonald DM, Openings between defective endothelial cells explain tumor vessel leakiness. Am J Pathol, 2000. 156(4): p. 1363–80. - PMC - PubMed
    1. Cegan M, Kobierzycki C, Kolostova K, Kiss I, Bobek V, and Grill R, Circulating tumor cells in urological cancers. Folia Histochem Cytobiol, 2017. 55(3): p. 107–113. - PubMed

Publication types