. 2020 Aug 1;37(8):2450-2460.
doi: 10.1093/molbev/msaa069.

GenomegaMap: Within-Species Genome-Wide dN/dS Estimation from over 10,000 Genomes

Collaborators, Affiliations

GenomegaMap: Within-Species Genome-Wide dN/dS Estimation from over 10,000 Genomes

Daniel J Wilson et al. Mol Biol Evol. .

Abstract

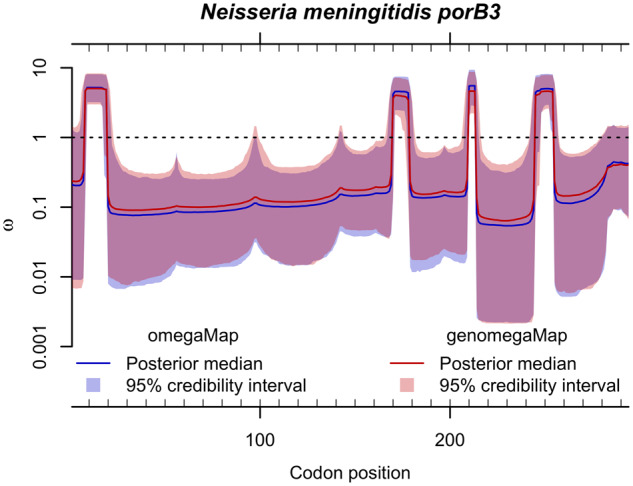
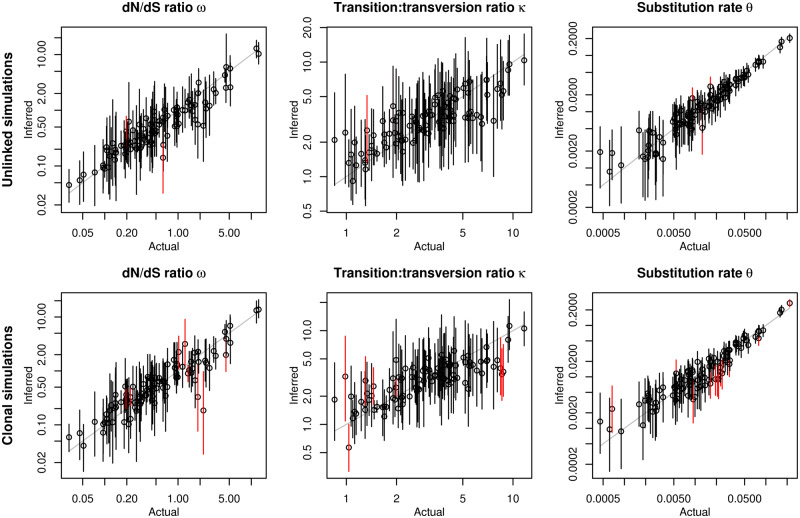
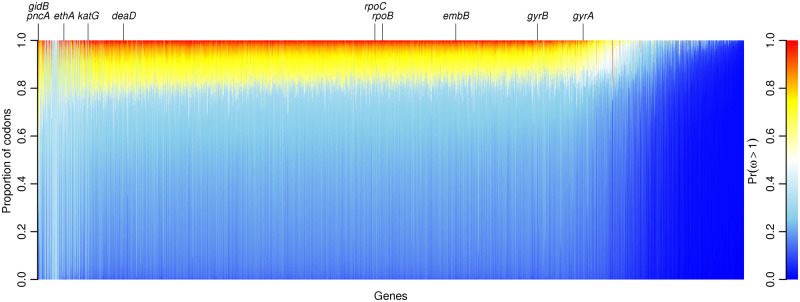
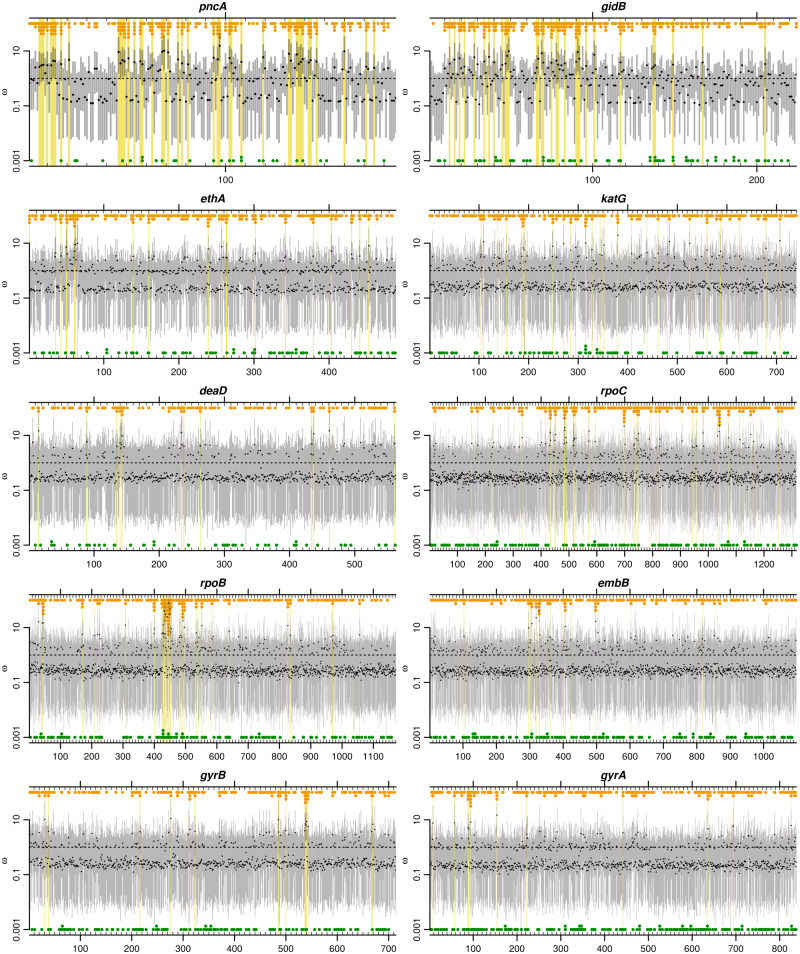
The dN/dS ratio provides evidence of adaptation or functional constraint in protein-coding genes by quantifying the relative excess or deficit of amino acid-replacing versus silent nucleotide variation. Inexpensive sequencing promises a better understanding of parameters, such as dN/dS, but analyzing very large data sets poses a major statistical challenge. Here, I introduce genomegaMap for estimating within-species genome-wide variation in dN/dS, and I apply it to 3,979 genes across 10,209 tuberculosis genomes to characterize the selection pressures shaping this global pathogen. GenomegaMap is a phylogeny-free method that addresses two major problems with existing approaches: 1) It is fast no matter how large the sample size and 2) it is robust to recombination, which causes phylogenetic methods to report artefactual signals of adaptation. GenomegaMap uses population genetics theory to approximate the distribution of allele frequencies under general, parent-dependent mutation models. Coalescent simulations show that substitution parameters are well estimated even when genomegaMap's simplifying assumption of independence among sites is violated. I demonstrate the ability of genomegaMap to detect genuine signatures of selection at antimicrobial resistance-conferring substitutions in Mycobacterium tuberculosis and describe a novel signature of selection in the cold-shock DEAD-box protein A gene deaD/csdA. The genomegaMap approach helps accelerate the exploitation of big data for gaining new insights into evolution within species.

Keywords: adaptation; big data; dN/dS; natural selection; parent-dependent mutation; recombination.


Figures

<sc>Fig</sc>. 1.
Fig. 1.
Comparison of omegaMap and genomegaMap estimates of the dN/dS ratio ω along the porB3 outer membrane protein gene of Neisseria meningitidis. Solid lines and shaded regions show the point estimates (posterior medians) and 95% credibility intervals, respectively, for omegaMap (in blue) and genomegaMap (in red). The genomegaMap runs were 4.9 times faster for these 23 sequences at 92 min each.
<sc>Fig</sc>. 2.
Fig. 2.
Performance of genomegaMap inference of ω, κ, and θ in simulations. In the Unlinked simulations (top row), every codon was simulated independently, favoring the genomegaMap assumption. In the Clonal simulations (bottom row), all codons were completely linked, disfavoring the genomegaMap assumption. Point estimates (posterior medians) and 95% credibility intervals are indicated by the circles and solid vertical lines, respectively, the latter colored red when they exclude the actual parameter. The number of simulations (out of 100) in which the 95% credibility intervals included the actual values of ω, κ, and θ were 98, 98, and 97 in the Unlinked simulations and 92, 92, and 88 in the Clonal simulations. The correlation between the point estimates and actual values of logω,logκ, and logθ were 0.86, 0.69, and 0.92 in the Unlinked simulations and 0.82, 0.61, and 0.88 in the Clonal simulations.
<sc>Fig</sc>. 3.
Fig. 3.
The evidence for positive selection across 3,979 genes in 10,209 Mycobacterium tuberculosis genomes. Each column is a stacked bar chart showing the proportion of codons in one gene with a given strength of evidence for positive selection, indicated by color. Blue indicates weakest evidence, Pr(ω>1)0, whereas red indicates strongest evidence, Pr(ω>1)1. Genes are ordered left-to-right by the mean Pr(ω>1) across codons, from highest to lowest. Notable genes containing codons with strong evidence of positive selection are labeled; these occur across the spectrum. The genes with predominantly sky blue color, scattered between pncA and katG, contained little information because they mapped poorly to the reference genome.
<sc>Fig</sc>. 4.
Fig. 4.
Evidence of positive selection in ten Mycobacterium tuberculosis genes across 10,209 genomes. Genes are ordered by the mean Pr(ω>1) across codons, from highest (gidB) to lowest (gyrA). Point estimates (black points) and 95% credibility intervals (gray bars) for ω are shown across codons. Codons for which Pr(ω>1)0.9 are highlighted with yellow boxes. Stacked points indicate the number of alleles that are nonsynonymous (orange) or synonymous (green) relative to the commonest allele.

References

    1. Anisimova M, Nielsen R, Yang Z.. 2003. Effect of recombination on the accuracy of the likelihood method for detecting positive selection at amino acid sites. Genetics 164:1229–1236. - PMC - PubMed
    1. Charollais J, Dreyfus M, Iost I.. 2004. CsdA, a cold-shock RNA helicase from Escherichia coli, is involved in the biogenesis of 50s ribosomal subunit. Nucleic Acids Res. 32(9):2751–2759. - PMC - PubMed
    1. Cole ST, Brosch R, Parkhill J, Garnier T, Churcher C, Harris D, Gordon SV, Eiglmeier K, Gas S, Barry CE, et al. 1998. Deciphering the biology of Mycobacterium tuberculosis from the complete genome sequence. Nature 393(6685):537–544., - PubMed
    1. Comas I, Borrell S, Roetzer A, Rose G, Malla B, Kato-Maeda M, Galagan J, Niemann S, Gagneux S.. 2012. Whole-genome sequencing of rifampicin-resistant Mycobacterium tuberculosis strains identifies compensatory mutations in RNA polymerase genes. Nat Genet. 44(1):106–110. - PMC - PubMed
    1. CRyPTIC Consortium and 100,000 Genomes Project. 2018. Prediction of susceptibility to first-line tuberculosis drugs by DNA sequencing. N Engl J Med. 379:1403–1415. - PMC - PubMed

Publication types

Substances