

Machine Learning and Statistical Models to Predict Postpartum Hemorrhage
- PMID: 32168227
- PMCID: PMC7236480
- DOI: 10.1097/AOG.0000000000003759
Machine Learning and Statistical Models to Predict Postpartum Hemorrhage
Abstract
Objective: To predict a woman's risk of postpartum hemorrhage at labor admission using machine learning and statistical models.
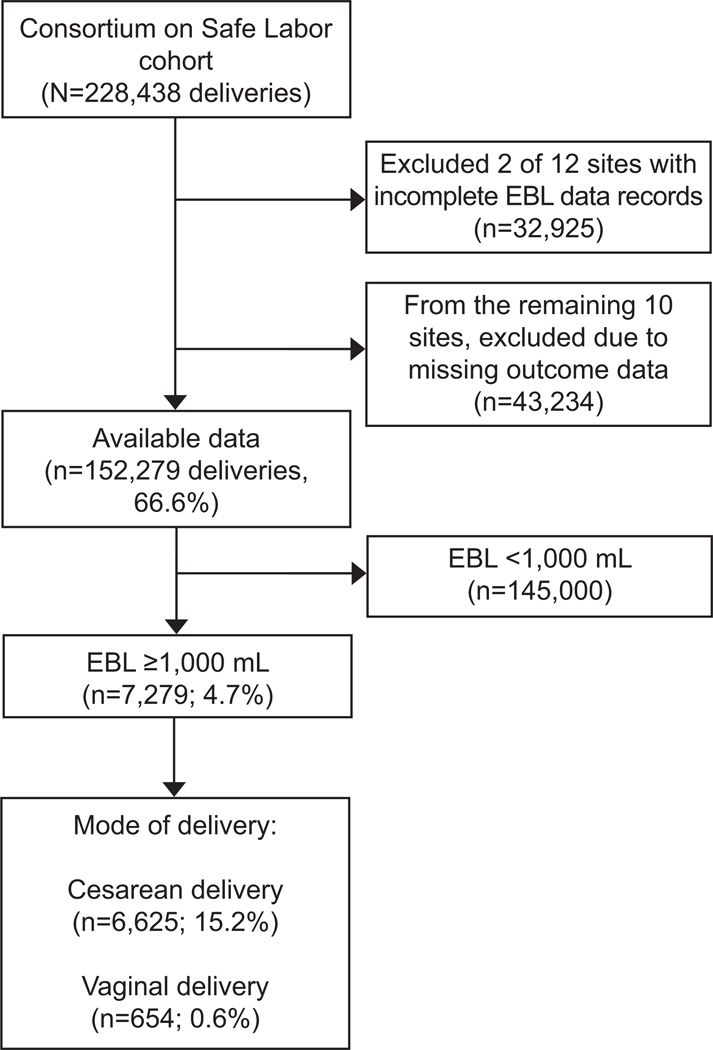
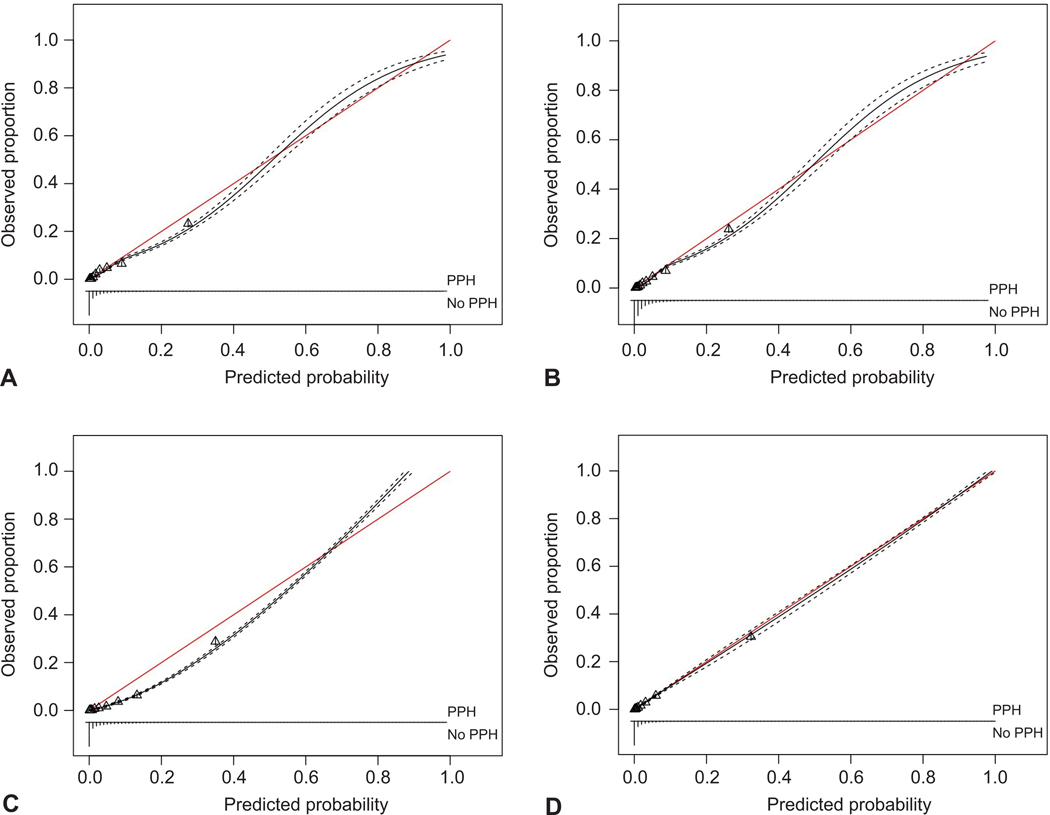
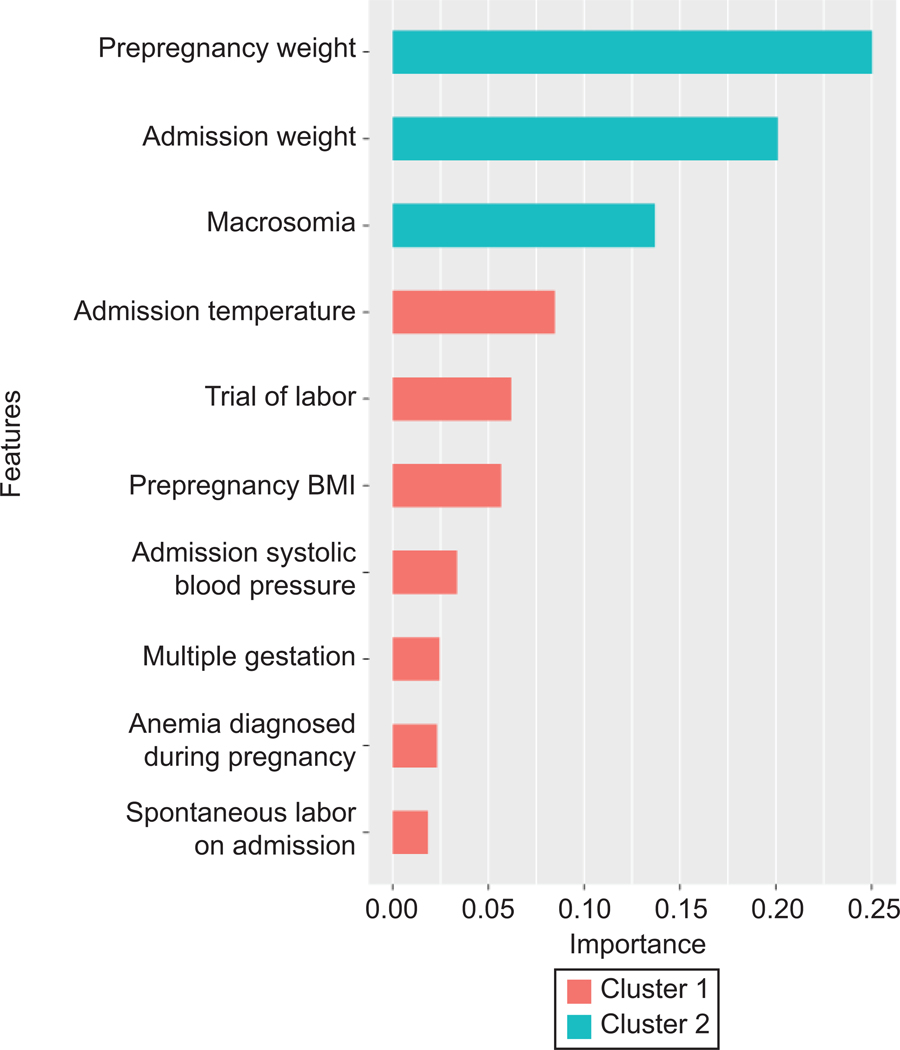
Methods: Predictive models were constructed and compared using data from 10 of 12 sites in the U.S. Consortium for Safe Labor Study (2002-2008) that consistently reported estimated blood loss at delivery. The outcome was postpartum hemorrhage, defined as an estimated blood loss at least 1,000 mL. Fifty-five candidate risk factors routinely available on labor admission were considered. We used logistic regression with and without lasso regularization (lasso regression) as the two statistical models, and random forest and extreme gradient boosting as the two machine learning models to predict postpartum hemorrhage. Model performance was measured by C statistics (ie, concordance index), calibration, and decision curves. Models were constructed from the first phase (2002-2006) and externally validated (ie, temporally) in the second phase (2007-2008). Further validation was performed combining both temporal and site-specific validation.
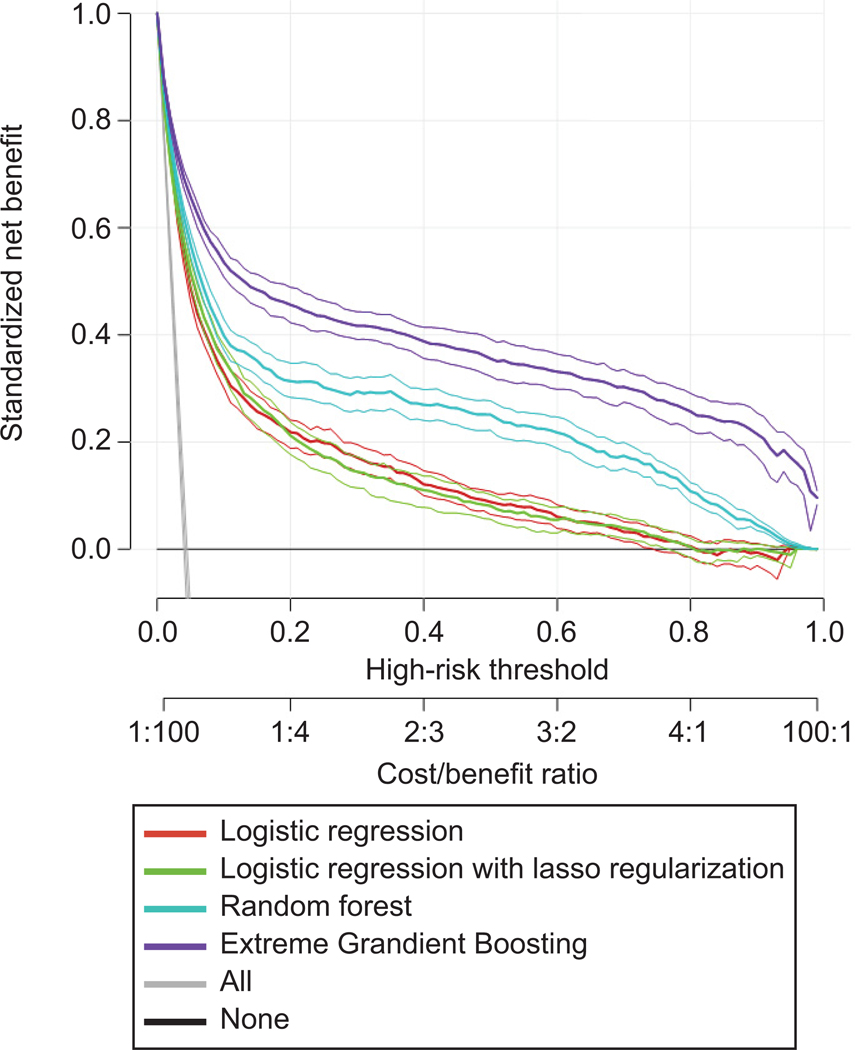
Results: Of the 152,279 assessed births, 7,279 (4.8%, 95% CI 4.7-4.9) had postpartum hemorrhage. All models had good-to-excellent discrimination. The extreme gradient boosting model had the best discriminative ability to predict postpartum hemorrhage (C statistic: 0.93; 95% CI 0.92-0.93), followed by random forest (C statistic: 0.92; 95% CI 0.91-0.92). The lasso regression model (C statistic: 0.87; 95% CI 0.86-0.88) and logistic regression (C statistic: 0.87; 95% CI 0.86-0.87) had lower-but-good discriminative ability. The above results held with validation across both time and sites. Decision curve analysis demonstrated that, although all models provided superior net benefit when clinical decision thresholds were between 0% and 80% predicted risk, the extreme gradient boosting model provided the greatest net benefit.
Conclusion: Postpartum hemorrhage on labor admission can be predicted with excellent discriminative ability using machine learning and statistical models. Further clinical application is needed, which may assist health care providers to be prepared and triage at-risk women.
Conflict of interest statement
Financial Disclosure
The other authors did not report any potential conflicts of interest.
Figures
Comment in
-
Machine Learning and Statistical Models to Predict Postpartum Hemorrhage.Obstet Gynecol. 2020 Jul;136(1):194-195. doi: 10.1097/AOG.0000000000003980. Obstet Gynecol. 2020. PMID: 32590708 No abstract available.
-
Response to Letter.Obstet Gynecol. 2020 Jul;136(1):195. doi: 10.1097/AOG.0000000000003981. Obstet Gynecol. 2020. PMID: 32590709 No abstract available.
References
-
- Say L, Chou D, Gemmill A, Tunçalp Ö2, Moller AB, Daniels J, Gülmezoglu AM, Temmerman M, Alkema L. Global causes of maternal death: a WHO systematic analysis. Lancet Global Health 2014;2:e323–33. - PubMed
-
- Bateman B, Berman MF, Riley LE, Leffert LR. The epidemiology of postpartum hemorrhage in a large, nationwide sample of deliveries. Anaesthesia and analgesia 2010;110:1368–73. - PubMed
-
- Callaghan W, Kuklina EV, Berg CJ. Trends in postpartum hemorrhage: United States, 1994–2006. American Journal of Obstetrics and Gynecology 2010;202:353. - PubMed
-
- Callaghan W, Mackay AP, Berg CJ. Identification of severe maternal morbidity during delivery hospitalizations, United States, 1991–2003. American Journal of Obstetrics and Gynecology 2008;199:133. - PubMed
Publication types
MeSH terms
Grants and funding
LinkOut - more resources
Full Text Sources
Medical
