. 2020 Mar 13;16(3):e1007680.
doi: 10.1371/journal.pcbi.1007680. eCollection 2020 Mar.

Performance of virtual screening against GPCR homology models: Impact of template selection and treatment of binding site plasticity

Affiliations

Performance of virtual screening against GPCR homology models: Impact of template selection and treatment of binding site plasticity

Mariama Jaiteh et al. PLoS Comput Biol. .

Abstract

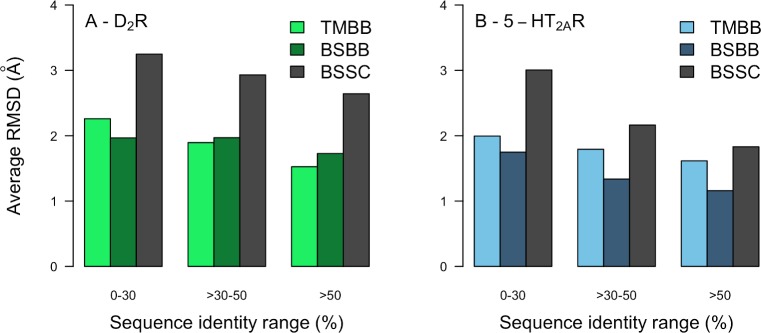
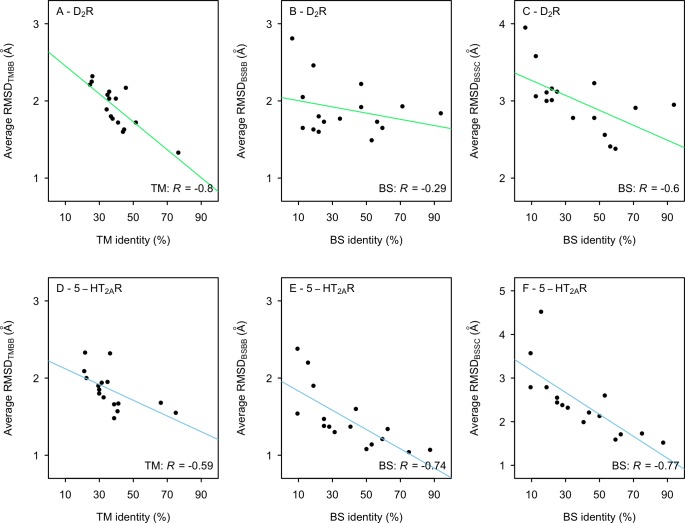
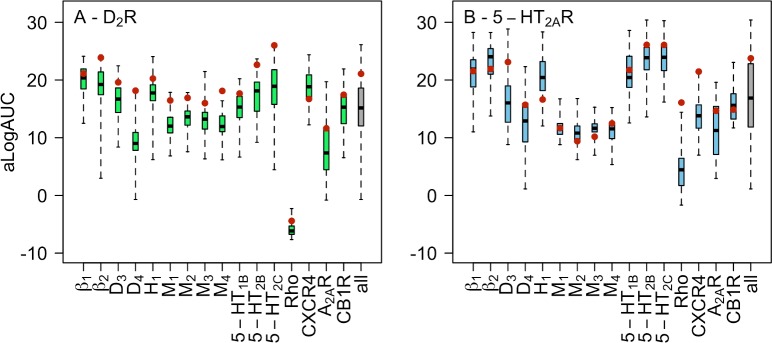
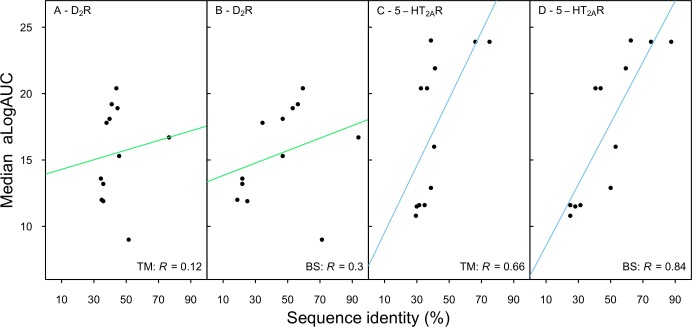
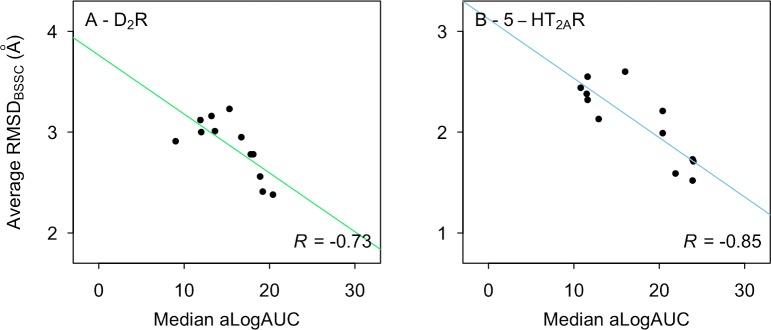
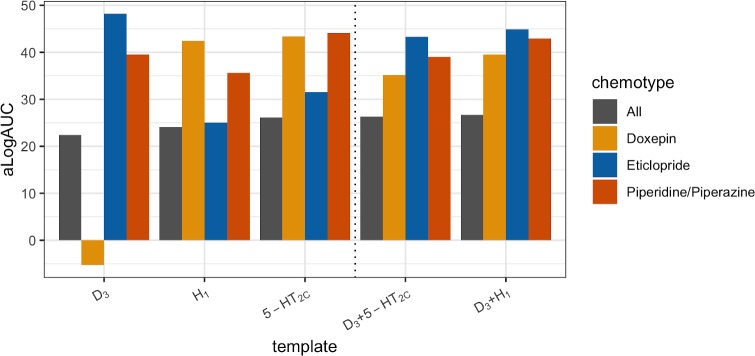
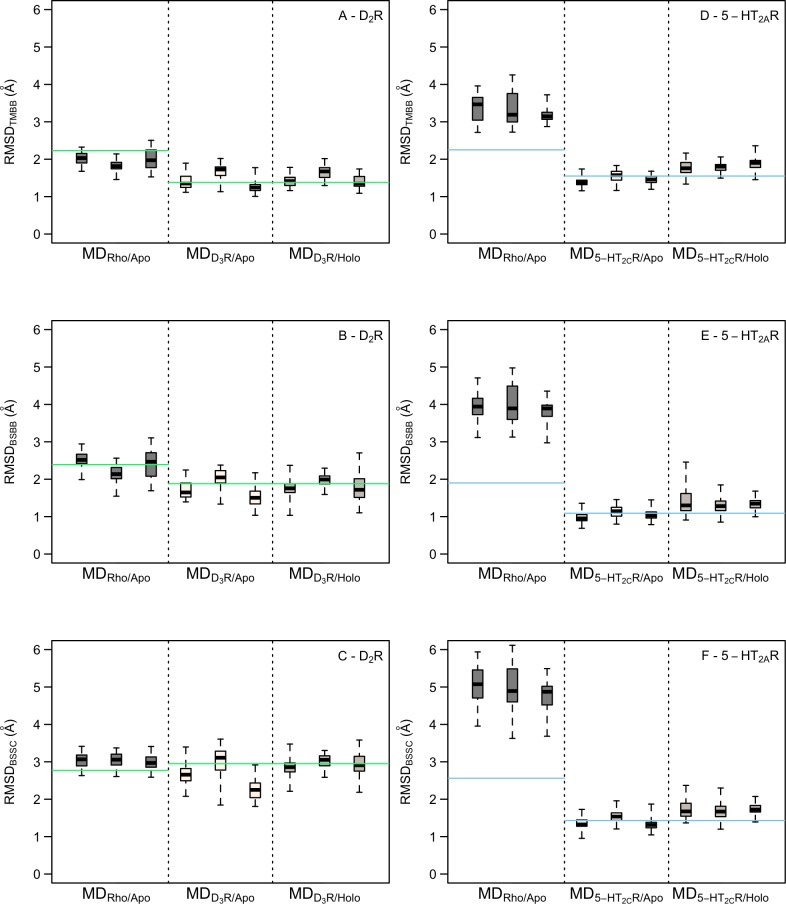
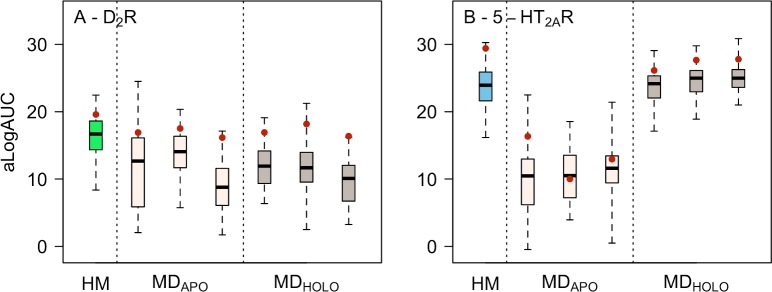
Rational drug design for G protein-coupled receptors (GPCRs) is limited by the small number of available atomic resolution structures. We assessed the use of homology modeling to predict the structures of two therapeutically relevant GPCRs and strategies to improve the performance of virtual screening against modeled binding sites. Homology models of the D2 dopamine (D2R) and serotonin 5-HT2A receptors (5-HT2AR) were generated based on crystal structures of 16 different GPCRs. Comparison of the homology models to D2R and 5-HT2AR crystal structures showed that accurate predictions could be obtained, but not necessarily using the most closely related template. Assessment of virtual screening performance was based on molecular docking of ligands and decoys. The results demonstrated that several templates and multiple models based on each of these must be evaluated to identify the optimal binding site structure. Models based on aminergic GPCRs showed substantial ligand enrichment and there was a trend toward improved virtual screening performance with increasing binding site accuracy. The best models even yielded ligand enrichment comparable to or better than that of the D2R and 5-HT2AR crystal structures. Methods to consider binding site plasticity were explored to further improve predictions. Molecular docking to ensembles of structures did not outperform the best individual binding site models, but could increase the diversity of hits from virtual screens and be advantageous for GPCR targets with few known ligands. Molecular dynamics refinement resulted in moderate improvements of structural accuracy and the virtual screening performance of snapshots was either comparable to or worse than that of the raw homology models. These results provide guidelines for successful application of structure-based ligand discovery using GPCR homology models.


Conflict of interest statement

The authors have declared that no competing interests exist.

Figures

Fig 1
Fig 1. Structural accuracy of homology models based on templates with different levels of sequence identity.
The average RMSDTMBB (green and blue bars), RMSDBSBB (dark green and blue bars), and RMSDBSSC (grey bars) to the crystal structures were calculated for 50 models per template. Bar charts of structural accuracy using templates with different levels of sequence identity was calculated for (A) the D2R and (B) 5-HT2AR.
Fig 2
Fig 2. Relation between structural accuracy and sequence identity.
The average RMSDTMBB (A and D), RMSDBSBB (B and E), and RMSDBSSC (C and F) to the crystal structures for 50 models of the D2R (A-C) and 5-HT2AR (D-F) based on different templates. The solid line represents a linear regression and R is Pearson’s correlation coefficient.
Fig 3
Fig 3. Ligand enrichment by homology models.
Distribution of aLogAUC values for (A) D2R and (B) 5-HT2AR models based on 16 different templates. Distributions are shown using a boxplot representation. Each boxplot describes the results for 50 models obtained based on one template. The box represents the 50th percentile of the data and the black band shows the median value. The lowest and highest aLogAUC values are represented by the whiskers. The gray boxplot corresponds the results of all 600 models based on aminergic receptor templates. Ensemble enrichments are represented by red filled circles.
Fig 4
Fig 4. Relation between ligand enrichment and sequence identity.
The median aLogAUC values of the D2R (A-B) and 5-HT2AR (C-D) homology models based on aminergic templates with different TM (A and C) or BS (B and D) sequence identities. The solid line represents a linear regression and R is Pearson’s correlation coefficient.
Fig 5
Fig 5. Relation between ligand enrichment and structural accuracy.
The median aLogAUC and average RMSDBSSC to the crystal structures for 50 homology models of the D2R (A) and 5-HT2AR (B) based on aminergic templates. The solid line represents a linear regression and R is Pearson’s correlation coefficient.
Fig 6
Fig 6. Influence of template on enrichment of ligand chemotypes.
Enrichment (aLogAUC) of eticlopride- (blue bars), doxepin- (yellow bars), piperidine/piperazine-like (red bars), and all (grey bars) D2R ligands by D2R homology models. Homology models based on three different templates (D3R, H1R, and 5-HT2CR) and ensemble enrichments of the D3R model combined with either the H1R and 5-HT2CR models were evaluated.
Fig 7
Fig 7. Structural accuracy of MD simulation snapshots.
RMSD distribution of the TM backbone, BS backbone, and BS side chains of MD snapshots to the crystal structure for the D2R (A-C) and 5-HT2AR (D-F). Distributions of RMSD values for the three sets of snapshots based on the Rho-based models (MDRho/Apo) and homology models based on the most closely related template in apo (MDTemplate/Apo) and holo forms (MDTemplate/Holo) are shown using a boxplot representation. The box represents the 50th percentile of the data and the black band shows the median value. The lowest and highest RMSD values are represented by the whiskers. The horizontal lines show the RMSD values of the homology model used as starting structure.
Fig 8
Fig 8. Ligand enrichment by MD simulation snapshots.
Distributions of aLogAUC values for 50 homology models (HM) and sets of 50 snapshots from three MD simulations per template for the (A) D2R based on the D3R template and (B) 5-HT2AR based on the 5-HT2CR template. Results for HM, apo (MDAPO), and holo forms (MDHOLO) are shown using a boxplot representation. The box represents the 50th percentile of the data and the black band shows the median value. The lowest and highest alogAUC values are represented by the whiskers. The ensemble enrichments of each set of 50 models are represented by red filled circles.

Similar articles

Cited by

References

    1. Lagerström MC, Schiöth HB. Structural diversity of G protein-coupled receptors and significance for drug discovery. Nat Rev Drug Discov. 2008;7: 339–357. 10.1038/nrd2518 - DOI - PubMed
    1. Hauser AS, Attwood MM, Rask-Andersen M, Schiöth HB, Gloriam DE. Trends in GPCR drug discovery: new agents, targets and indications. Nat Rev Drug Discov. 2017;16: 829–842. 10.1038/nrd.2017.178 - DOI - PMC - PubMed
    1. Rodríguez D, Brea J, Loza MI, Carlsson J. Structure-Based Discovery of Selective Serotonin 5-HT1B Receptor Ligands. Structure. 2014;22: 1140–1151. 10.1016/j.str.2014.05.017 - DOI - PubMed
    1. De Graaf C, Kooistra AJ, Vischer HF, Katritch V, Kuijer M, Shiroishi M, et al. Crystal structure-based virtual screening for fragment-like ligands of the human histamine H1 receptor. J Med Chem. 2011;54: 8195–8206. 10.1021/jm2011589 - DOI - PMC - PubMed
    1. Kruse AC, Weiss DR, Rossi M, Hu J, Hu K, Eitel K, et al. Muscarinic Receptors as Model Targets and Antitargets for Structure-Based Ligand Discovery. Mol Pharmacol. 2013;84: 528–540. 10.1124/mol.113.087551 - DOI - PMC - PubMed

Publication types