. 2020 Mar 13;15(3):e0230307.
doi: 10.1371/journal.pone.0230307. eCollection 2020.

Characterization of the immune cell landscape of patients with NAFLD

Affiliations

Characterization of the immune cell landscape of patients with NAFLD

Tom Diedrich et al. PLoS One. .

Abstract

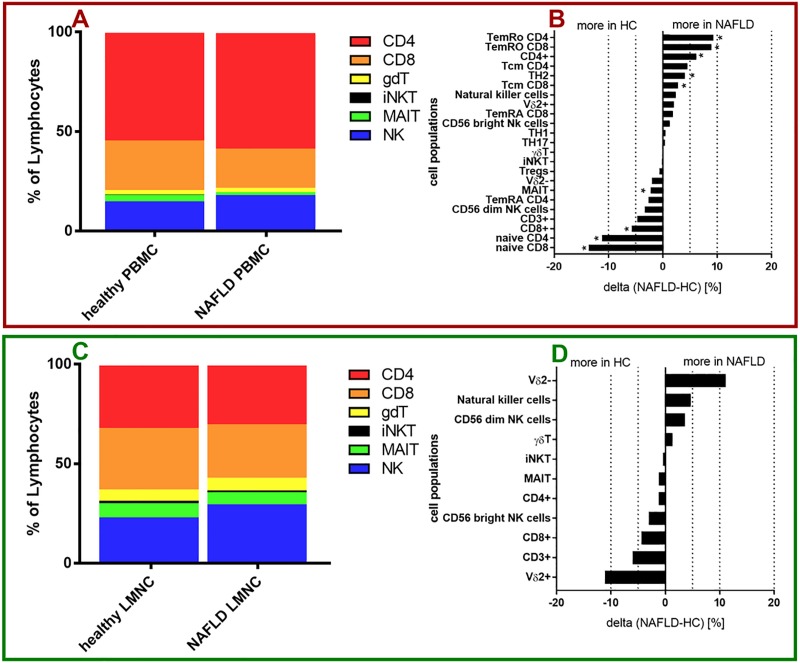
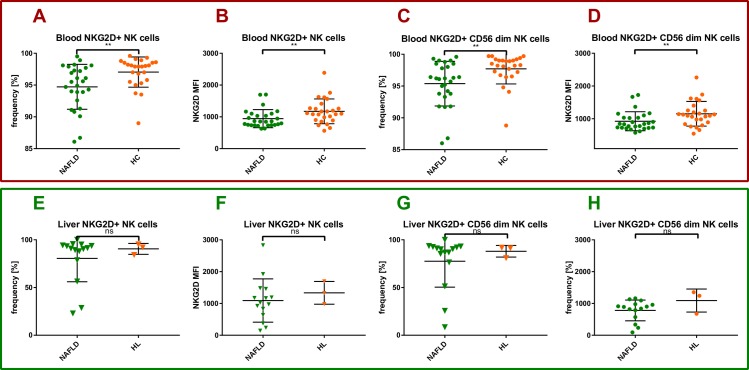
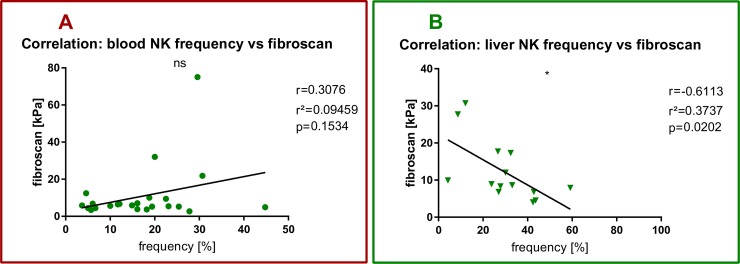
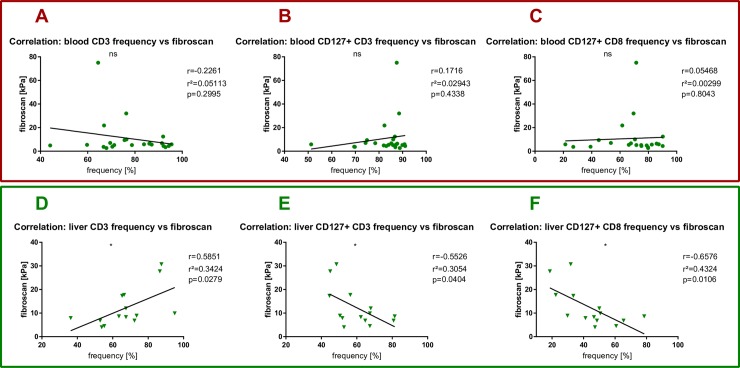
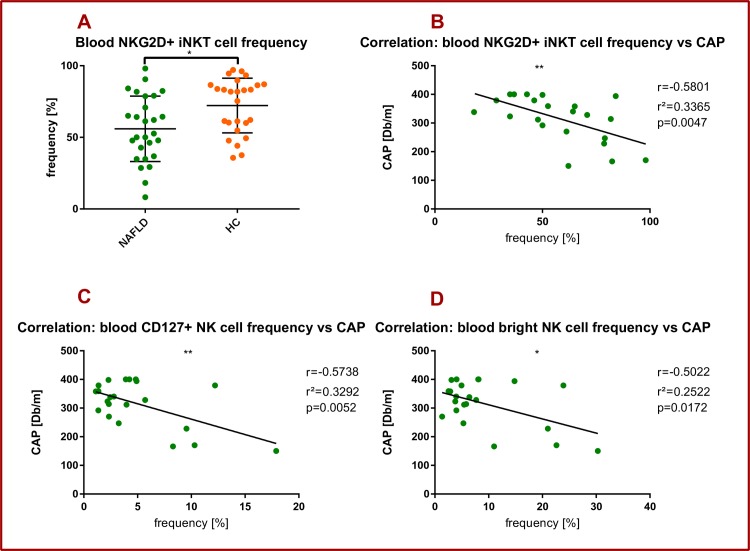
Multiple factors are involved in the pathogenesis of non-alcoholic fatty liver disease (NAFLD), but the exact immunological mechanisms that cause inflammation and fibrosis of the liver remain enigmatic. In this current study, cellular samples of a cohort of NAFLD patients (peripheral blood mononuclear cells (PBMC): n = 27, liver samples: n = 15) and healthy individuals (PBMC: n = 26, liver samples: n = 3) were analyzed using 16-color flow cytometry, and the frequency and phenotype of 23 immune cell subtypes was assessed. PBMC of NAFLD patients showed decreased frequencies of total CD3+, CD8+ T cells, CD56dim NK cells and MAIT cells, but elevated frequencies of CD4+ T cells and Th2 cells compared to healthy controls. Intrahepatic lymphocytes (IHL) of NAFLD patients showed decreased frequencies of total T cells, total CD8+ T cells, Vd2+γδ T cells, and CD56bright NK cells, but elevated frequencies of Vδ2-γδ T cells and CD56dim NK cells compared to healthy controls. The activating receptor NKG2D was significantly less frequently expressed among iNKT cells, total NK cells and CD56dim NK cells of PBMC of NAFLD patients compared to healthy controls. More strikingly, hepatic fibrosis as measured by fibroscan elastography negatively correlated with the intrahepatic frequency of total NK cells (r2 = 0,3737, p = 0,02). Hepatic steatosis as measured by controlled attenuation parameter (CAP) value negatively correlated with the frequency of circulating NKG2D+ iNKT cells (r2 = 0,3365, p = 0,0047). Our data provide an overview of the circulating and intrahepatic immune cell composition of NAFLD patients, and point towards a potential role of NK cells and iNKT cells for the regulation of hepatic fibrosis and steatosis in NAFLD.


Conflict of interest statement

The authors have declared that no competing interests exist.

Figures

Fig 1
Fig 1. Immune cell composition in NAFLD.
(A, C) Composition of infiltrating immune cells in PBMC (A) and liver samples (C) of healthy controls as well as NAFLD patients summarized from calculated mean values of each patient group. (B, D) Changes of immune cell composition between NAFLD patients and healthy controls in PBMC samples (B) and liver samples (D). (red Box) PBMC data. (green Box) liver data. (B,D) For comparisons Mann-Whitney test was used. *p<0.05.
Fig 2
Fig 2. Peripheral and intrahepatic NKG2D positive NK cells in NAFLD.
Healthy PBMC controls (HC), healthy liver controls (HL), NAFLD liver and PBMC samples (NAFLD), mean fluorescence intensity (MFI). Each spot represents one patient. (A-D) PBMC data. (E-H) intrahepatic data. (A) NKG2D+NK cell frequency in PBMCs of NAFLD patients compared to healthy controls. (B) NKG2D MFI of NK cells in PBMCs of NAFLD patients compared to healthy controls. (C) NKG2D+CD56dim NK cell frequency in PBMCs of NAFLD patients compared to healthy controls. (D) NKG2D MFI of CD56dim NK cells in PBMCs of NAFLD patients compared to healthy controls. (E) NKG2D+ NK cell frequency in liver samples of NAFLD patients compared to healthy controls. (F) NKG2D MFI of NK cells in IHLs of NAFLD patients compared to healthy controls. (G) NKG2D+ CD56dim NK cell frequency in liver samples of NAFLD patients compared to healthy controls. (H) NKG2D MFI of CD56dim NK cells in IHLs of NAFLD patients compared to healthy controls. For Comparisons Mann-Whitney test was used. *p<0.05, **p>0.01.
Fig 3
Fig 3. NK cells and hepatic fibrosis in NAFLD.
Each spot represents one patient. (A) PBMC data. (B) intrahepatic data. (A) Pearson’s correlation between peripheral NK cell frequency and fibroscan with Pearsons r, r2 and p value. (B) Pearson’s correlation between intrahepatic NK cell frequency and fibroscan with Pearsons r, r2 and p value. *p<0.05, **p>0.01.
Fig 4
Fig 4. T cells and hepatic fibrosis in NAFLD.
Each spot represents one patient. (A-C) PBMC data. (D-F) intrahepatic data. (A) Pearson’s correlation between peripheral T cell frequency and fibroscan with Pearsons r, r2 and p value. (B) Pearson’s correlation between peripheral CD127 positive T cell frequency and fibroscan with Pearsons r, r2 and p value. (C) Pearson’s correlation between peripheral CD127 positive CD8 positive T cell frequency and fibroscan with Pearsons r, r2 and p value. (D) Pearson’s correlation between intrahepatic T cell frequency and fibroscan with Pearsons r, r2 and p value. (E) Pearson’s correlation between intrahepatic CD127 positive T cell frequency and fibroscan with Pearsons r, r2 and p value. (F) Pearson’s correlation between intrahepatic CD127 positive CD8 positive T cell frequency and fibroscan with Pearsons r, r2 and p value. *p<0.05.
Fig 5
Fig 5. NKG2D+ iNKT cells and hepatic steatosis in NAFLD.
Healthy PBMC controls (HC), healthy liver controls (HL), NAFLD liver and PBMC samples (NAFLD). Each spot represents one patient. (A-D) PBMC data. (A) NKG2D+ iNKT cell frequency in PBMCs of NAFLD patients compared to healthy controls. For comparison Mann-Whitney test was used. (B) Pearson’s correlation between peripheral NKG2D+ iNKT cell frequency and CAP with Pearsons r, r2 and p value. (C) Pearson’s correlation between peripheral CD127+ NK cell frequency and CAP with Pearsons r, r2 and p value. (D) Pearson’s correlation between peripheral CD127+ CD56 bright NK cell frequency and CAP with Pearsons r, r2 and p value. *p<0.05, **p>0.01.

References

    1. Younossi ZM, Stepanova M, Afendy M, Fang Y, Younossi Y, Mir H, et al. Changes in the Prevalence of the Most Common Causes of Chronic Liver Diseases in the United States From 1988 to 2008. Clin Gastroenterol Hepatol. 2011;9 10.1016/j.cgh.2011.03.020 - DOI - PubMed
    1. Haas JT, Francque S, Staels B. Pathophysiology and Mechanisms of Nonalcoholic Fatty Liver Disease. Annu Rev Physiol. 2016;78: 181–205. 10.1146/annurev-physiol-021115-105331 - DOI - PubMed
    1. Matteoni CA, Younossi ZM, Gramlich T, Boparai N, Yao Chang Liu, McCullough AJ. Nonalcoholic fatty liver disease: A spectrum of clinical and pathological severity. Gastroenterology. 1999;116: 1413–1419. 10.1016/s0016-5085(99)70506-8 - DOI - PubMed
    1. Bugianesi E, Leone N, Vanni E, Marchesini G, Brunello F, Carucci P, et al. Expanding the natural history of nonalcoholic steatohepatitis: From cryptogenic cirrhosis to hepatocellular carcinoma. Gastroenterology. 2002;123: 134–140. 10.1053/gast.2002.34168 - DOI - PubMed
    1. Tilg H, Moschen AR. Evolution of inflammation in nonalcoholic fatty liver disease: The multiple parallel hits hypothesis. Hepatology. 2010;52: 1836–1846. 10.1002/hep.24001 - DOI - PubMed

Publication types

MeSH terms