. 2020 Apr 8;20(4):2264-2270.
doi: 10.1021/acs.nanolett.9b04277. Epub 2020 Mar 20.

High-Speed Super-Resolution Imaging Using Protein-Assisted DNA-PAINT

Affiliations

High-Speed Super-Resolution Imaging Using Protein-Assisted DNA-PAINT

Mike Filius et al. Nano Lett. .

Abstract

Super-resolution imaging allows for the visualization of cellular structures on a nanoscale level. DNA-PAINT (DNA point accumulation in nanoscale topology) is a super-resolution method that depends on the binding and unbinding of DNA imager strands. The current DNA-PAINT technique suffers from slow acquisition due to the low binding rate of the imager strands. Here we report on a method where imager strands are loaded into a protein, Argonaute (Ago), which allows for faster binding. Ago preorders the DNA imager strand into a helical conformation, allowing for 10 times faster target binding. Using a 2D DNA origami structure, we demonstrate that Ago-assisted DNA-PAINT (Ago-PAINT) can speed up the current DNA-PAINT technique by an order of magnitude, while maintaining the high spatial resolution. We envision this tool to be useful for super-resolution imaging and other techniques that rely on nucleic acid interactions.

Keywords: Ago-PAINT; Argonaute; DNA origami; DNA-PAINT; single-molecule FRET; super-resolution microscopy.


Conflict of interest statement

The authors declare no competing financial interest.

Figures

Figure 1
Figure 1
Single-molecule FRET assay to quantify binding kinetics Ago-PAINT vs DNA-PAINT. (A) A schematic of the single-molecule FRET assay with the target strand immobilized on a PEGylated surface through biotin–streptavidin conjugation. The green and red stars indicate the Cy3 and Cy5 dye, respectively. Binding of the Ago-guide complex or ssDNA probe to the ssDNA target results in a high FRET signal. (B) Representative traces of ssDNA binding (top) and Ago-complex binding (bottom). The dashed line indicates the time point at which the Ago-guide or DNA is iintroduced inside the microfluidic chamber. (C) A schematic of the sequences used for Ago-PAINT and DNA-PAINT. Upon binding, both constructs will give rise to a high FRET signal. (D) Dwell-time histogram (Δτ) of ssDNA (sequence shown in Figure 1C). Maximum likelihood estimation (MLE) gives 1.1 ± 0.2 s as the parameter for a single-exponential distribution (blue line). Number of data points: 1029. (E) Dwell-time histogram (Δτ) of Ago (sequence shown in Figure 1C). MLE gives 1.2 ± 0.2 s as the parameter for a single-exponential distribution (blue line). Number of data points: 696. (F) Cumulative binding event plots of DNA-PAINT (black) and Ago-PAINT (orange) vs time. A single exponential fit is used for DNA-PAINT (red line) and Ago-PAINT (orange line). Errors in panels D–F are determined by taking the 95% interval of 105 bootstraps.
Figure 2
Figure 2
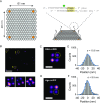
Ago-PAINT enables the same localization precision as conventional DNA-PAINT. (A) Left: A schematic design of the 2D-DNA origami structure. The orange honeycombs indicate the approximate locations of binding sites. Right: 3D representation of the imaging scheme with the docking strand sequence. The green star indicates the position of the Cy3 dye labeled on aminomodified thymine. (B) A representative super-resolution image showcasing binding sites of the 2D-DNA origami structures using Ago-PAINT. Bottom: Super-resolution reconstruction of the four-corner origami structures of the top panel. (C) A summed image of 220 origami structures visualized through the use of DNA-PAINT. (D) A summed image of 219 origami structures made through the use of Ago-PAINT. The concentration of the imager strand was 1 nM for both DNA-PAINT and Ago-PAINT. (E) Fitting of a cross-sectional intensity histogram from the yellow encircled area in panel C to a Gaussian (blue line) shows a localization precision of 10.6 nm. (F) Fitting of a cross-sectional intensity histogram from the yellow encircled area in panel D to a Gaussian (blue line) showing a localization precision of 9.5 nm. Scale bars in panel B indicate 500 nm (top) and 50 nm (bottom three). Scale bars in panels C and D indicate 100 nm.
Figure 3
Figure 3
Ago-PAINT enables fast imaging of super-resolved structures. (A) Snapshots in time for Ago-PAINT (top) and DNA-PAINT (bottom) showing super-resolution images being formed over time. Exposure time: 0.3 s. The same color scale is used for the intensity in all images. (B) Standard error of Ago-PAINT vs DNA-PAINT plotted versus frame number. (C) Representative intensity vs time data trace of DNA-PAINT at 1 nM DNA concentration showing few binding events occurring within 600 s. The raw data trace is taken from a single origami plate. (D) Representative intensity vs the time data trace of the 1 nM Ago-guide complex showing binding events that occur frequently within 600 s. The raw data trace is taken from a single origami plate. (E) Normalized cumulative distribution of dark times (the time between binding events) for DNA-PAINT (black, n = 4870) and Ago-PAINT (orange, n = 5793). A single-exponential growth curve is used to estimate the binding rate for DNA-PAINT (orange) and a linear fit is used for a first order approximation for DNA-PAINT (red). Scale bars in panel A indicate 100 nm.

References

    1. Betzig E.; et al. Imaging Intracellular Fluorescent Proteins at Nanometer Resolution. Science (Washington, DC, U. S.) 2006, 313, 1642–1645. 10.1126/science.1127344. - DOI - PubMed
    1. Rust M. J.; Bates M.; Zhuang X. Sub-diffraction-limit imaging by stochastic optical reconstruction microscopy (STORM). Nat. Methods 2006, 3, 793–796. 10.1038/nmeth929. - DOI - PMC - PubMed
    1. Giannone G.; et al. Dynamic Superresolution Imaging of Endogenous Proteins on Living Cells at Ultra-High Density. Biophys. J. 2010, 99, 1303–1310. 10.1016/j.bpj.2010.06.005. - DOI - PMC - PubMed
    1. Schoen I.; Ries J.; Klotzsch E.; Ewers H.; Vogel V. Binding-activated localization microscopy of DNA l. Nano Lett. 2011, 11, 4008–4011. 10.1021/nl2025954. - DOI - PubMed
    1. Sharonov A.; Hochstrasser R. M. Wide-field subdiffraction imaging by accumulated binding of diffusing probes. Proc. Natl. Acad. Sci. U. S. A. 2006, 103, 18911–18916. 10.1073/pnas.0609643104. - DOI - PMC - PubMed

Publication types

MeSH terms