

Accelerometer-measured physical activity and sedentary time in a cohort of US adults followed for up to 13 years: the influence of removing early follow-up on associations with mortality
- PMID: 32169059
- PMCID: PMC7071621
- DOI: 10.1186/s12966-020-00945-4
Accelerometer-measured physical activity and sedentary time in a cohort of US adults followed for up to 13 years: the influence of removing early follow-up on associations with mortality
Abstract
Background: Observational studies linking physical activity with mortality are susceptible to reverse causation bias from undiagnosed and prevalent diseases. Researchers often attempt to deal with reverse causation bias by excluding deaths occurring within the first 1 or 2 years from the analysis, but it is unclear if excluding deaths within this time-frame is sufficient to remove bias.
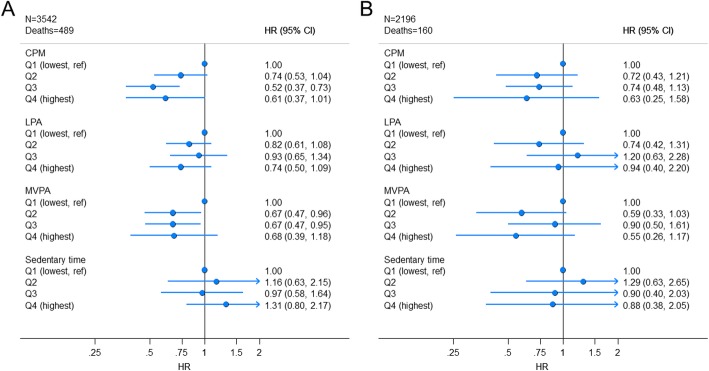
Methods: We examined associations between total and intensity-specific physical activity and sedentary time with all-cause mortality in a prospective cohort of 3542 individuals from the 2003-2006 NHANES cycles. In order to yield measures of association hypothesized as minimally influenced by reverse causation bias the primary analysis excluded individuals with < 5 years of follow-up. Accelerometer-measured physical activity was linked with recently updated vital status from the National Death Index with a median follow-up of 10.8 years.
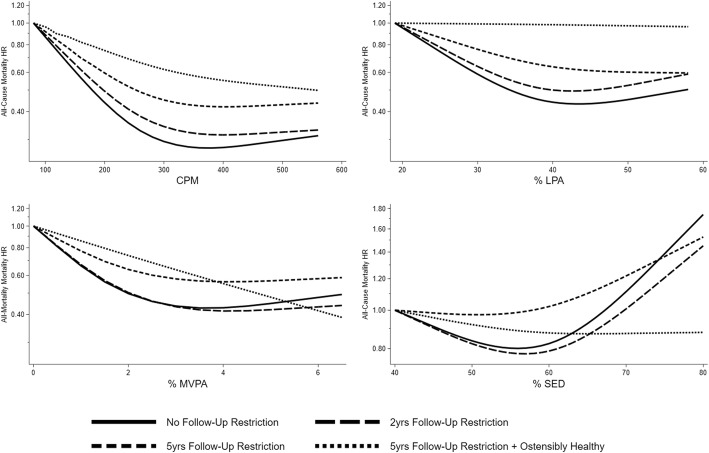
Results: Hazard ratios (95% confidence intervals) were 0.74 (0.53, 1.04), 0.52 (0.37, 0.73), and 0.61 (0.38, 1.01) for ascending quartiles of total physical activity against the least active reference. Hazard ratios for ascending moderate-to-vigorous physical activity quartiles against the reference were 0.67 (0.47, 1.96), 0.67 (0.47, 0.95), and 0.68 (0.39, 1.18). Associations for light intensity physical activity and sedentary time were smaller in magnitude and all confidence intervals included unity. Total activity and moderate-to-vigorous physical activity hazard ratios from analyses only excluding deaths within the first 2 years were inflated by 13 and 26% relative to analysis restricted to ≥5 years of follow-up.
Conclusions: The pattern of associations suggested total physical activity and moderate-to-vigorous physical activity were associated with lower mortality after more than 10 years of follow-up and excluding the first 5 years of observation time to minimize the impact of reverse causation bias. Excluding deaths within the first 2 years appeared insufficient to minimize the impact of reserve causation bias.
Keywords: Cohort study; Epidemiology; Exercise; Leisure activity.
Conflict of interest statement
The authors declare that they have no competing interests.
Figures
Similar articles
-
Associations of Accelerometry-Assessed and Self-Reported Physical Activity and Sedentary Behavior With All-Cause and Cardiovascular Mortality Among US Adults.Am J Epidemiol. 2016 Nov 1;184(9):621-632. doi: 10.1093/aje/kww070. Epub 2016 Oct 19. Am J Epidemiol. 2016. PMID: 27760774 Free PMC article.
-
Dose-response associations between accelerometry measured physical activity and sedentary time and all cause mortality: systematic review and harmonised meta-analysis.BMJ. 2019 Aug 21;366:l4570. doi: 10.1136/bmj.l4570. BMJ. 2019. PMID: 31434697 Free PMC article.
-
Accelerometer-measured dose-response for physical activity, sedentary time, and mortality in US adults.Am J Clin Nutr. 2016 Nov;104(5):1424-1432. doi: 10.3945/ajcn.116.135129. Epub 2016 Oct 5. Am J Clin Nutr. 2016. PMID: 27707702 Free PMC article.
-
Accelerometry-assessed physical activity and sedentary time and associations with chronic disease and hospital visits - a prospective cohort study with 15 years follow-up.Int J Behav Nutr Phys Act. 2019 Dec 9;16(1):125. doi: 10.1186/s12966-019-0878-2. Int J Behav Nutr Phys Act. 2019. PMID: 31818303 Free PMC article.
-
Replacing Sedentary Time: Meta-analysis of Objective-Assessment Studies.Am J Prev Med. 2018 Sep;55(3):395-402. doi: 10.1016/j.amepre.2018.04.042. Am J Prev Med. 2018. PMID: 30122216 Review.
Cited by
-
Fitness, Fatness, and Mortality in Men and Women From the UK Biobank: Prospective Cohort Study.J Am Heart Assoc. 2021 Mar 16;10(6):e019605. doi: 10.1161/JAHA.120.019605. Epub 2021 Mar 13. J Am Heart Assoc. 2021. PMID: 33715383 Free PMC article.
-
Associations of Objectively Measured Physical Activity and Sedentary Time with the Risk of Stroke, Myocardial Infarction or All-Cause Mortality in 70-Year-Old Men and Women: A Prospective Cohort Study.Sports Med. 2021 Feb;51(2):339-349. doi: 10.1007/s40279-020-01356-y. Sports Med. 2021. PMID: 33063268 Free PMC article.
-
Device-measured physical activity, adiposity and mortality: a harmonised meta-analysis of eight prospective cohort studies.Br J Sports Med. 2022 Jul;56(13):725-732. doi: 10.1136/bjsports-2021-104827. Epub 2021 Dec 7. Br J Sports Med. 2022. PMID: 34876405 Free PMC article.
-
Spanish Costaleros' Physical Activity and Their Quality of Life.Sensors (Basel). 2020 Oct 2;20(19):5641. doi: 10.3390/s20195641. Sensors (Basel). 2020. PMID: 33023151 Free PMC article.
-
Associations of Daily Steps and Step Intensity With Incident Diabetes in a Prospective Cohort Study of Older Women: The OPACH Study.Diabetes Care. 2022 Feb 1;45(2):339-347. doi: 10.2337/dc21-1202. Diabetes Care. 2022. PMID: 35050362 Free PMC article.
References
-
- Jefferis Barbara J, Parsons Tessa J, Sartini Claudio, Ash Sarah, Lennon Lucy T, Papacosta Olia, Morris Richard W, Wannamethee S Goya, Lee I-Min, Whincup Peter H. Objectively measured physical activity, sedentary behaviour and all-cause mortality in older men: does volume of activity matter more than pattern of accumulation? British Journal of Sports Medicine. 2018;53(16):1013–1020. doi: 10.1136/bjsports-2017-098733. - DOI - PMC - PubMed
Publication types
MeSH terms
LinkOut - more resources
Full Text Sources
Medical
