. 2020 Mar 14;18(1):127.
doi: 10.1186/s12967-020-02291-2.

Profiling the Salivary microbiome of the Qatari population

Affiliations

Profiling the Salivary microbiome of the Qatari population

Selvasankar Murugesan et al. J Transl Med. .

Abstract

Background: The role of the human microbiome in human health and disease has been studied in various body sites. However, compared to the gut microbiome, where most of the research focus is, the salivary microbiome still bears a vast amount of information that needs to be revealed. This study aims to characterize the salivary microbiome composition in the Qatari population, and to explore specific microbial signatures that can be associated with various lifestyles and different oral conditions.

Materials and methods: We characterized the salivary microbiome of 997 Qatari adults using high-throughput sequencing of the V1-V3 region of the 16S rRNA gene.

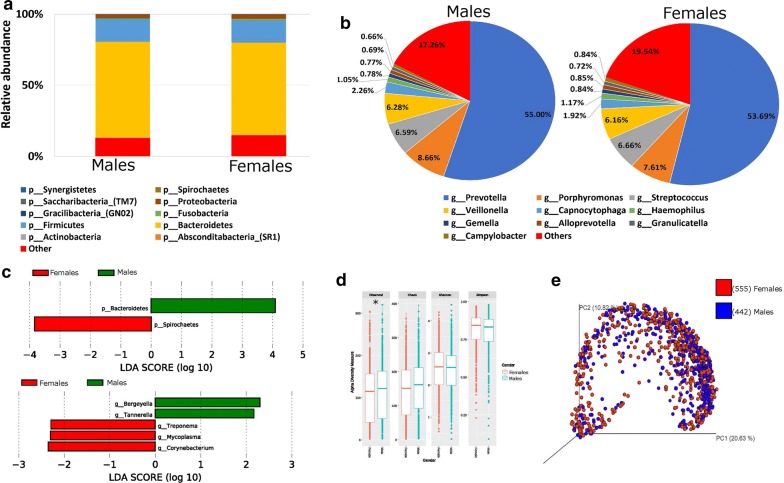
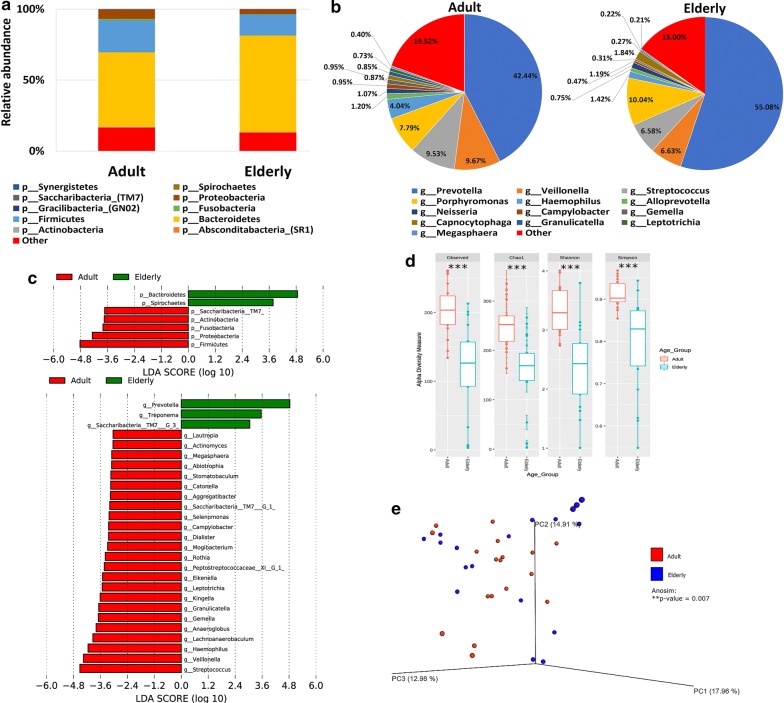
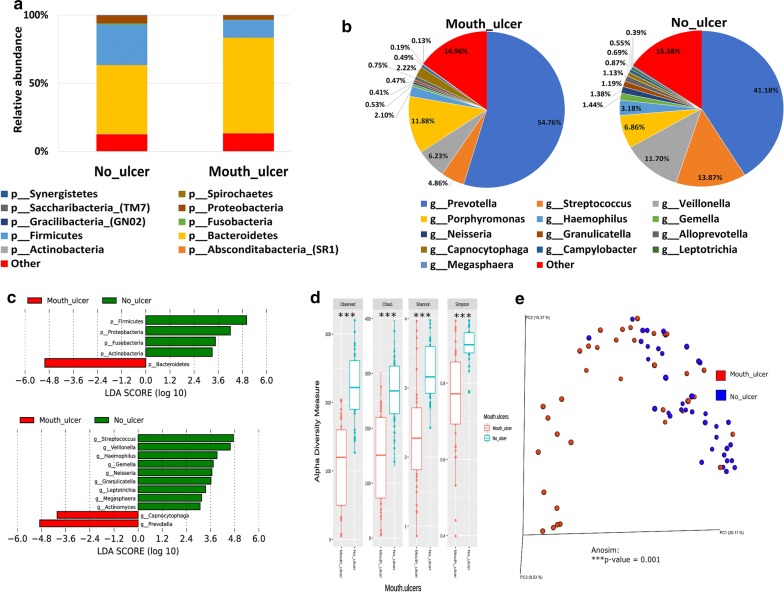
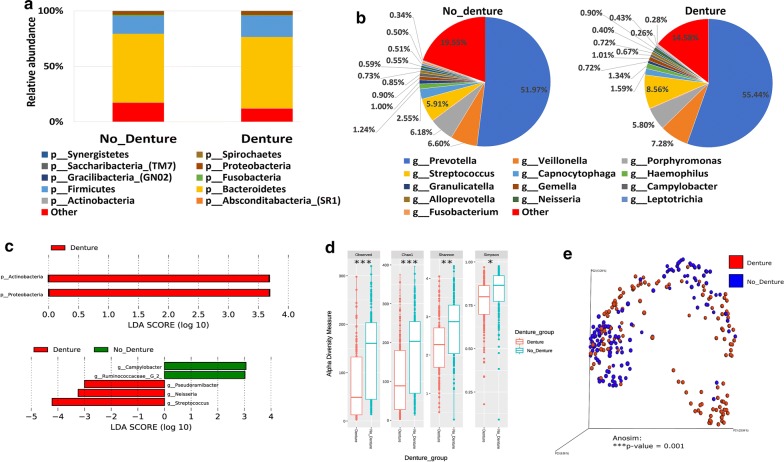
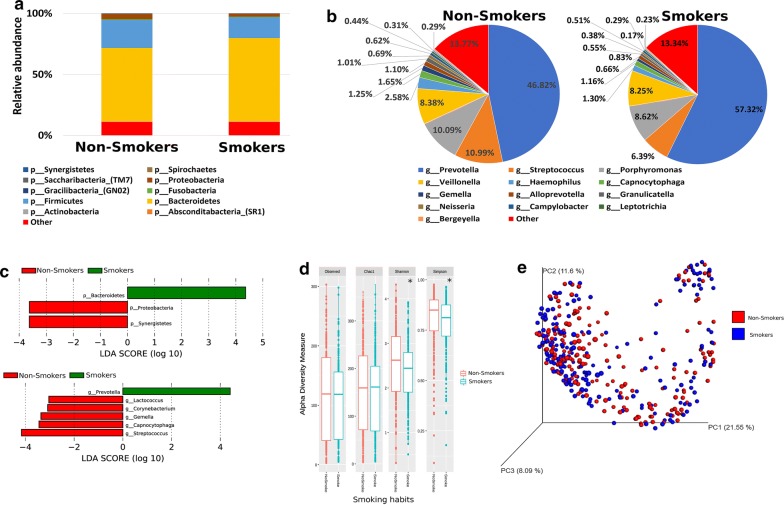
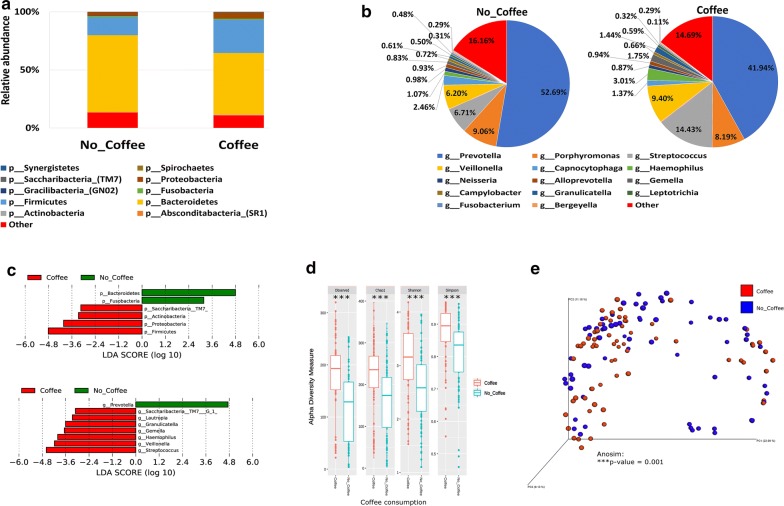
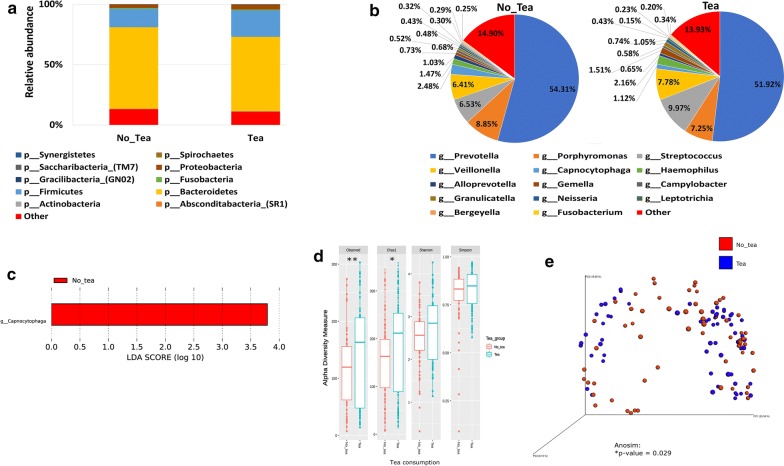
Results: In this study, we have characterized the salivary microbiome of 997 Qatari participants. Our data show that Bacteroidetes, Firmicutes, Actinobacteria and Proteobacteria are the common phyla isolated from the saliva samples, with Bacteroidetes being the most predominant phylum. Bacteroidetes was also more predominant in males versus females in the study cohort, although differences in the microbial diversity were not statistically significant. We also show that, a lower diversity of the salivary microbiome is observed in the elderly participants, with Prevotella and Treponema being the most significant genera. In participants with oral conditions such as mouth ulcers, bleeding or painful gum, our data show that Prevotella and Capnocytophaga are the most dominant genera as compared to the controls. Similar patterns were observed in participants with various smoking habits as compared to the non-smoking participants. Our data show that Streptococcus and Neisseria are more dominant among denture users, as compared to the non-denture users. Our data also show that, abnormal oral conditions are associated with a reduced microbial diversity and microbial richness. Moreover, in this study we show that frequent coffee drinkers have higher microbial diversity compared to the non-drinkers, indicating that coffee may cause changes to the salivary microbiome. Furthermore, tea drinkers show higher microbial richness as compared to the non-tea drinkers.

Conclusion: This is the first study to assess the salivary microbiome in an Arab population, and one of the largest population-based studies aiming to the characterize the salivary microbiome composition and its association with age, oral health, denture use, smoking and coffee-tea consumption.

Keywords: 16S rRNA gene sequencing; Dysbiosis; Oral health; Qatar Biobank; Qatari; Saliva.


Conflict of interest statement

The authors declare no conflict of interests.

Figures

Fig. 1
Fig. 1
Gender and the salivary microbiome. Y-axis shows % of relative abundance; X-axis indicates the microbial abundance in males and females; each taxonomic category is shown by a different color: a at the phylum level; b at the genus level; c graphs of linear discriminant analysis (LDA) scores for differentially abundant bacterial phyla and genera; among the two groups. LDA scores indicate overrepresented bacteria in males (green) and females (red). Features with LDA scores ≥ 2 are presented. d Alpha diversity measures for the two groups. Alpha diversity was measured by the number of OTUs observed or by the Chao1, Shannon and Simpson diversity measures; e Principle Coordinates Analysis (PCoA) based on Bray–Curtis dissimilarities of salivary microbiome. Axes are scaled to the amount of variation explained; *P < 0.05
Fig. 2
Fig. 2
The salivary microbiome composition and aging. Y-axis shows % of relative abundance; X-axis indicates the microbial abundance in males and females; each taxonomic category is shown by a different color: a at the phylum level; b at the genus level; c graphs of linear discriminant analysis (LDA) scores for differentially abundant bacterial phyla and genera; among the two groups. LDA scores indicate overrepresented bacteria in Elderly (green) and Adults (red). Features with LDA scores ≥ 2 are presented. d Alpha diversity measures for the two groups. Alpha diversity was measured by the number of OTUs observed or by the Chao1, Shannon and Simpson diversity measures; e Principle Coordinates Analysis (PCoA) based on Bray–Curtis dissimilarities of salivary microbiome. Axes are scaled to the amount of variation explained; ***P < 0.001
Fig. 3
Fig. 3
Bleeding gum and the salivary microbiome composition. Y-axis shows % of relative abundance; X-axis indicates the microbial abundance in males and females; each taxonomic category is shown by a different color: a at the phylum level; b at the genus level; c graphs of linear discriminant analysis (LDA) scores for differentially abundant bacterial phyla and genera; among the two groups. LDA scores indicate overrepresented bacteria in individuals that did not report bleeding (green) and the participants that reported bleeding gums (red). Features with LDA scores ≥ 2 are presented. d Alpha diversity measures for the two groups. Alpha diversity was measured by the number of OTUs observed or by the Chao1, Shannon and Simpson diversity measures; e Principle Coordinates Analysis (PCoA) based on Bray–Curtis dissimilarities of salivary microbiome. Axes are scaled to the amount of variation explained; **P < 0.01, ***P < 0.001
Fig. 4
Fig. 4
Mouth ulceration and the salivary microbiome composition. Y-axis shows % of relative abundance; X-axis indicates the microbial abundance in males and females; each taxonomic category is shown by a different color: a at the phylum level; b at the genus level; c graphs of linear discriminant analysis (LDA) scores for differentially abundant bacterial phyla and genera; among the two groups. LDA scores indicate overrepresented bacteria in individuals that did not report any mouth ulcer (green) and the participants that reported having mouth ulcers (red). Features with LDA scores ≥ 2 are presented. d Alpha diversity measures for the two groups. Alpha diversity was measured by the number of OTUs observed or by the Chao1, Shannon and Simpson diversity measures; e Principle Coordinates Analysis (PCoA) based on Bray–Curtis dissimilarities of salivary microbiome. Axes are scaled to the amount of variation explained; ***P < 0.001
Fig. 5
Fig. 5
Denture use and the salivary microbiome composition. Y-axis shows % of relative abundance; X-axis indicates the microbial abundance in males and females; each taxonomic category is shown by a different color: a at the phylum level; b at the genus level; c graphs of linear discriminant analysis (LDA) scores for differentially abundant bacterial phyla and genera; among the two groups. LDA scores indicate overrepresented bacteria in individuals that did not use dentures (green) and the participants that reported using dentures (red). Features with LDA scores ≥ 2 are presented. d Alpha diversity measures for the two groups. Alpha diversity was measured by the number of OTUs observed or by the Chao1, Shannon and Simpson diversity measures; e Principle Coordinates Analysis (PCoA) based on Bray–Curtis dissimilarities of salivary microbiome. Axes are scaled to the amount of variation explained; *P < 0.05, **P < 0.01, ***P < 0.001
Fig. 6
Fig. 6
The salivary microbiome composition is influenced by smoking habits. Y-axis shows % of relative abundance; X-axis indicates the microbial abundance in males and females; each taxonomic category is shown by a different color: a at the phylum level; b at the genus level; c graphs of linear discriminant analysis (LDA) scores for differentially abundant bacterial phyla and genera; among the two groups. LDA scores indicate overrepresented bacteria in smokers (green) and non- smokers (red). Features with LDA scores ≥ 2 are presented. d Alpha diversity measures for the two groups. Alpha diversity was measured by the number of OTUs observed or by the Chao1, Shannon and Simpson diversity measures; e Principle Coordinates Analysis (PCoA) based on Bray–Curtis dissimilarities of salivary microbiome. Axes are scaled to the amount of variation explained; *P < 0.05
Fig. 7
Fig. 7
Influence of Coffee consumption on the salivary microbiome composition. Y-axis shows % of relative abundance; X-axis indicates the microbial abundance in males and females; each taxonomic category is shown by a different color: a at the phylum level; b at the genus level; c graphs of linear discriminant analysis (LDA) scores for differentially abundant bacterial phyla and genera; among the two groups. LDA scores indicate overrepresented bacteria in individuals that do not drink coffee (green) and the participants that are considered coffee drinkers (red). Features with LDA scores ≥ 2 are presented. d Alpha diversity measures for the two groups. Alpha diversity was measured by the number of OTUs observed or by the Chao1, Shannon and Simpson diversity measures; e Principle Coordinates Analysis (PCoA) based on Bray–Curtis dissimilarities of salivary microbiome. Axes are scaled to the amount of variation explained; ***P < 0.001
Fig. 8
Fig. 8
Influence of tea consumption on the salivary microbiome composition. Y-axis shows % of relative abundance; X-axis indicates the microbial abundance in males and females; each taxonomic category is shown by a different color: a at the phylum level; b at the genus level; c Graphs of linear discriminant analysis (LDA) scores for differentially abundant bacterial phyla and genera; among the two groups. Features with LDA scores ≥ 2 are presented. d Alpha diversity measures for the two groups. Alpha diversity was measured by the number of OTUs observed or by the Chao1, Shannon and Simpson diversity measures; e Principle Coordinates Analysis (PCoA) based on Bray–Curtis dissimilarities of salivary microbiome. Axes are scaled to the amount of variation explained; *P < 0.05, **P < 0.01

Similar articles

Cited by

References

    1. Lloyd-Price J, Abu-Ali G, Huttenhower C. The healthy human microbiome. Genome Med. 2016;8:51. doi: 10.1186/s13073-016-0307-y. - DOI - PMC - PubMed
    1. Liang D, Leung RK, Guan W, Au WW. Involvement of gut microbiome in human health and disease: brief overview, knowledge gaps and research opportunities. Gut Pathog. 2018;10:3. doi: 10.1186/s13099-018-0230-4. - DOI - PMC - PubMed
    1. Cao Y, Fanning S, Proos S, Jordan K, Srikumar S. A review on the applications of next generation sequencing technologies as applied to food-related microbiome studies. Front Microbiol. 1829;2017:8. - PMC - PubMed
    1. Costello EK, Lauber CL, Hamady M, Fierer N, Gordon JI, Knight R. Bacterial community variation in human body habitats across space and time. Science. 2009;326:1694–1697. doi: 10.1126/science.1177486. - DOI - PMC - PubMed
    1. Roblegg E, Coughran A, Sirjani D. Saliva: an all-rounder of our body. Eur J Pharm Biopharm. 2019;142:133–141. doi: 10.1016/j.ejpb.2019.06.016. - DOI - PubMed

Publication types

Substances

LinkOut - more resources