. 2020 Apr 2;26(4):569-578.e7.
doi: 10.1016/j.stem.2020.02.008. Epub 2020 Mar 12.

Plasticity of Lgr5-Negative Cancer Cells Drives Metastasis in Colorectal Cancer

Affiliations

Plasticity of Lgr5-Negative Cancer Cells Drives Metastasis in Colorectal Cancer

Arianna Fumagalli et al. Cell Stem Cell. .

Abstract

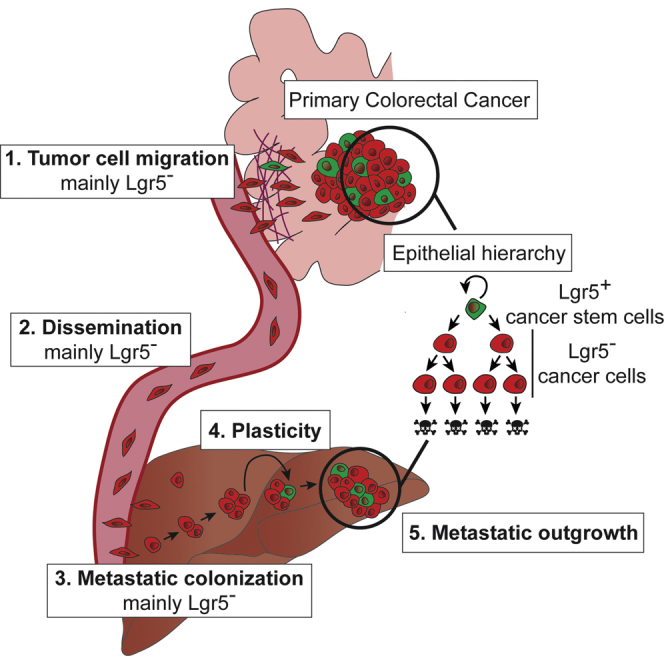
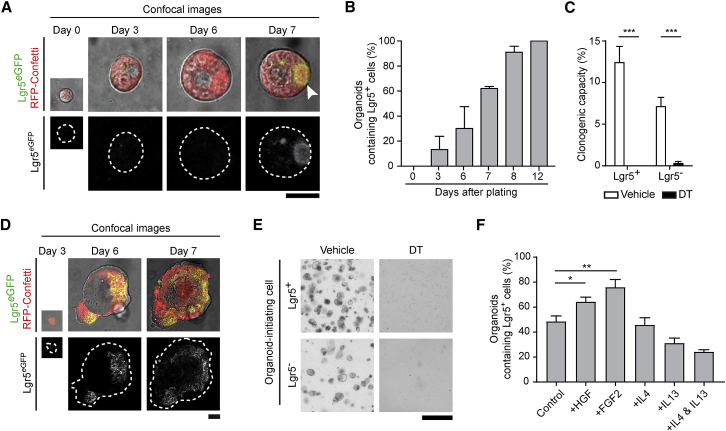
Colorectal cancer stem cells (CSCs) express Lgr5 and display extensive stem cell-like multipotency and self-renewal and are thought to seed metastatic disease. Here, we used a mouse model of colorectal cancer (CRC) and human tumor xenografts to investigate the cell of origin of metastases. We found that most disseminated CRC cells in circulation were Lgr5- and formed distant metastases in which Lgr5+ CSCs appeared. This plasticity occurred independently of stemness-inducing microenvironmental factors and was indispensable for outgrowth, but not establishment, of metastases. Together, these findings show that most colorectal cancer metastases are seeded by Lgr5- cells, which display intrinsic capacity to become CSCs in a niche-independent manner and can restore epithelial hierarchies in metastatic tumors.

Keywords: Lgr5; cancer stem cells; circulating tumor cells; colorectal cancer; intravital microscopy; metastasis; microenvironment; plasticity.


Conflict of interest statement

Declaration of Interests The authors declare no competing interests.

Figures

None
Graphical abstract
Figure 1
Figure 1
Generation of a Colorectal Cancer Mouse Model to Visualize Lgr5+ CSCs (A) Schematic overview of the inducible fluorescent CRC mouse model generated to visualize Lgr5+ CSCs. (B) Diphtheria toxin (DT) treatment of CRC Lgr5eGFP organoids. Representative confocal images of the effect of vehicle or DT on organoid growth. Scale bar, 100 μm. (C) Prolonged diphtheria toxin (DT) treatment of mice orthotopically transplanted with CRC Lgr5eGFP organoids. Average tumor growth upon vehicle or DT treatment (n = 5). p < 0.05 and ∗∗p < 0.001. Data are presented as mean ± SEM; p values were calculated using the Mann-Whitney U test. (D) Representative examples of primary tumors and livers of mice subjected to either vehicle or DT treatment for 8 weeks. Dashed lines highlight primary tumor edges, arrowheads indicate macroscopic metastatic lesions. (E) Clonogenicity assay of sorted Lgr5+ CSCs and Lgr5 cancer cells derived from CRC organoid cultures and orthotopic colorectal primary tumors. Data were collected 6 days after plating (n = 3 independent experiments). Values are presented as mean ± SEM; p values calculated using the unpaired t test with Welch’s correction. (F) Heatmap of differentially expressed transcripts in cancer cells derived from two independent biological replicates of organoids and orthotopic primary tumors. Genes marked in green are known to be upregulated in intestinal stem cells; genes marked in red are known intestinal differentiated cell markers.
Figure 2
Figure 2
The Majority of Cells Escaping the Primary Colorectal Tumors Are Lgr5 (A) Representative time-lapse intravital images of a non-migratory field within a CRC primary tumor. Note that the resolution of in vivo images is lower than of ex vivo images because of great depth of imaging in living animals. Scale bar, 50 μm. (B) Time-lapse intravital images of a migratory field showing primary tumor cell migration of Lgr5 and cancer cells (ROI, region of interest 1) and Lgr5+ CSCs (ROI2). Dashed lines highlight the migratory cells, continuous lines mark the migratory tracks overtime. Scale bars, 50 μm. See also Videos S1 and S2. (C) Representative time-lapse intravital images of Lgr5+ CSCs (upper panel) and Lgr5 cancer cells (lower panel) moving as cell clusters (see also Videos S3 and S4). Scale bars, 50 μm. (D) Display of the migratory tracks of Lgr5+ CSCs and Lgr5 cancer cells observed in (A) (left) and in (B) (right). (E) Distribution of total displacement of Lgr5+ (green) and Lgr5 (red) migratory cells over a period of 4 h. (F) Characterization of Lgr5+ CSCs and Lgr5 cancer cells migratory mode (i.e., cells escaping as single cells or as cell clusters (i.e., maintaining cell-cell contact). Data are presented as mean ± SEM (n = 9); p values were calculated using the unpaired t test with Welch’s correction. (G and H) In vivo displacement (G) and velocity (H) of escaping Lgr5+ CSCs and Lgr5 cancer cells. Each data point represents a cell. ∗∗∗∗p < 0.0001. Red lines indicate median ± interquartile range; p values were calculated using the Mann-Whitney U test. (I) Fraction of escaping Lgr5+ CSCs and Lgr5 cancer cells observed in vivo in individual mice. Different shapes represent different animals (n = 9). Each data point indicates the average value per animal. ∗∗∗∗p < 0.0001. Red lines indicate mean ± SEM; p value was calculated using the unpaired t test.
Figure 3
Figure 3
Lgr5 Cancer Cells Are the Disseminating Cells in CRC (A) Experimental setup: mice bearing metastatic CRC were used to sample blood from the portal vein. Blood was analyzed using FACS for the presence of circulating tumor cells. (B) Cumulative FACS profile of circulating Lgr5+ CSCs and Lgr5 cancer cells (n = 4). The color coding links individual circulating tumor cells to the corresponding blood sample in Figure S3B. (C) Heatmap of differentially expressed genes in Lgr5+ and Lgr5 cancer cells isolated from primary tumors, CTCs, and liver metastasis. Genes marked with green are known to be upregulated in intestinal stem cells; genes marked in red indicate known intestinal differentiated cell markers. (D) Representative confocal images of spontaneous liver metastases grouped per diameter range. Dashed lines highlight the metastasis edges. Scale bar, 100 μm. (E) Metastases are subdivided in lesions composed of only Lgr5 cancer cells (red) or lesions containing Lgr5+ CSCs (green) and grouped per diameter range (the analysis includes 132 metastatic lesions, n = 6). (F) Intravital multi-day imaging of liver metastases hatching from Lgr5 cancer cells. Dashed lines highlight metastasis edges. Yellow boxed areas are enlarged next to the corresponding panels. Scale bars, 50 μm. (G) Representative images of a liver metastasis followed overtime by intravital imaging demonstrating growth and regression upon depletion of Lgr5+ CSCs via diphtheria toxin (DT) administration. Dashed lines highlight metastasis border. Scale bar, 100 μm. (H) Size of DT-treated metastatic lesions followed by intravital imaging (n = 5), normalized to the first time point. The red line represents the example shown in (G). (I) Representative histochemistry images of livers of mice subjected mesenteric vein injection of FACS-sorted Lgr5 cancer cells and treated with either vehicle or DT treatment for 4 weeks. ROI, region of interest. Asterisks indicate metastatic foci; dashed lines highlight metastasis edges. Boxed areas are enlarged next to the corresponding overview images. Scale bars, 500 μm. (J) Representative examples of livers of mice of mice subjected mesenteric vein injection of CRC Lgr5eGFP and treated with either vehicle or DT treatment for 4 weeks. (K) Number of metastatic foci derived from mesenteric vein injection of Lgr5+ CSCs or Lgr5 cancer cells. (L) Metastatic load upon injection of Lgr5+ CSCs or Lgr5 cancer cells. Similar shapes represent paired experiments (n = 4). Data are presented as median with interquartile range; p values were calculated using the paired t test (p < 0.05). (M–O) Representative examples of metastases generated from Lgr5+ CSCs (M) and Lgr5 cancer cells (N), boxed area enlarged in (O). Scale bars, 100 μm.
Figure 4
Figure 4
Disseminating Lgr5 Cancer Cells Undergo Niche-Independent Cellular Plasticity (A) Representative example of organoid formation assay of sorted Lgr5 circulating cancer cells. Dashed lines highlight organoids edges. Arrowhead indicates the appearance of a Lgr5+ CSC. Scale bar, 20 μm. (B) Quantification of cancer cell plasticity (i.e., emergence of Lgr5+ CSCs) in the organoid-forming assay of sorted Lgr5 circulating cancer cells grown in minimal CRC medium. Data are presented as mean ± SEM (n = 3 independent experiments). (C) Clonogenicity assay in minimal CRC medium of sorted Lgr5+ CSCs and Lgr5 cancer cells derived from CRC organoid cultures. Single cells were subjected to either vehicle or diphtheria toxin (DT) treatment (n = 3 independent experiments). Data were collected 6 days after plating. Values are presented as mean ± SEM; ∗∗∗p < 0.0001, calculated using the unpaired t test with Welch’s correction. (D) Representative example of organoid formation assay of sorted Lgr5 cancer cells cultured in synthetic hydrogel. Dashed lines highlight organoids edges. Scale bar, 50 μm. (E) Representative images of the effect of vehicle or diphtheria toxin (DT) on sorted Lgr5+ CSCs and Lgr5 cancer cells cultured in synthetic hydrogel 6 days after plating (n = 3 independent experiments). Scale bar, 200 μm. (F) Quantification of cancer cell plasticity (i.e., emergence of Lgr5+ CSCs) of sorted Lgr5 cancer cells grown in either minimal CRC medium (control) or medium containing FGF-2 (10 ng/mL), HGF (75 ng/mL), IL4 (20 ng/mL), IL13 (100 ng/mL), and IL4 and IL13. n = 3 independent experiments. p < 0.05 and ∗∗p < 0.001, calculated using the unpaired t test. Data are represented as mean ± SEM.

Comment in

References

    1. Al-Hajj M., Wicha M.S., Benito-Hernandez A., Morrison S.J., Clarke M.F. Prospective identification of tumorigenic breast cancer cells. Proc. Natl. Acad. Sci. U S A. 2003;100:3983–3988. - PMC - PubMed
    1. Batlle E., Clevers H. Cancer stem cells revisited. Nat. Med. 2017;23:1124–1134. - PubMed
    1. Beck B., Blanpain C. Unravelling cancer stem cell potential. Nat. Rev. Cancer. 2013;13:727–738. - PubMed
    1. Beerling E., Seinstra D., de Wit E., Kester L., van der Velden D., Maynard C., Schäfer R., van Diest P., Voest E., van Oudenaarden A. Plasticity between epithelial and mesenchymal states unlinks EMT from metastasis-enhancing stem cell capacity. Cell Rep. 2016;14:2281–2288. - PMC - PubMed
    1. Bonnet D., Dick J.E. Human acute myeloid leukemia is organized as a hierarchy that originates from a primitive hematopoietic cell. Nat. Med. 1997;3:730–737. - PubMed

Publication types