. 2020 May 20;106(4):566-578.e8.
doi: 10.1016/j.neuron.2020.02.015. Epub 2020 Mar 12.

Whole-Neuron Synaptic Mapping Reveals Spatially Precise Excitatory/Inhibitory Balance Limiting Dendritic and Somatic Spiking

Affiliations

Whole-Neuron Synaptic Mapping Reveals Spatially Precise Excitatory/Inhibitory Balance Limiting Dendritic and Somatic Spiking

Daniel Maxim Iascone et al. Neuron. .

Abstract

The balance between excitatory and inhibitory (E and I) synapses is thought to be critical for information processing in neural circuits. However, little is known about the spatial principles of E and I synaptic organization across the entire dendritic tree of mammalian neurons. We developed a new open-source reconstruction platform for mapping the size and spatial distribution of E and I synapses received by individual genetically-labeled layer 2/3 (L2/3) cortical pyramidal neurons (PNs) in vivo. We mapped over 90,000 E and I synapses across twelve L2/3 PNs and uncovered structured organization of E and I synapses across dendritic domains as well as within individual dendritic segments. Despite significant domain-specific variation in the absolute density of E and I synapses, their ratio is strikingly balanced locally across dendritic segments. Computational modeling indicates that this spatially precise E/I balance dampens dendritic voltage fluctuations and strongly impacts neuronal firing output.


Conflict of interest statement

Declaration of Interests The authors declare no competing interests.

Figures

Figure 1.
Figure 1.. Spatial and morphological annotation of synapses across whole neurons with Synapse Detector.
(A) Sparsely labeled layer 2/3 pyramidal neuron (PN). Scale bar: 500 microns. Inset, higher magnification of neuron shown in A. (B) Single-synapse resolution image volume compiled from 3 adjacent tissue sections containing a complete layer 2/3 PN expressing tdTomato. (C) Neuron trace of B (left) and rotated to display the tissue section plane (right). Each color (Magenta, silver and green) represents parts of the dendritic arbor traced and stitched from individual adjacent sections. (D) Dendritic spines annotated throughout the basal dendritic arbor of B (top panel). Scale bar: 50 microns. Annotated spines (green in middle panel), and inhibitory Gephyrin-eGFP labeled synapses contained (blue in bottom panel) from top panel inset. Scale bar: 5 microns. (E) Neuron trace of B annotated with Subtree Labeling program. Scale bar: 50 microns. (F) From left to right: tdTomato volume from inset in E, corresponding trace, overlaid spine annotations, and inhibitory synaptic annotations associated with nodes within the trace. Scale bar: 2 microns.
Figure 2.
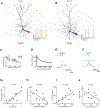
Figure 2.. Synaptic distribution profile for layer 2/3 somatosensory PNs
(A-B) Example of complete reconstruction of 8115 dendritic spines (green in A) and 1045 I synapses (blue in B) throughout the dendritic tree of a single layer 2/3 PN (Neuron 1; red cell-filler, tdTomato). (C) From left to right: box plots showing the distribution of dendritic length, dendritic spine number, dendritic spine density, inhibitory synaptic number, inhibitory synaptic density, and dually innervated spine proportions for all layer 2/3 PNs mapped in this study. Scale bar: A-B, 50 microns.
Figure 3.
Figure 3.. Domain organization of synaptic distribution and morphology
(A) A schematic diagram of a L2/3 PN depicting the domains (black boxes) and branch types (black primary; green, intermediate; and purple, terminal). (B) The density of E (orange line) and I (blue line) synapses across dendritic branch types of L2/3 PNs. (C) Heat maps of E (left) and I (right) synaptic distribution indicating regions of low density in cyan and high density in red. (D) A heat map of inhibitory synaptic distribution in which yellow puncta represent inhibitory synapses targeted to dendritic spines. Note the increased density of these dually innervated spines toward the distal apical tufts. (E) The proportion of inhibitory synapses made onto dendritic spines across dendritic branch types. (F) A heat map of inhibitory synaptic distribution in which yellow puncta represent the 20th percentile of inhibitory synapses by volume for each domain type. Note the increased density of these large inhibitory synapses in apical intermediate segments. (G) The proportion of large excitatory (orange) and inhibitory (blue) synapses across dendritic branch types. For all plots, *p < 0.05, **p < 0.005, ***p < 0.001, and ****P<0.0001. See STAR Methods for details. sAll data are presented as mean ± SEM.
Figure 4.
Figure 4.. Structured synaptic distribution within branch types
(A) Variation in excitatory synaptic density (orange) across dendritic branch types of L2/3 PNs compared to 10,000 randomizations of each synaptic distribution within the same domains (5th to 95th percentiles gray). (B) Variation in inhibitory synaptic density (blue) across dendritic branch types of L2/3 PNs compared to randomized synaptic distributions (gray). (C) Example trace of apical tuft dendrites depicting the breakdown of the arbor into branch types (trunk: black, intermediate: green, and terminal: purple). (D) Excitatory (top) and inhibitory (bottom) synapses from segments isolated from the dendritic arbor in C. Terminal tuft segments (left) display significant variation in E and I synaptic density while intermediate tuft segments (right) do not. Scale bar: 1 micron.
Figure 5.
Figure 5.. Local E/I balance within branch types
(A) Heat map of local E/I balance. Densities of E and I synapses were normalized to 1, and the absolute value of their difference is mapped within an adaptive range of each point within the dendritic tree (see STAR Methods). Values close to 0 therefore represent points on the dendritic tree at which the relative densities of E and I synapses were close to equivalent (Max), and values close to 1 represent points at which the relative densities of E and I synapses were much different from one another (Min). (B) Relation between E and I synaptic density for intermediate (green; R2 = 0.002; p > 0.05) and terminal (purple; R2 = 0.20; p < 6.6e−13) apical dendritic segments. (C) Relation between E and I synaptic density for primary (black), intermediate (green; R2 = 0.08; p < 0.0007), and terminal (purple; R2 = 0.24; p < 5.3e−19) basal dendritic segments. For all plots, *p < 0.05, **p < 0.005, and ***p < 0.001. See STAR Methods for details. All data are presented as mean ± SEM.
Figure 6.
Figure 6.. Models predict large variability in the firing rate of L2/3 PNs.
(A) The reconstructed morphology of Neuron #7. Excitatory synapses were placed on the experimentally-measured locations of the respective dendritic spines (5,604 E synapses in total); inhibitory synapses (619 in total) were placed at their experimentally-measured location. The E- and I- synapses were activated as described in STAR Methods. Simulated membrane voltage was recorded from modeled soma (trace at bottom right). (B) As in A, with the morphology and traces belonging to Neuron #4 (5,661 excitatory synapses and 785 inhibitory synapses). (C) Backpropagating action potentials, BPAP, in L2/3 PNs attenuate along the apical trunk (taken from the experiments in (Waters et al., 2003)). Y-axis shows the amplitude of the BPAP as a function of distances from the soma along the apical trunk; both in vivo (empty dots) and in vitro (solid dots) cases are shown. (D) Same as in C, in the simulated model of neuron #2. (E) Action potential amplitude recorded 80 μm from the soma in the apical trunk, with and without TTX (from (Waters et al., 2003)). (F) Same as in E, in model neuron #2. (G) Correlation between somatic firing rate and the global E/I ratio for all 10 modeled neurons; (filled circles). Pearson coefficient is shown above the graph. Red and blue dots correspond to neurons #7 and #4 shown in A and B, respectively. (H) Same as in G, with the x-axis showing the neuron’s surface area. (I) Total number of synapses as a function of the total dendritic surface area. (J) Global E/I ratio measured experimentally as a function of the total dendritic surface area.
Figure 7.
Figure 7.. Domain-specific E/I balance within L2/3 PNs dampens local dendritic voltage fluctuations, strongly affecting the global output firing rate.
(A) Left. Modeled L2/3 neuron (#2) in the case in which the E/I ratio is constant for all branches belonging to the distal apical domain (zero E/I SD, the balance case). Right. Voltage traces in all distal apical branches for the modeled neuron shown at left following synaptic activation (green traces). In this simulation the E synapses (6,274 in total) and I synapses (1,111 in total) were distributed in a balanced fashion (schematically shown at left). Back propagating action potentials are marked by an asterisk. (B) Same as in A for the case of maximal E/I SD (the unbalanced case). In both A and B, the total number of E and I synapses in the distal apical domain is fixed as found experimentally (same global balance for the two cases). Note that back-propagating action potentials (large depolarizing transient) exhibit higher frequencies in the unbalanced case. (C) The probability of voltage integral for all branches in the basal terminal domain at the modeled neuron. The distribution of the dendritic voltage time-integral expected for the experimentally-measured case (blue line) closely fits that expected in the balanced case (green line); both are narrower and less depolarized as compared to that obtained in the unbalanced case (purple line). (D) The average voltage time-integral for all segments in the basal terminal domain as a function of E/I SD in this domain (see STAR Methods). The open circles represent the biologically measured E/I SD values for each neuron. Numbers correspond to neuron numbers in Figure S4. (E) As in D for the basal intermediate segments. (F) Correlation between the somatic firing rate and the global E/I ratio for the 10 modeled neurons. In each neuron (numbered vertical lines), the domain-specific E/I SD was varied from the fully balanced case (blue) to the maximally unbalanced case (red). Numbers at each vertical line correspond to the modeled neuron identity. In all cases, the numbers of E and I synapses were taken from the experimental counts. Details of synaptic activation is described in STAR Methods.

Similar articles

Cited by

References

    1. Acciai L, Soda P, and Iannello G (2016). Automated Neuron Tracing Methods: An Updated Account. Neuroinformatics 14, 353–367. - PubMed
    1. Alonso-Nanclares L, White EL, Elston GN, and DeFelipe J (2004). Synaptology of the proximal segment of pyramidal cell basal dendrites. Eur J Neurosci 19, 771–776. - PubMed
    1. Arellano JI, Benavides-Piccione R, Defelipe J, and Yuste R (2007). Ultrastructure of dendritic spines: correlation between synaptic and spine morphologies. Front Neurosci 1, 131–143. - PMC - PubMed
    1. Ascoli GA (2006). Mobilizing the base of neuroscience data: the case of neuronal morphologies. Nat Rev Neurosci 7, 318–324. - PubMed
    1. Atasoy D, Aponte Y, Su HH, and Sternson SM (2008). A FLEX switch targets Channelrhodopsin- 2 to multiple cell types for imaging and long-range circuit mapping. J Neurosci 28, 7025–7030. - PMC - PubMed

Publication types

LinkOut - more resources