. 2020 Mar 19;180(6):1212-1227.e14.
doi: 10.1016/j.cell.2020.02.020. Epub 2020 Mar 12.

Initiation of Parental Genome Reprogramming in Fertilized Oocyte by Splicing Kinase SRPK1-Catalyzed Protamine Phosphorylation

Affiliations

Initiation of Parental Genome Reprogramming in Fertilized Oocyte by Splicing Kinase SRPK1-Catalyzed Protamine Phosphorylation

Lan-Tao Gou et al. Cell. .

Abstract

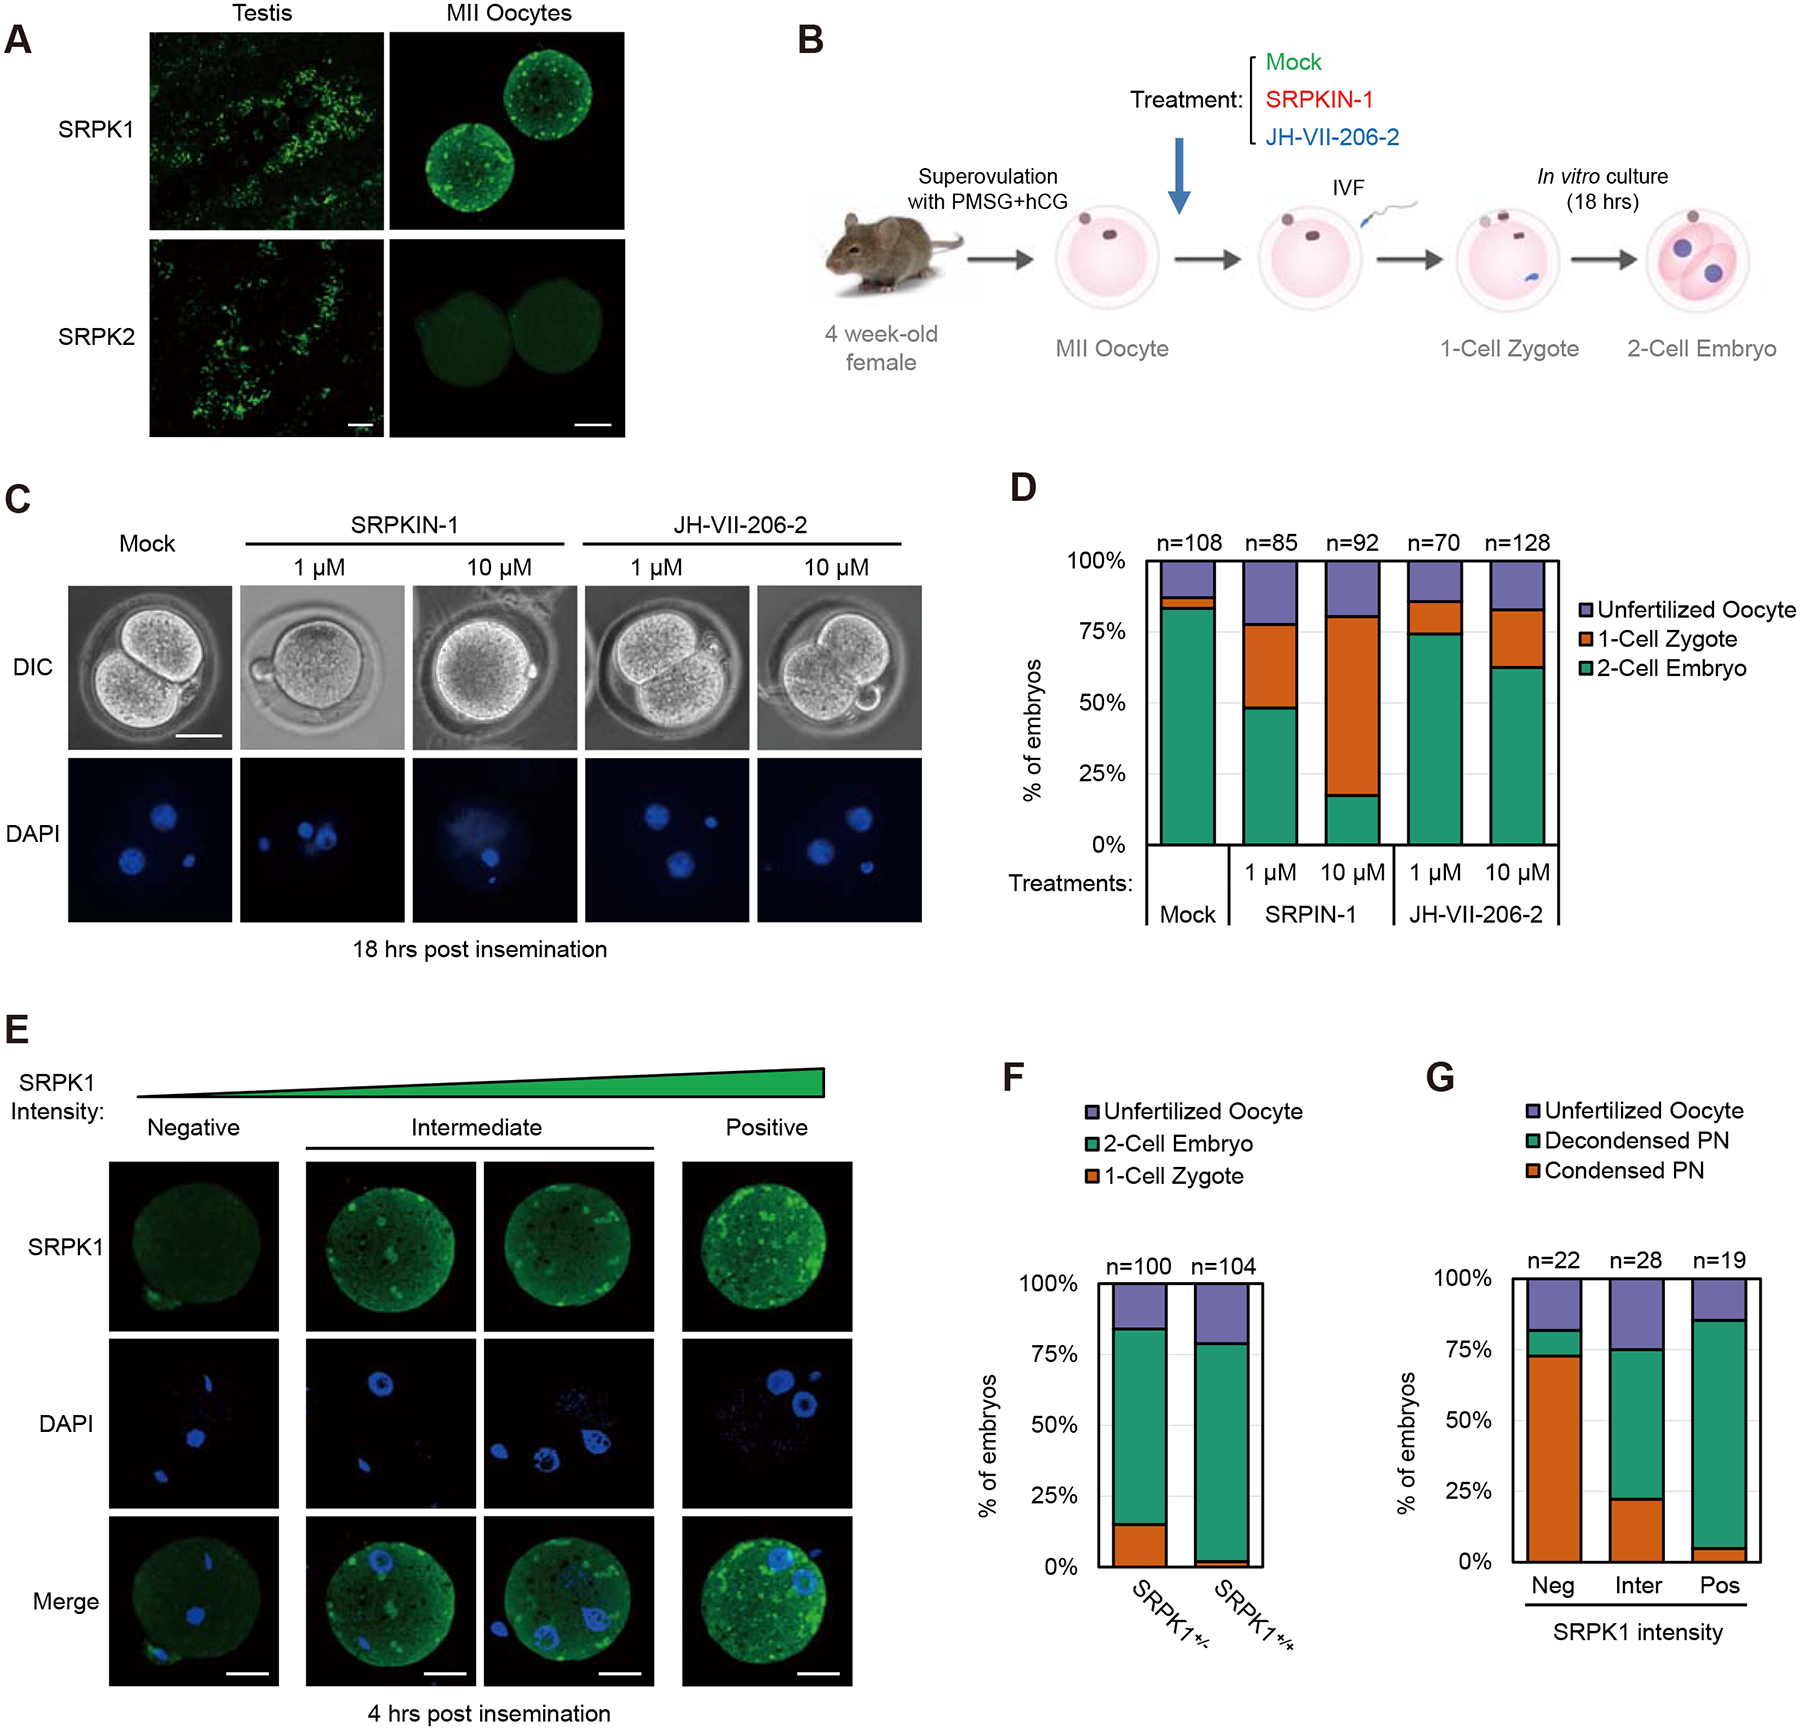
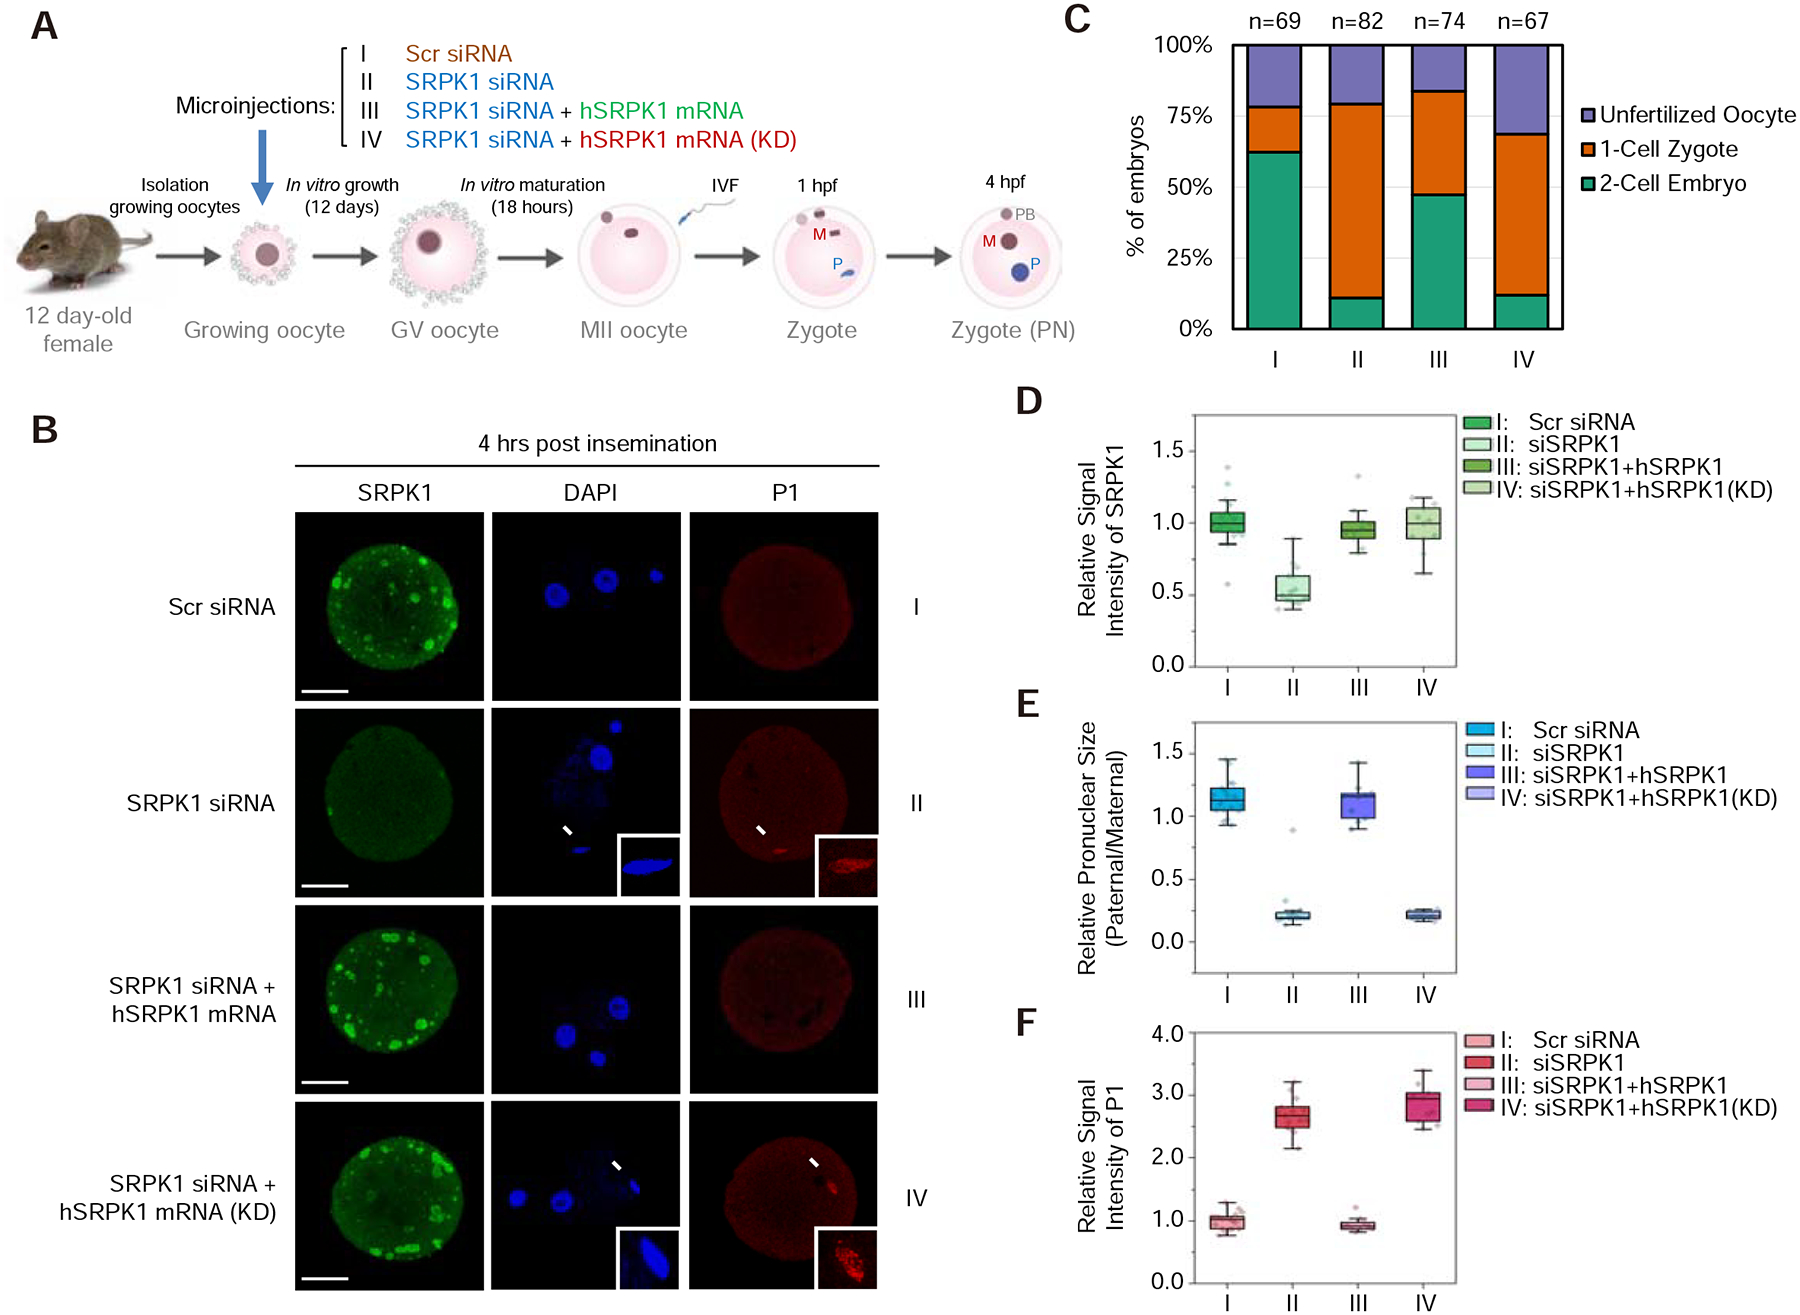
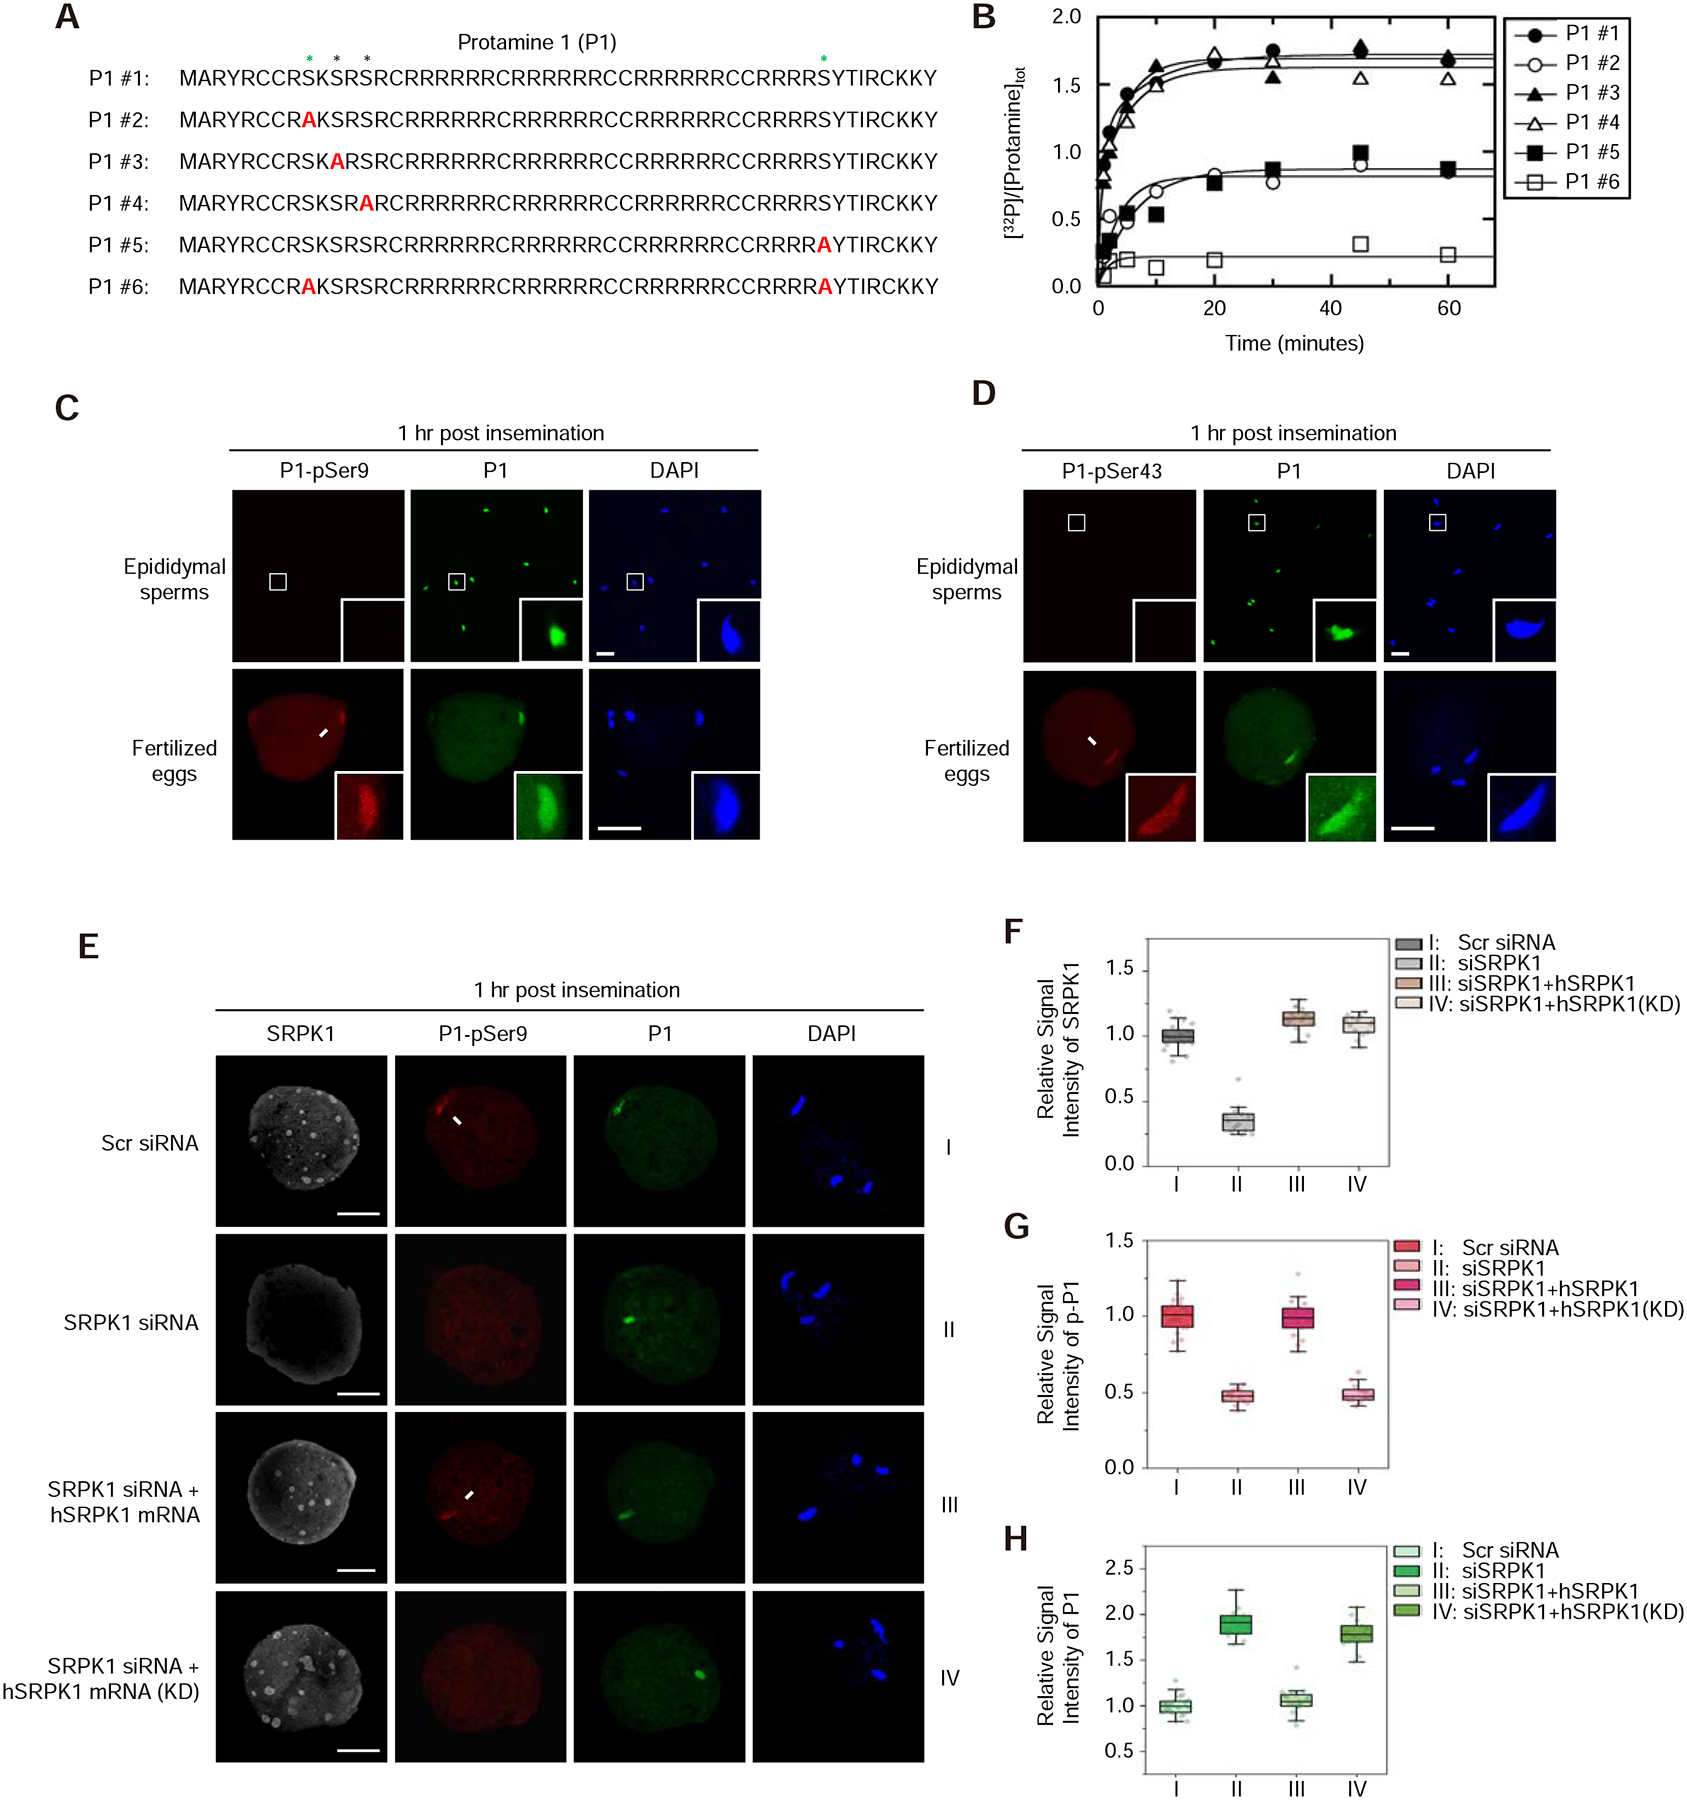
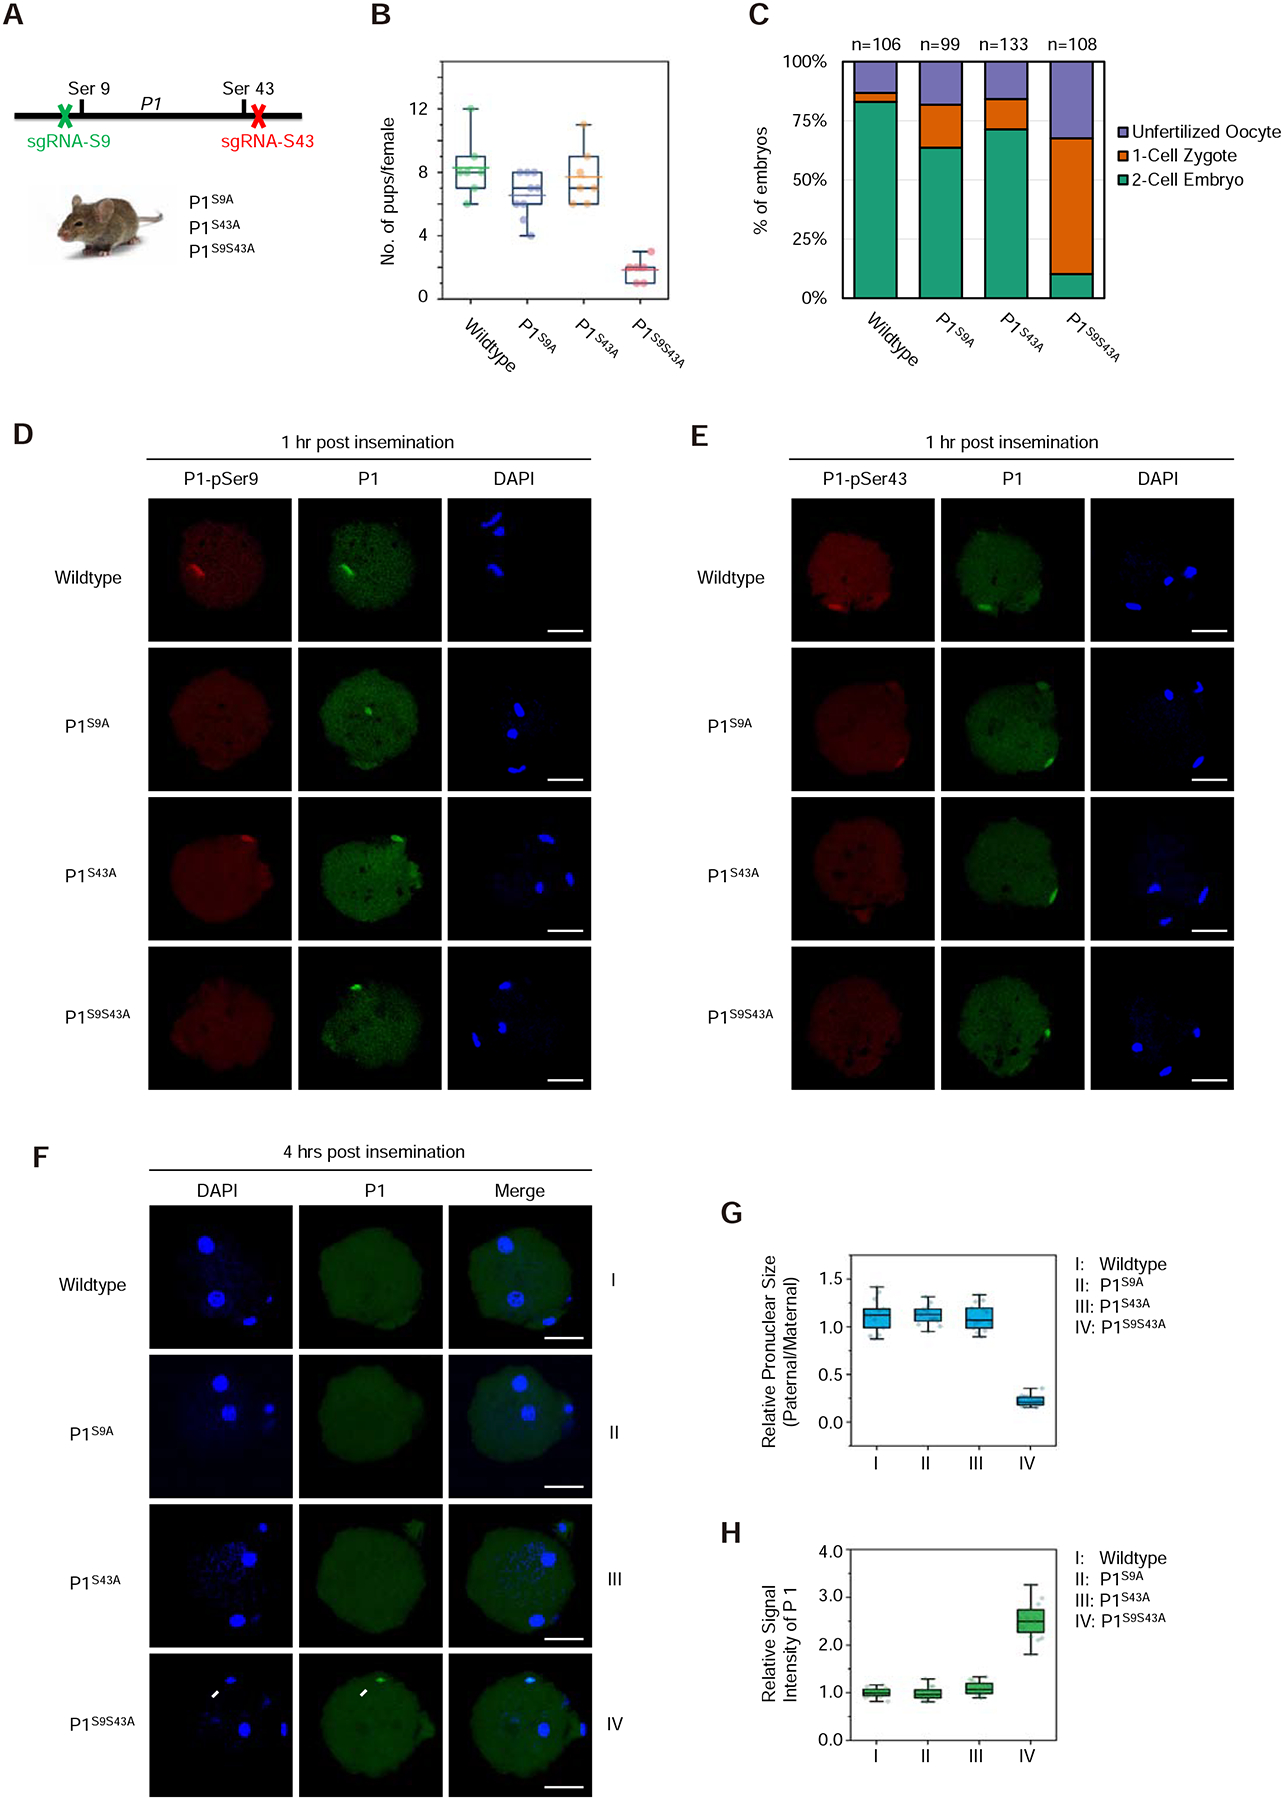
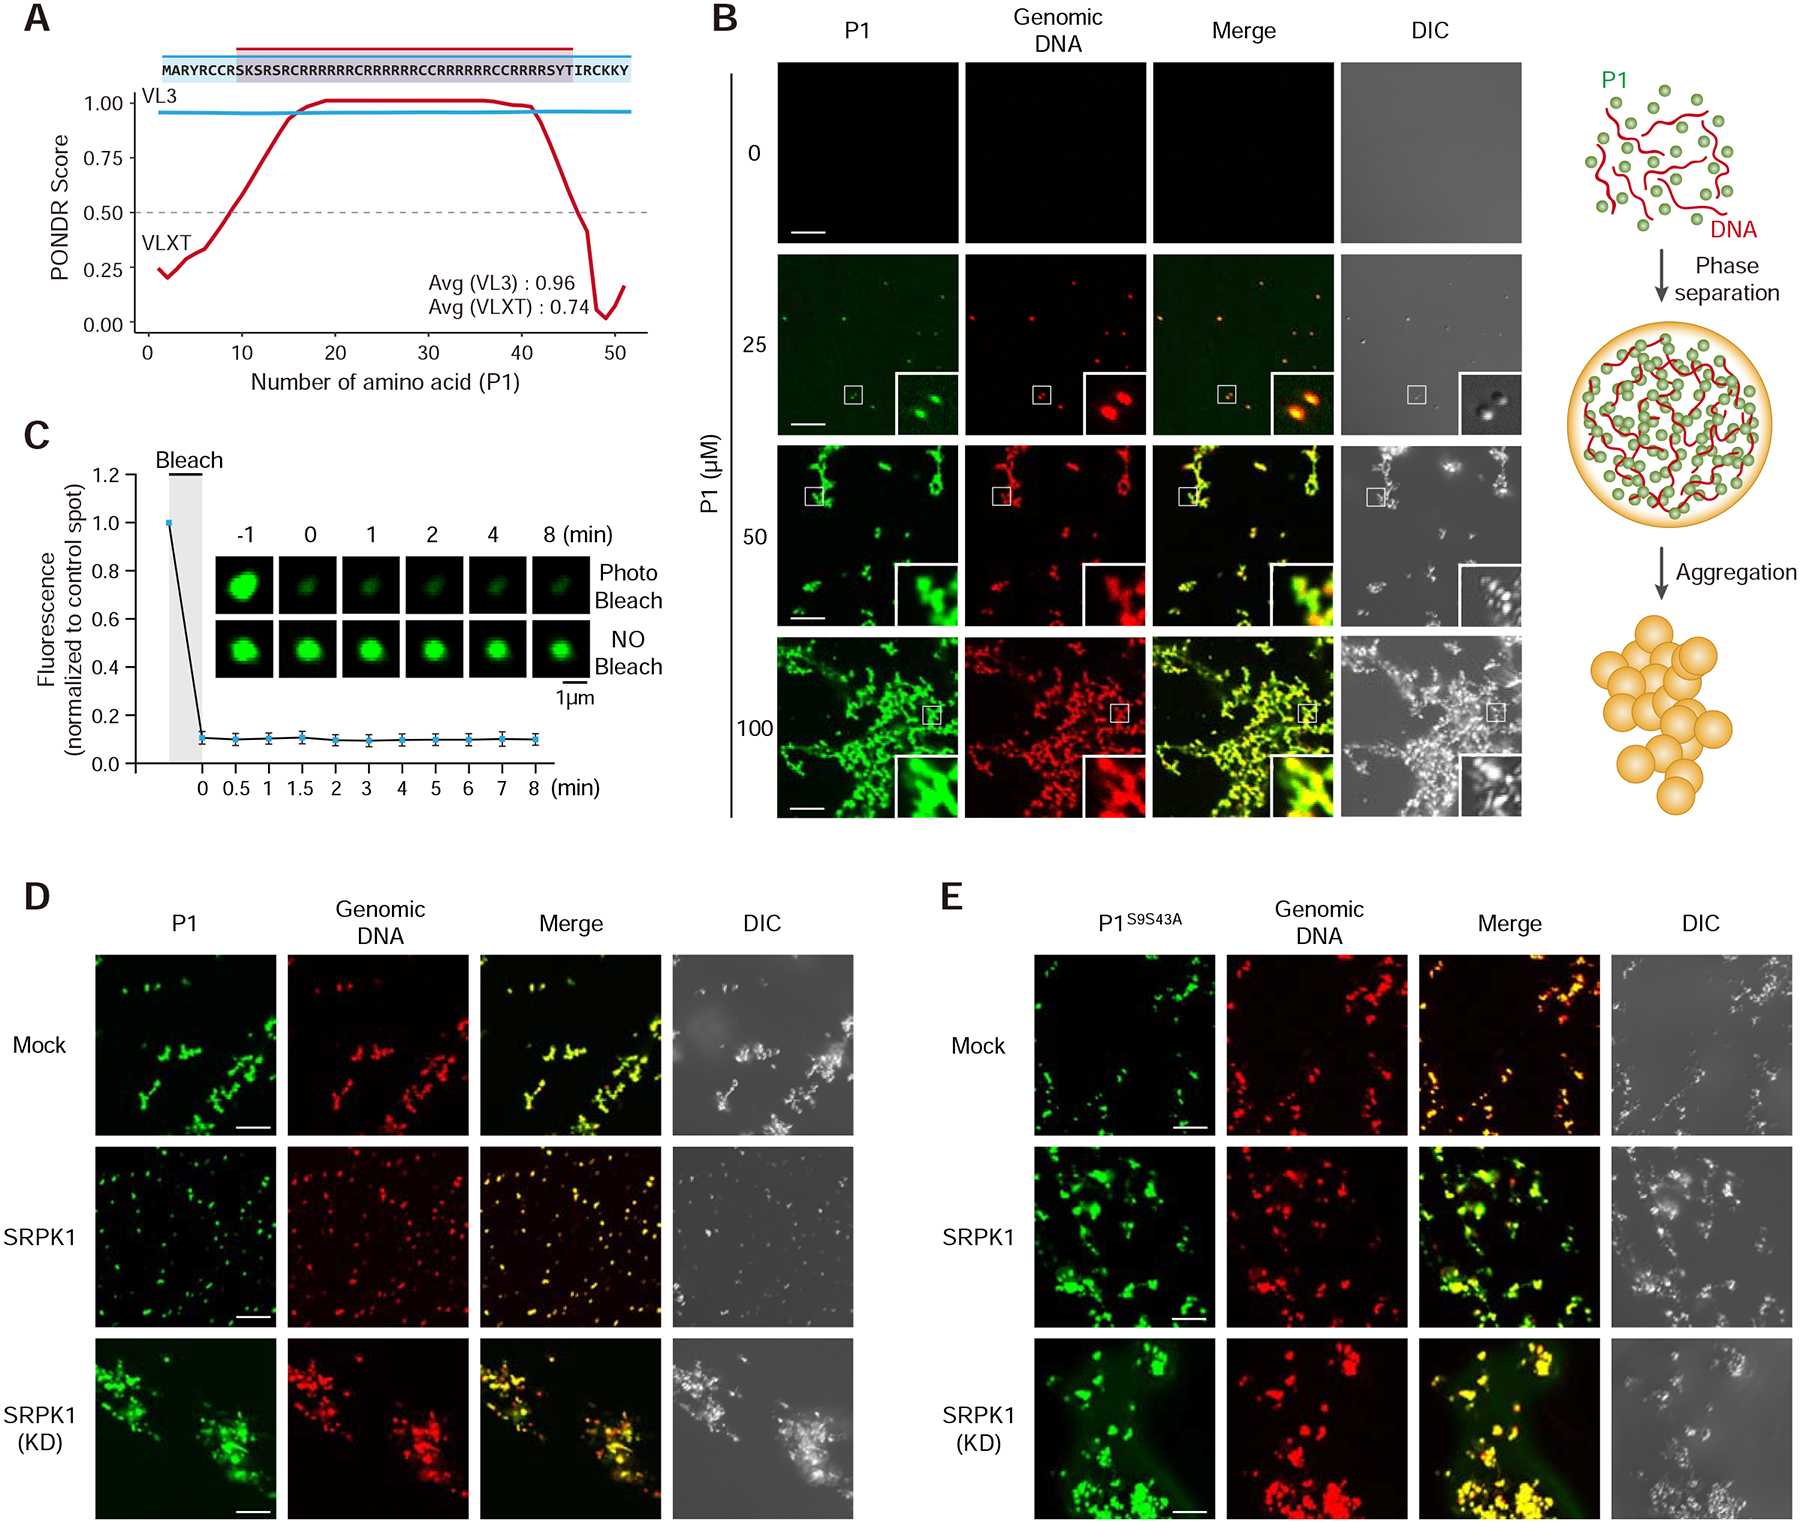
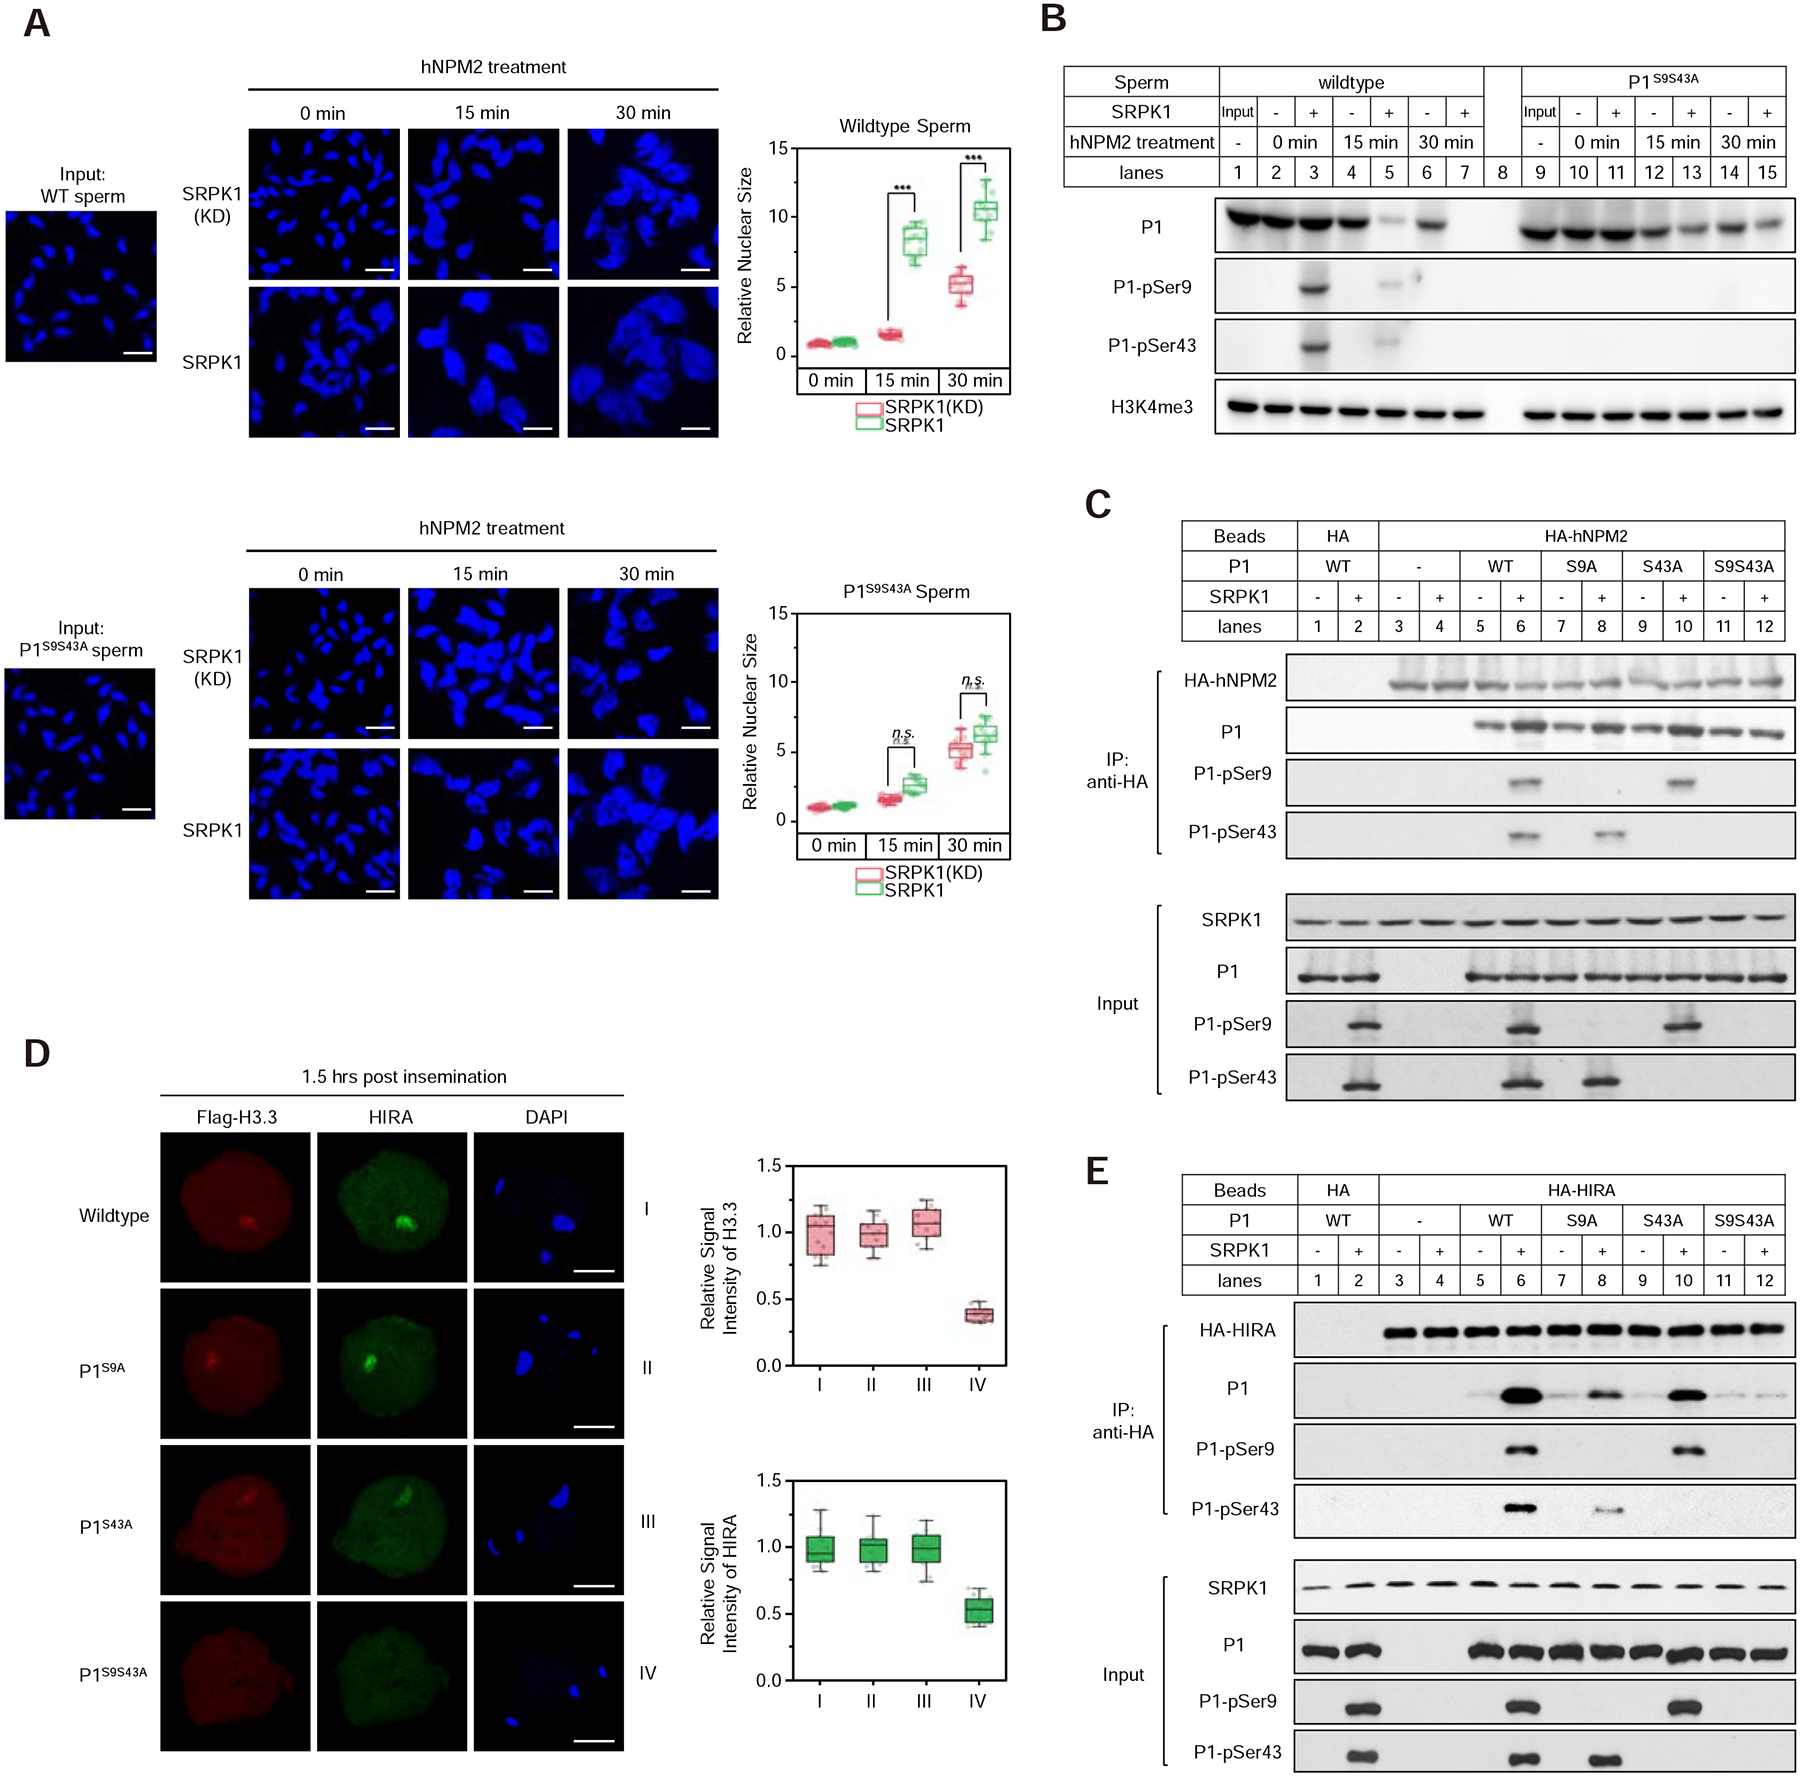
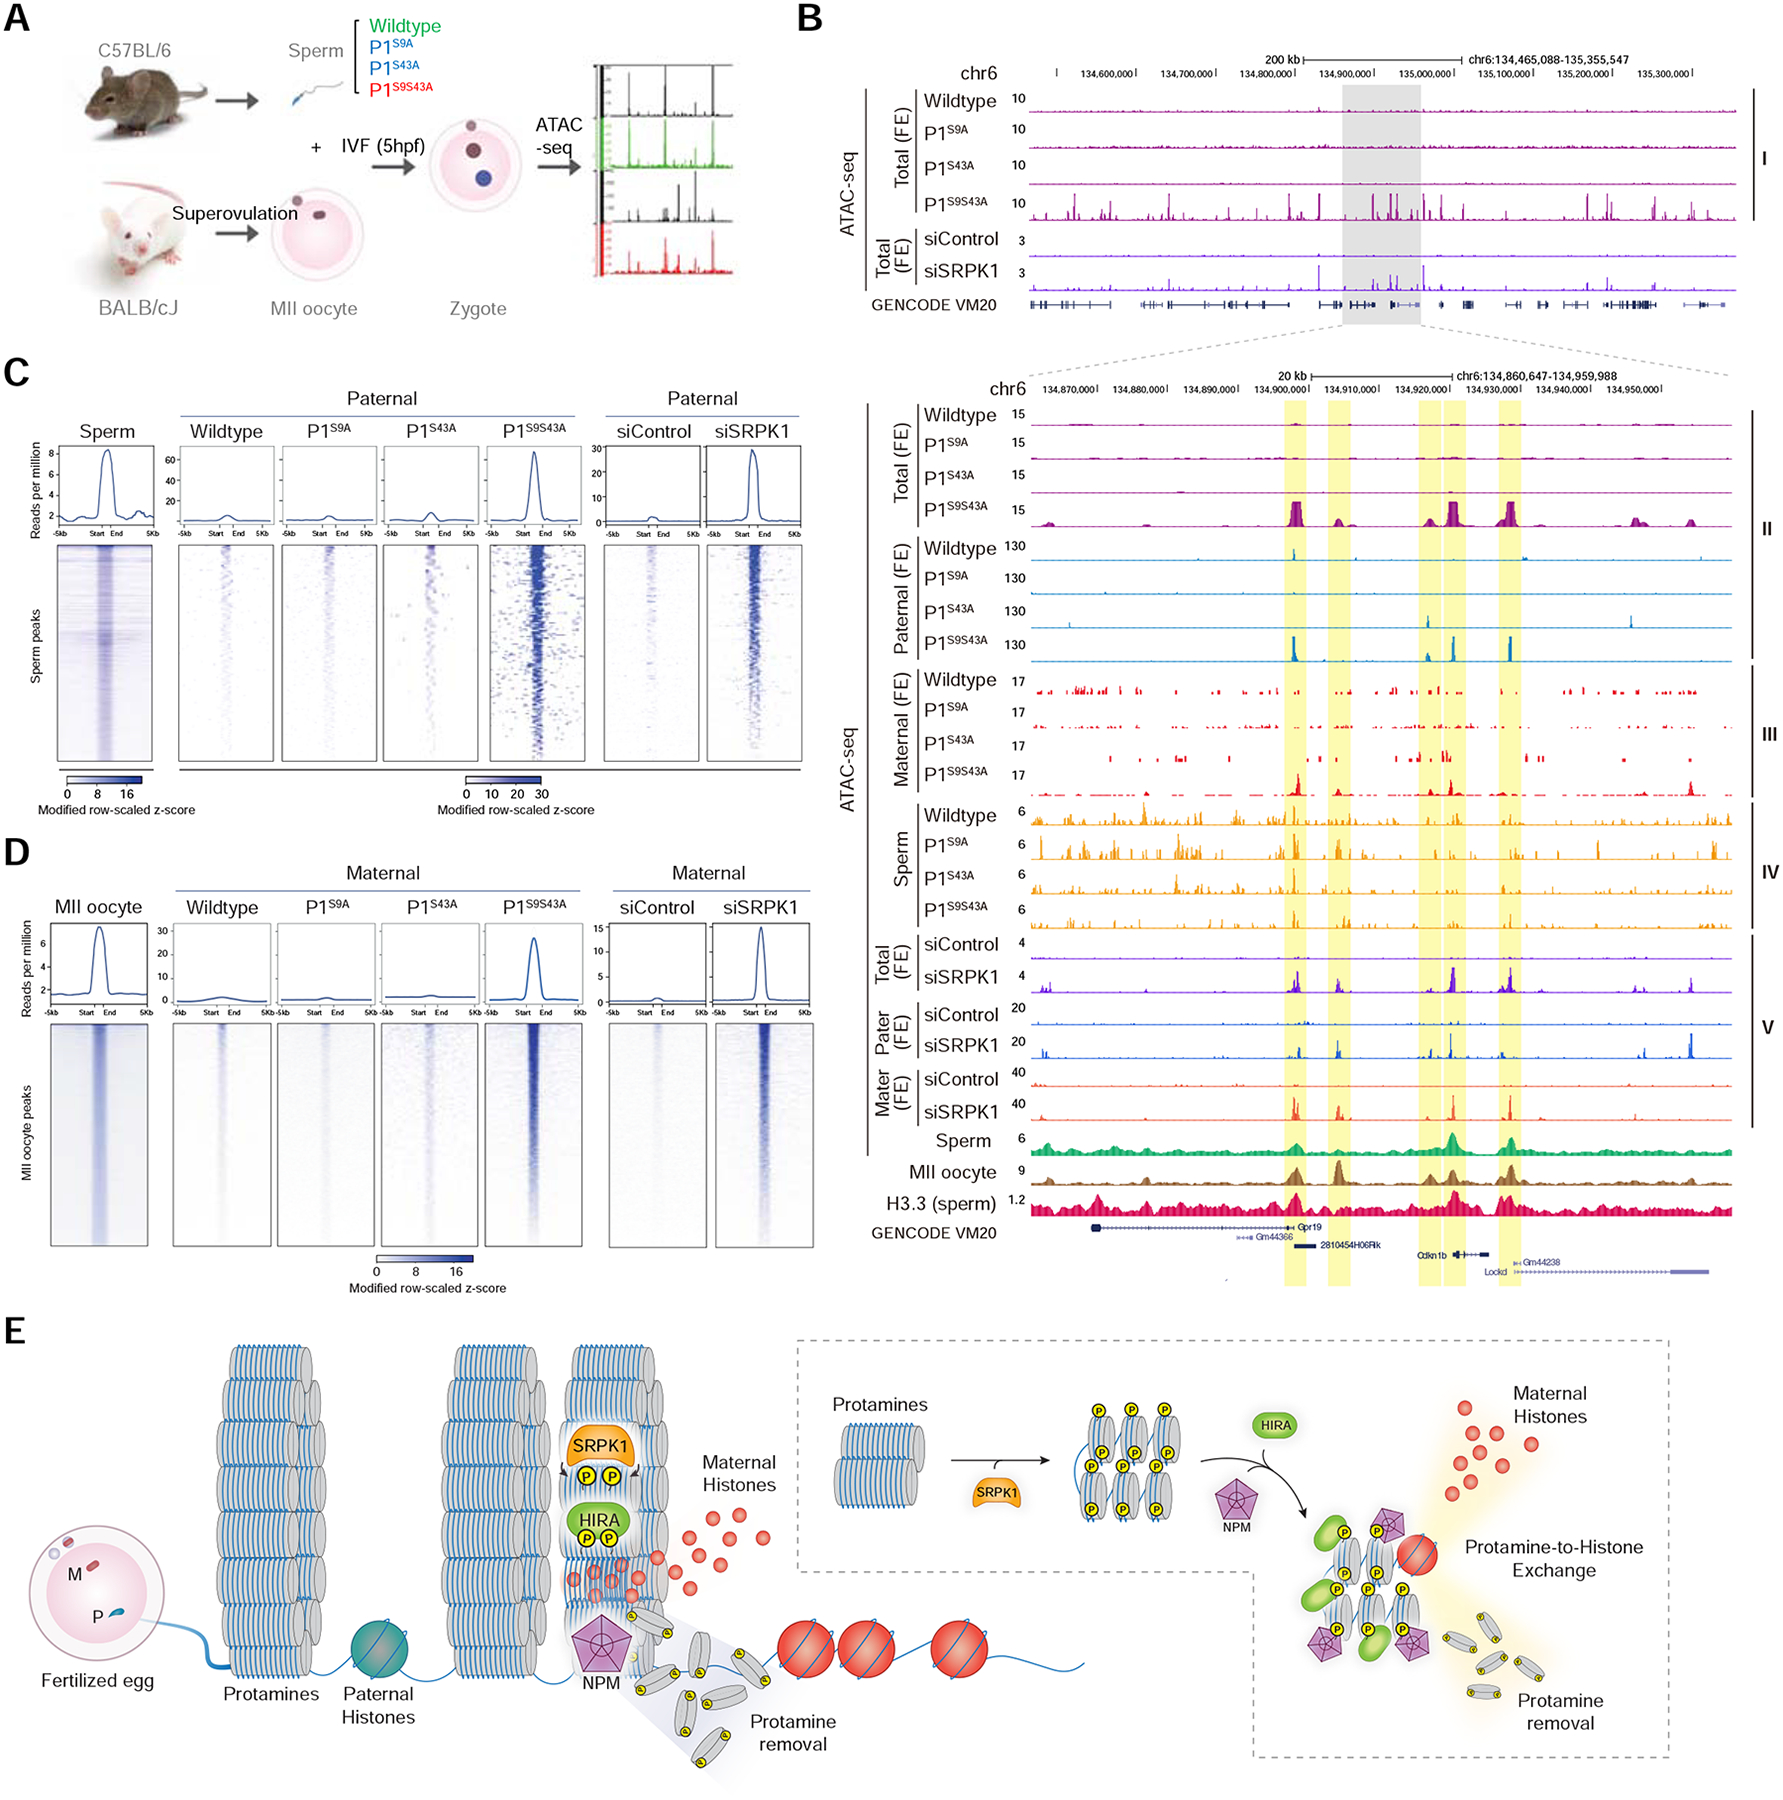
The paternal genome undergoes a massive exchange of histone with protamine for compaction into sperm during spermiogenesis. Upon fertilization, this process is potently reversed, which is essential for parental genome reprogramming and subsequent activation; however, it remains poorly understood how this fundamental process is initiated and regulated. Here, we report that the previously characterized splicing kinase SRPK1 initiates this life-beginning event by catalyzing site-specific phosphorylation of protamine, thereby triggering protamine-to-histone exchange in the fertilized oocyte. Interestingly, protamine undergoes a DNA-dependent phase transition to gel-like condensates and SRPK1-mediated phosphorylation likely helps open up such structures to enhance protamine dismissal by nucleoplasmin (NPM2) and enable the recruitment of HIRA for H3.3 deposition. Remarkably, genome-wide assay for transposase-accessible chromatin sequencing (ATAC-seq) analysis reveals that selective chromatin accessibility in both sperm and MII oocytes is largely erased in early pronuclei in a protamine phosphorylation-dependent manner, suggesting that SRPK1-catalyzed phosphorylation initiates a highly synchronized reorganization program in both parental genomes.

Keywords: SR protein-specific kinase; fertilization; genome reprogramming; histone chaperones; phosphorylation; protamine; protamine-to-histone exchange; zygotic development.


Conflict of interest statement

Declaration of Interests The authors declare no competing financial interests.

Figures

Figure 1.
Figure 1.. Inhibition of SRPK1 arrested fertilized oocytes at the 1-cell stage
(A) Immunostaining of mouse testis and MII oocyte for SRPK1 and SRPK2. Scale bar, 20 μm. See Figure S1A for negative staining with anti-SRPK2 in comparison without primary antibody. (B) Scheme for treatment with an SRPK1 inhibitor during in vitro fertilization (IVF). SRPKIN-1 is a specific SRPK1 inhibitor and JH-VII-206–2 is a compound with a related structure to SRPKIN-1 but without effect on SRPK1 kinase activity. See Figure S1B for compound structures. (C) Representative images of chemically treated oocytes examined by differential interference contrast (DIC) microscopy (upper panel) or DAPI-stained DNA (lower panel). Maternal (M) and paternal (P) genomes are labeled. (D) Quantification of unfertilized oocyte, 1-cell zygotes, and 2-cell embryos in response to treatment with the SRPK1 inhibitor or control compound. The numbers of zygotes quantified from three independent experiments are indicated above the bars. (E) Representative images of zygotes with low, intermediate, and high levels of residual SRPK1 (quantified with ImageJ), correlated to different degrees of paternal genome decondensation. Scale bar, 20 μm. (F and G) Quantification of unfertilized oocyte, 1-cell zygotes, and 2-cell embryos from fertilized oocytes in response to SRPK1 depletion (F) and percentages of the paternal genome that remained condensed in 1-cell zygotes relative to the remaining levels of SRPK1 (G). The numbers of zygotes quantified from three independent experiments are indicated above the bars. See also Figure S1C–F for additional details.
Figure 2.
Figure 2.. Kinase activity of SRPK1 is required for protamine removal
(A) Scheme for siRNA microinjection into growing oocytes to deplete maternal SRPK1 and functional rescue with siRNA-resistant SRPK1 mRNA. See Figure S2A for characterization of the growing oocytes. (B) Representative images of fertilized eggs stained with anti-SRPK1 (green), anti-P1 (red), and DAPI (blue) 4 hours post insemination. Panel I to IV respectively show oocytes injected with scrambled (Scr) siRNA (I), SRPK1 siRNA (II), SRPK1 siRNA plus human SRPK1 mRNA (III) and SRPK1 siRNA plus human kinase-dead SRPK1 mRNA (KD) (IV). Arrows indicate paternal DNA with a zoomed image in the insert. P, paternal DNA; M, maternal DNA; PB, polar body. Scale bar, 20 μm. (C) Quantified impact on zygotic development in response to different treatments as in B. The numbers of zygotes quantified from three independent experiments are indicated above the bars. See Figure S2B for additional details. (D,E,F) Relative SRPK1 staining signals (D), relative values of pronuclear size (paternal/maternal) (E), and relative P1 staining signals (F) in fertilized eggs. The values of zygotes treated with Scr siRNA were set as 1.0 in each case. **P < 0.01 by two-tailed Student’s t-test; error bars, mean±SEM.
Figure 3.
Figure 3.. Maternal SRPK1 catalyzes site-specific phosphorylation of Protamine 1
(A) The peptide sequence of mouse P1 (#1) and a series (#2 to #6) of peptides containing specific Ser-to-Ala mutations (red). See Figure S3A for 3 separately synthesized P2 peptides and mapped phosphorylation sites by SRPK1 in vitro. (B) Time-dependent 32P-phosphate transfer to P1 by SRPK1. Data were fit to either single or double exponential function to obtain total phosphorylation content per peptide at reaction endpoints. See Figure S3B and C for the phosphoryl content transferred to P1 peptides by SRPK1 and the velocity of each phosphorylation reaction; see Figure S3D for SRPK1-catalyzed phosphorylation of individual P2 peptides. (C, D) Immunostaining of total P1 (green) and phosphorylated P1 (red) at Ser9 (C) or Ser43 (D) in mouse epididymal sperms and zygotes 1-hour post insemination. Arrows indicate P1 on paternal DNA, each with a zoomed image in the insert. P, paternal DNA; M, maternal DNA; PB, polar body. Scale bar, 20 μm. See Figure S3E and F for characterizing the specificity of individual anti-P1 phospho-specific antibodies. (E) Representative images of fertilized eggs treated with siSRPK1 or rescued with SRPK1 mRNA as in Figure 2B. See also Figure S3G for a time course experiment with anti-pSer43-specific antibody and Figure S3H for negative staining with anti-pSer11 and anti-pSer13 antibodies. (F,G,H) Relative staining signals with anti-SRPK1 (F), anti-pSer9 (G) and anti-P1 (H) in fertilized eggs. The values of control zygote treated with Scr siRNA were set as 1.0 in each case. **P < 0.01 by two-tailed Student’s t-test; error bars, mean±SEM. See Figure S3I for a similar set of experiments with anti-pSer43.
Figure 4.
Figure 4.. Knock-in mutations in Protamine 1 blocked paternal genome decondensation
(A) Generation of knock-in P1 mutant mice with CRISPR/Cas9. See Figure S4A–C for gRNA design, confirmation of mutations by Sanger sequencing, and lack of mutations on potential off-target loci examined. (B) Quantification of litter size of wild-type and mutant males after mating with wild-type females. See Figure S4D–F for sperm counts from wild-type and mutant males as well as DNA compaction examined by aniline blue staining and transmission electron microscopic images of cauda epididymal sperm. (C) Quantification of developmental potential of zygotes after fertilization with wild-type, single and double P1 mutant sperm. The numbers of zygotes quantified from three independent experiments are indicated above the bars. (D,E) Representative images of fertilized eggs stained with anti-pSer9 (D) or anti-pSer43 (E), total P1 (green) and DAPI (blue) 1-hour post insemination when protamine still remained on paternal chromatin. P, paternal DNA; M, maternal DNA; PB, polar body. Scale bar, 20 μm. (F) Representative images of fertilized eggs stained for total P1 (green) and DAPI (blue) 4-hour post insemination when protamine was largely displaced from the paternal genome and disbursed throughout the ooplasm. Arrow indicates P1 staining signal remained on the paternal chromatin only with the double mutant. P, paternal DNA; M, maternal DNA; PB, polar body. Scale bar, 20 μm. (G,H) Relative values of pronuclear size (paternal/maternal) (G) and relative P1 staining signals on paternal chromatin (H) in fertilized eggs. **P < 0.01 by two-tailed Student’s t-test; error bars, mean±SEM.
Figure 5.
Figure 5.. DNA-induced phase transition of Protamine 1 is partially reversed by SRPK1
(A) Prediction of intrinsically disordered region (IDR) in P1. Note that the mapped SRPK1 phosphorylation sites are right on both edges of the IDR. (B) P1 phase separation in the presence of DNA with increasing concentrations of P1 protein. 10% P1 was labeled with Alexa 488 and 1% DNA was labeled with Alexa 594. Insert: amplified images. Scale bar, 10 μm. See Figure S5A–C for protein concentration-dependent, but DNA length-independent P1 phase transition. (C) Fluorescent recovery after photobleaching (FRAP) analysis on P1/DNA gel-like particles. Bleaching was performed at the indicated time points. Quantified data are based on 3 independent experiments. Error bars, mean±SEM. (D,E) Representative images of wild-type (D) and double mutant (E) P1 phase separation in the presence of active or kinase dead SRPK1. See Figure S5D,E for similar analysis with single mutants in P1 phosphorylation sites.
Figure 6.
Figure 6.. Phosphorylation-dependent interactions of Protamine 1 with NPM and HIRA
(A) SRPK1 phosphorylation-dependent enhancement of sperm DNA decondensation with purified NPM2. Isolated wild-type (upper panels) and double mutant (lower panels) sperm were treated with purified NPM2 for different time points in the presence of kinase-dead or active SRPK1. Sperm volumes were quantified, as shown on the right. ***P < 0.001 by two-tailed Student’s t-test; error bars, mean±SEM. See Figure S6A for the in vitro sperm DNA decondensation assay. (B) Western blot of retained P1 on sperm chromatin from the experiments as in A. Total and specifically phosphorylated P1 were blotted with specific antibodies. See Figure S6B for purification of recombinant NPM2, Figure S6C and S6D for the levels of retained P1 upon longer NPM2 or SRPK1 treatment, Figure S6E and S6F for in vivo results on paternal DNA decondensation in SRPK1-depleted and P1 double mutant oocytes ~10-hour post insemination, and Figure S6G for the lack of effect of NPM2 on in vitro assembled P1/DNA particles. (C) Pulldown assay to determine the interaction between HA-tagged human NPM2 and P1 in the presence or absence of SRPK1. Anti-HA pulldowns were blotted with individual antibodies as indicated. (D) Representative images of fertilized eggs stained for FLAG-H3.3 (red), HIRA (green) and DNA (blue) 1.5-hour post insemination with wild-type, single and double mutant sperm. P, paternal DNA; M, maternal DNA; PB, polar body. Scale bar, 20 μm. Fluorescence intensity was quantified by ImageJ, as shown on the right for FLAG-H3.3 and HIRA. (E) Pulldown assay to determine the interaction between HA-tagged human HIRA and P1 in the presence or absence of SRPK1. Anti-HA pulldowns were blotted with individual antibodies as indicated.
Figure 7.
Figure 7.. Coordinated parental genome reprogramming in early pronuclei
(A) Scheme for using C57BL/6 sperm to fertilize BALB/cJ MII oocytes followed by ATAC-seq. See Figure S7A–C for statistics of the ATAC-seq libraries generated and comparison with the public ATAC-seq data from sperm. (B) The UCSC browser view of a representative genomic region for ATAC-seq signals in fertilized eggs (FE) by wild-type, single and double mutant sperm (Layer I), ATAC-seq signals uniquely mapped to the paternal (Layer II) or maternal (Layer III) genome, ATAC-seq signals on isolated sperm of different genotypes (Layer IV), and ATAC-seq signals in fertilized eggs (FE) derived from SRPK1-depleted and control siRNA-treated oocytes (Layer V). Public ATAC-seq data on wild-type sperm (GSE79230) and MII oocyte (GSE116854), and ChIP-seq signals for H3.3 on sperm DNA (GSE42629) are displayed at bottom. See Figure S7D and S7E for mapping rates of ATAC-seq reads on the paternal and maternal genomes. All data were normalized to 1 million total counts, and the same scales in y-axes were used for displaying comparable data for comparison. (C, D) Mega-gene analysis on paternal genome-specific (C) and maternal genome-specific (D) ATAC-seq signals in eggs fertilized with wild-type, single and double P1 mutant sperm, and in control siRNA-treated or siSRPK1-treated eggs fertilized with wild-type sperm. Upper panels: accumulated ATAC-seq signals aligned on the centers of ATAC-seq peaks from wild-type sperm (C) or from MII oocyte (D); Low panels: Distribution of ATAC-seq signals on individual loci based on scaled z-scores. Different z-score scales were used to display sperm ATAC-seq profile versus paternal signals in fertilized eggs (C) because of the higher background detected in sperm, likely due to more compacted paternal genome in sperm relative to fertilized eggs where inter-protamine disulfide bonds are removed to enable more robust ATAC-seq profiling. See Figure S7F and S7G for the accumulation of previously mapped H3.3 ChIP-seq signals on the ATAC-seq peaks we identified and their enrichment at TSSs. (E) Proposed model for phosphorylation regulation of the protamine-to-histone exchange in fertilized oocyte by SRPK1.

References

    1. Adenot PG, Szollosi MS, Geze M, Renard JP, and Debey P (1991). Dynamics of Paternal Chromatin Changes in Live One-Cell Mouse Embryo after Natural Fertilization. Mol Reprod Dev 28, 23–34. - PubMed
    1. Aubol BE, Plocinik RM, McGlone ML, and Adams JA (2012). Nucleotide Release Sequences in the Protein Kinase SRPK1 Accelerate Substrate Phosphorylation. Biochemistry-Us 51, 6584–6594. - PMC - PubMed
    1. Balhorn R (1982). A Model for the Structure of Chromatin in Mammalian Sperm. J Cell Biol 93, 298–305. - PMC - PubMed
    1. Balhorn R (1989) Mammalian Protamines: Structure and Molecular Interactions In: Adolph KW (eds) Molecular Biology of Chromosome Function. Springer, New York, NY
    1. Balhorn R (2007). The protamine family of sperm nuclear proteins. Genome Biol 8, 227. - PMC - PubMed

Publication types

MeSH terms