. 2020 Mar 19;180(6):1098-1114.e16.
doi: 10.1016/j.cell.2020.02.042. Epub 2020 Mar 12.

Tumor-Derived Retinoic Acid Regulates Intratumoral Monocyte Differentiation to Promote Immune Suppression

Affiliations

Tumor-Derived Retinoic Acid Regulates Intratumoral Monocyte Differentiation to Promote Immune Suppression

Samir Devalaraja et al. Cell. .

Abstract

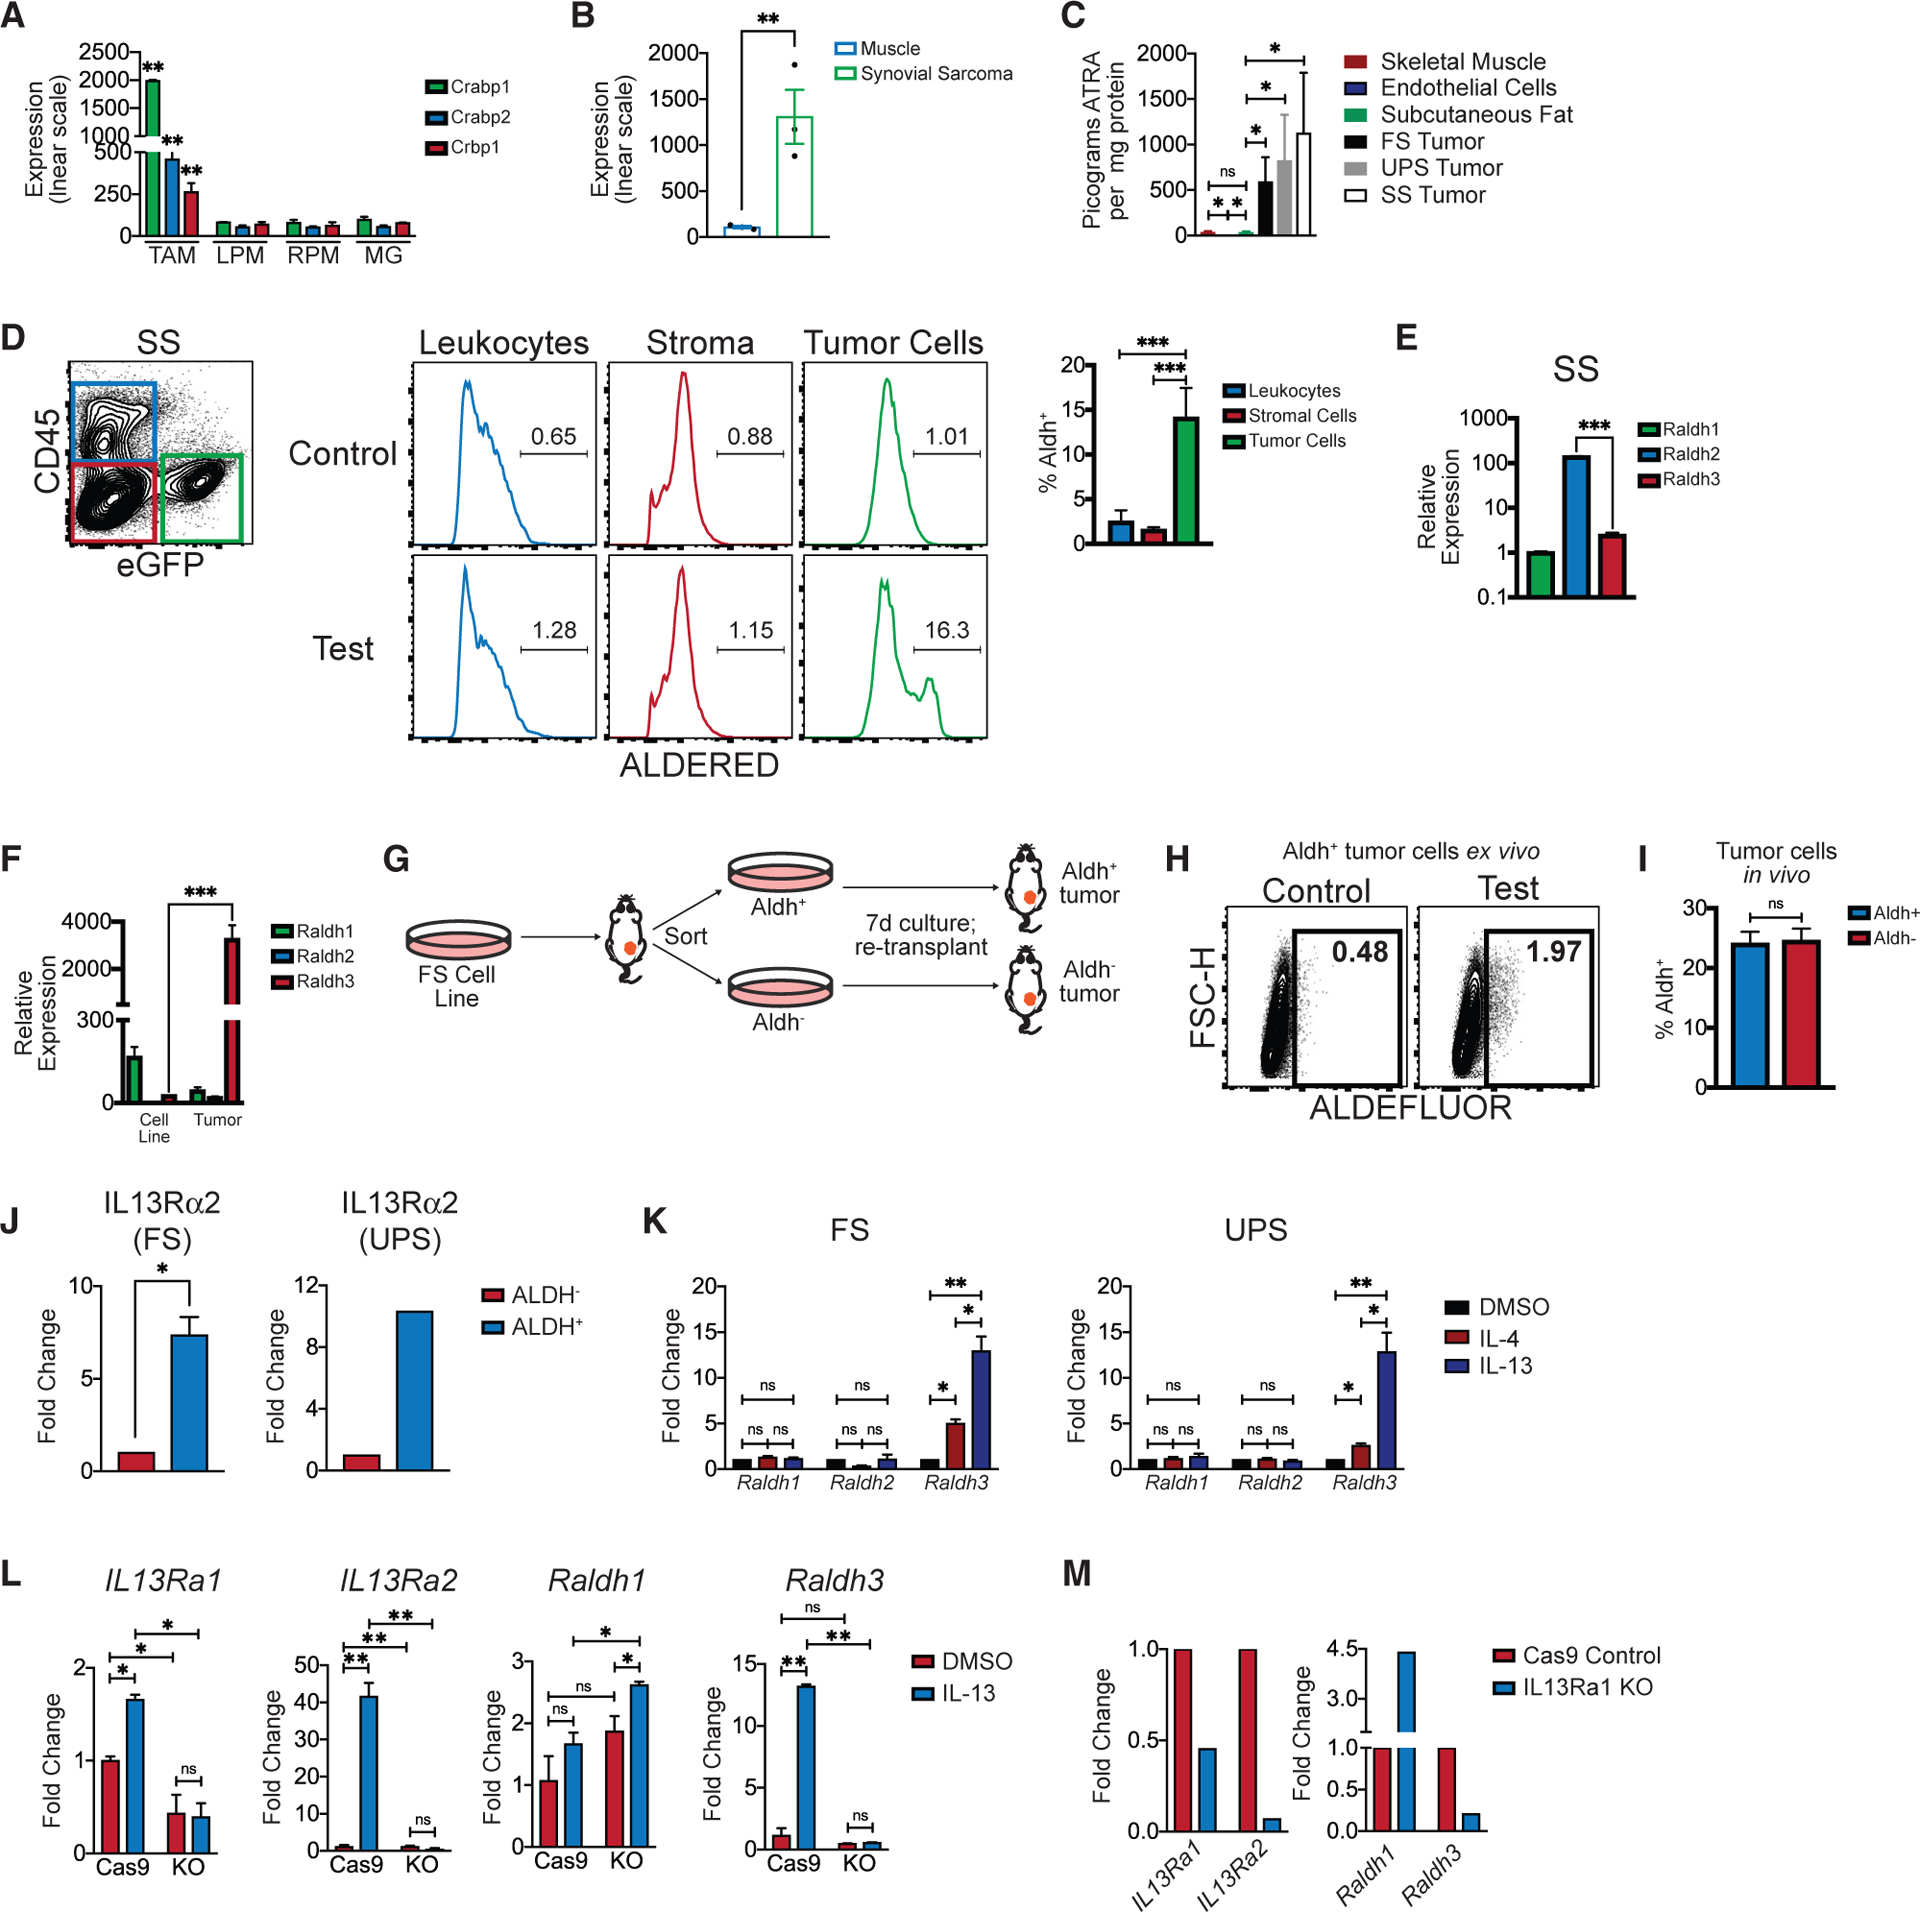
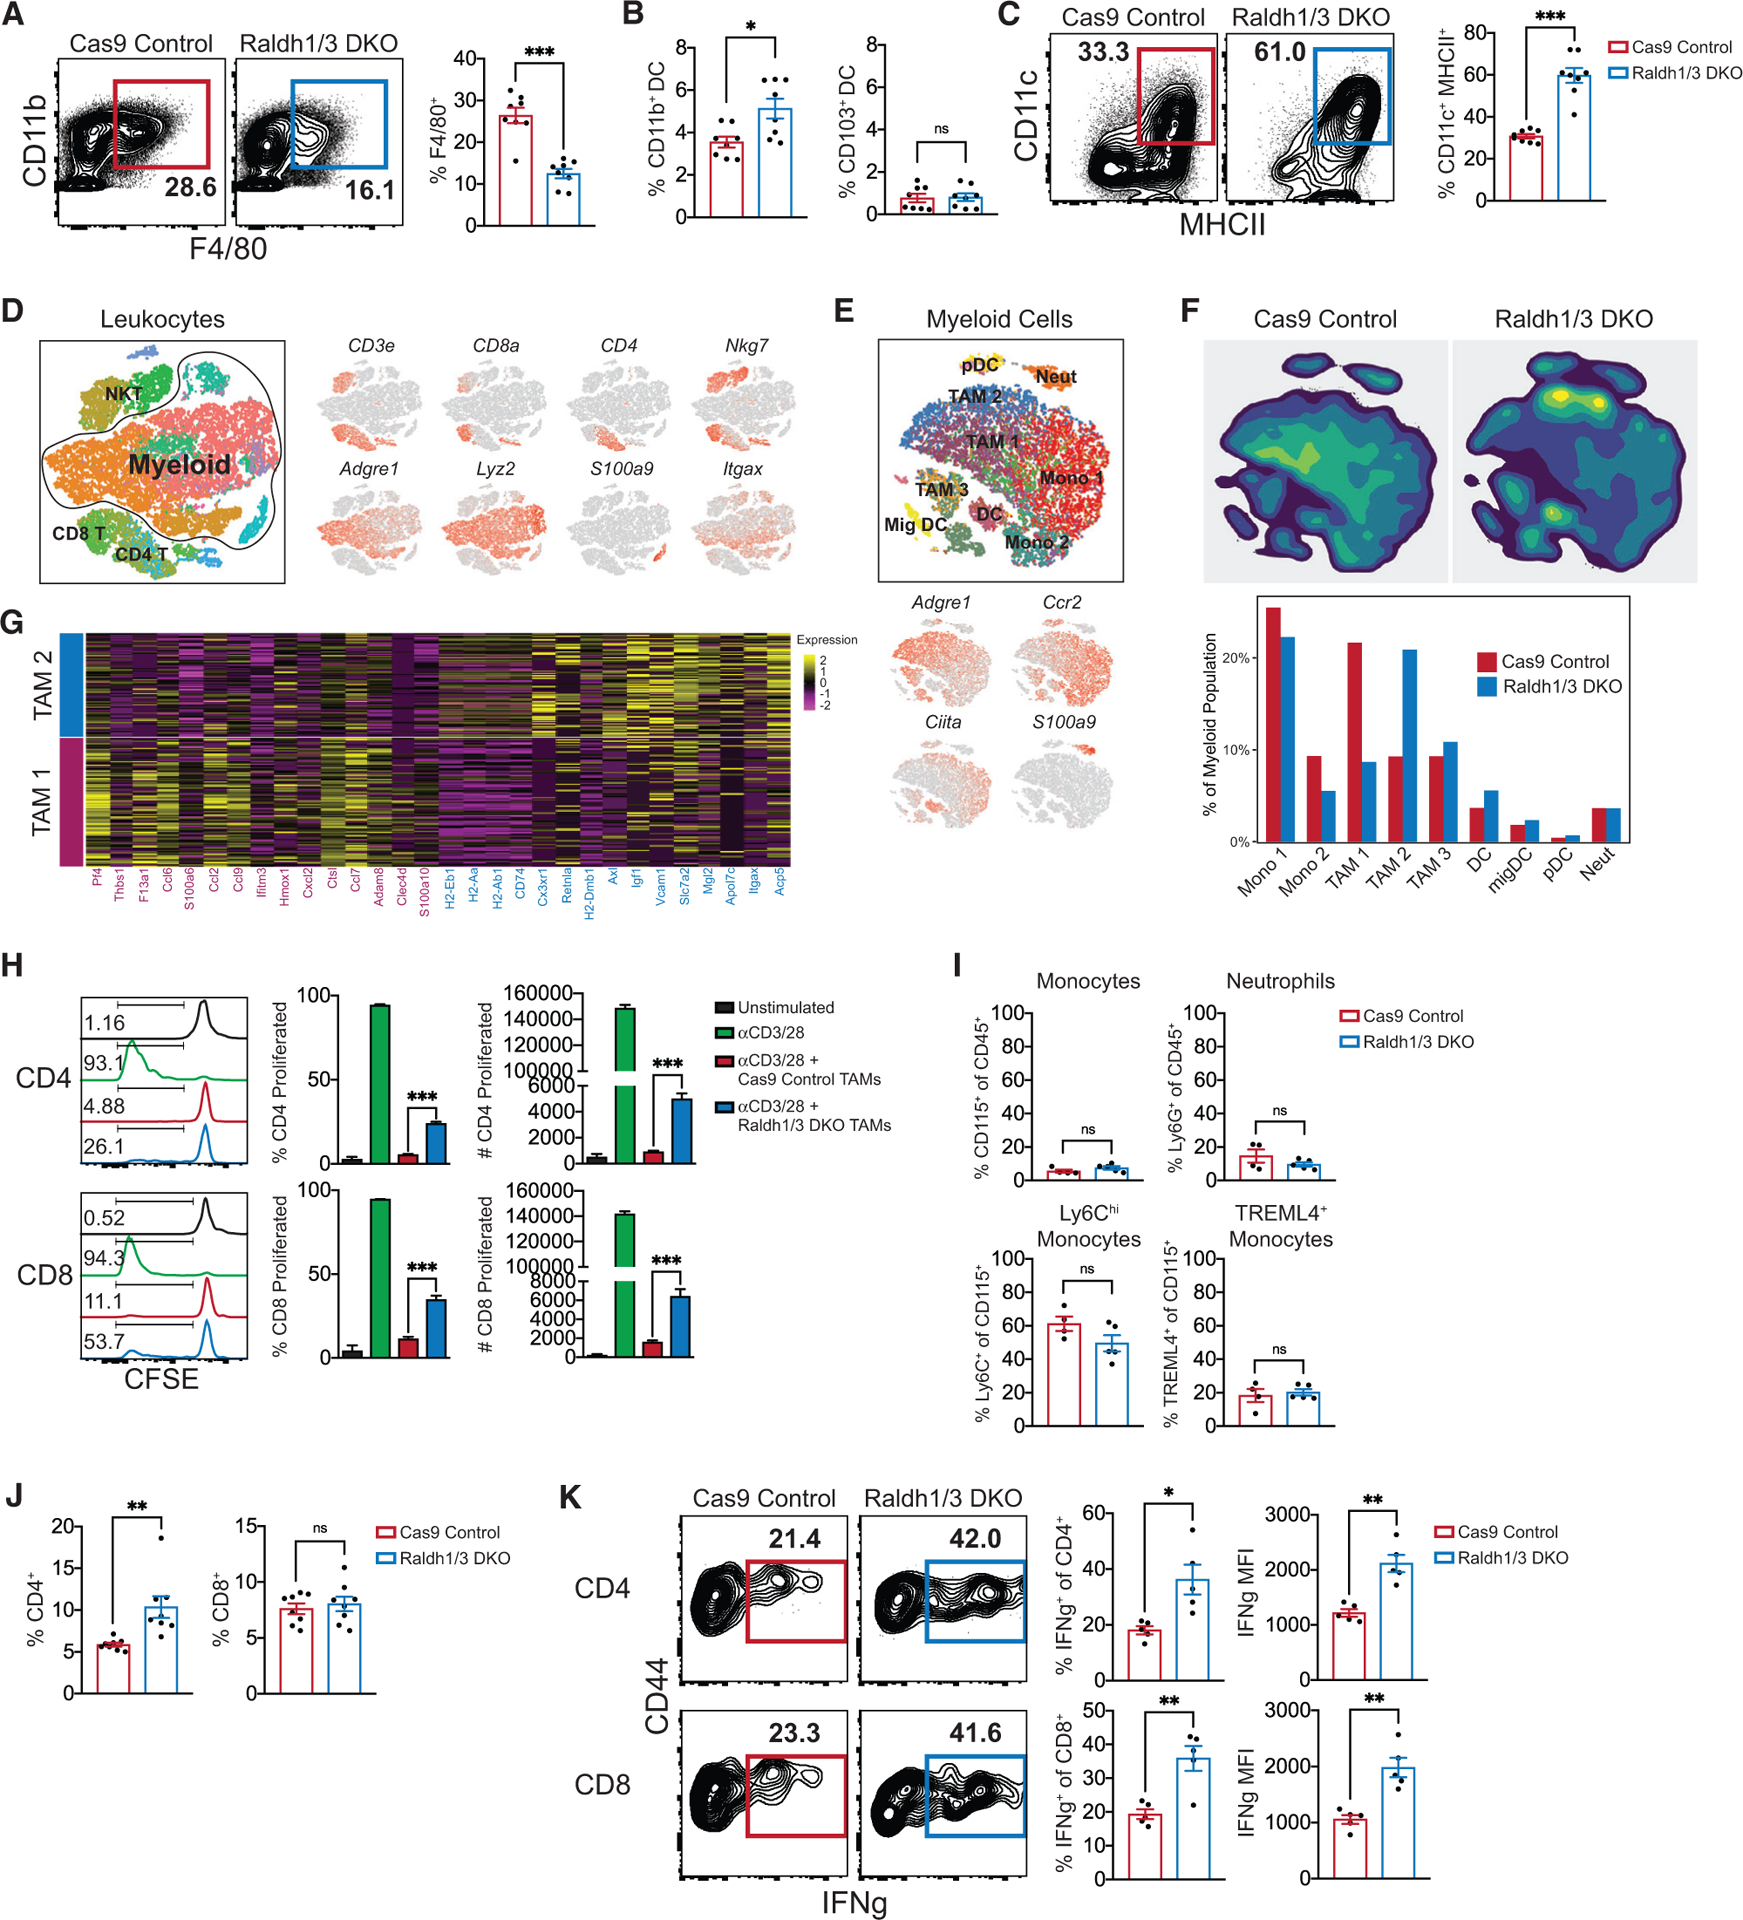
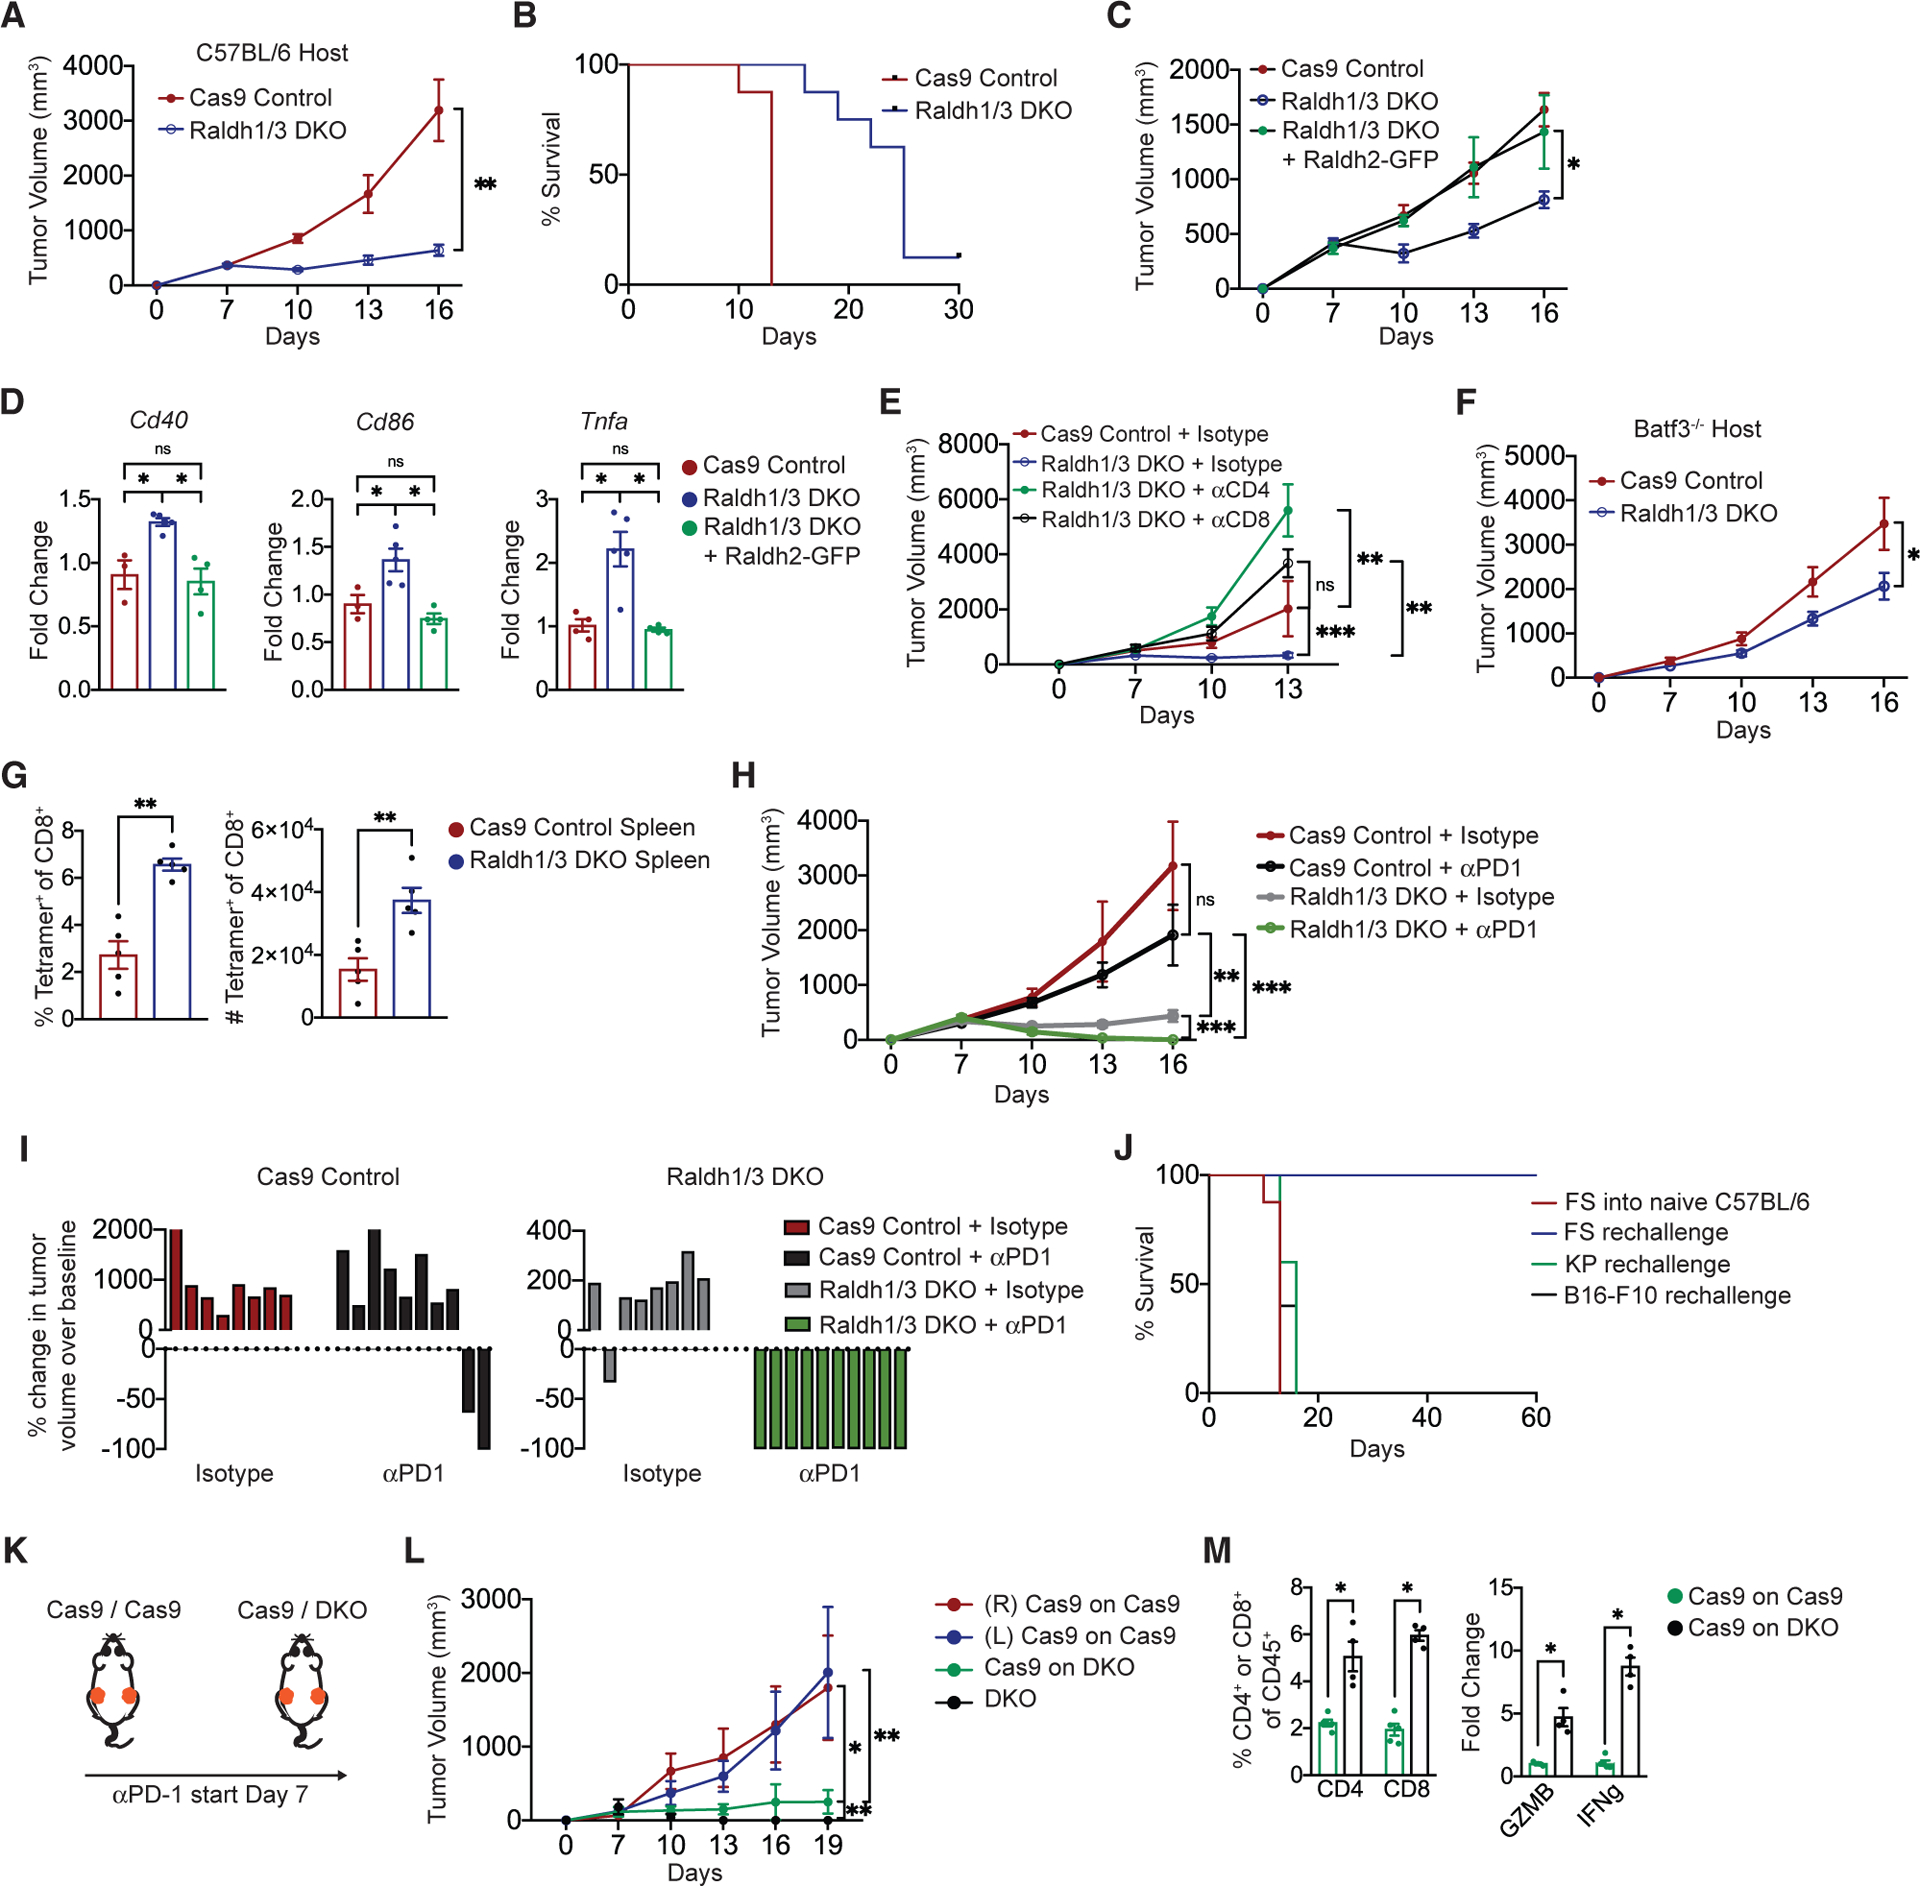
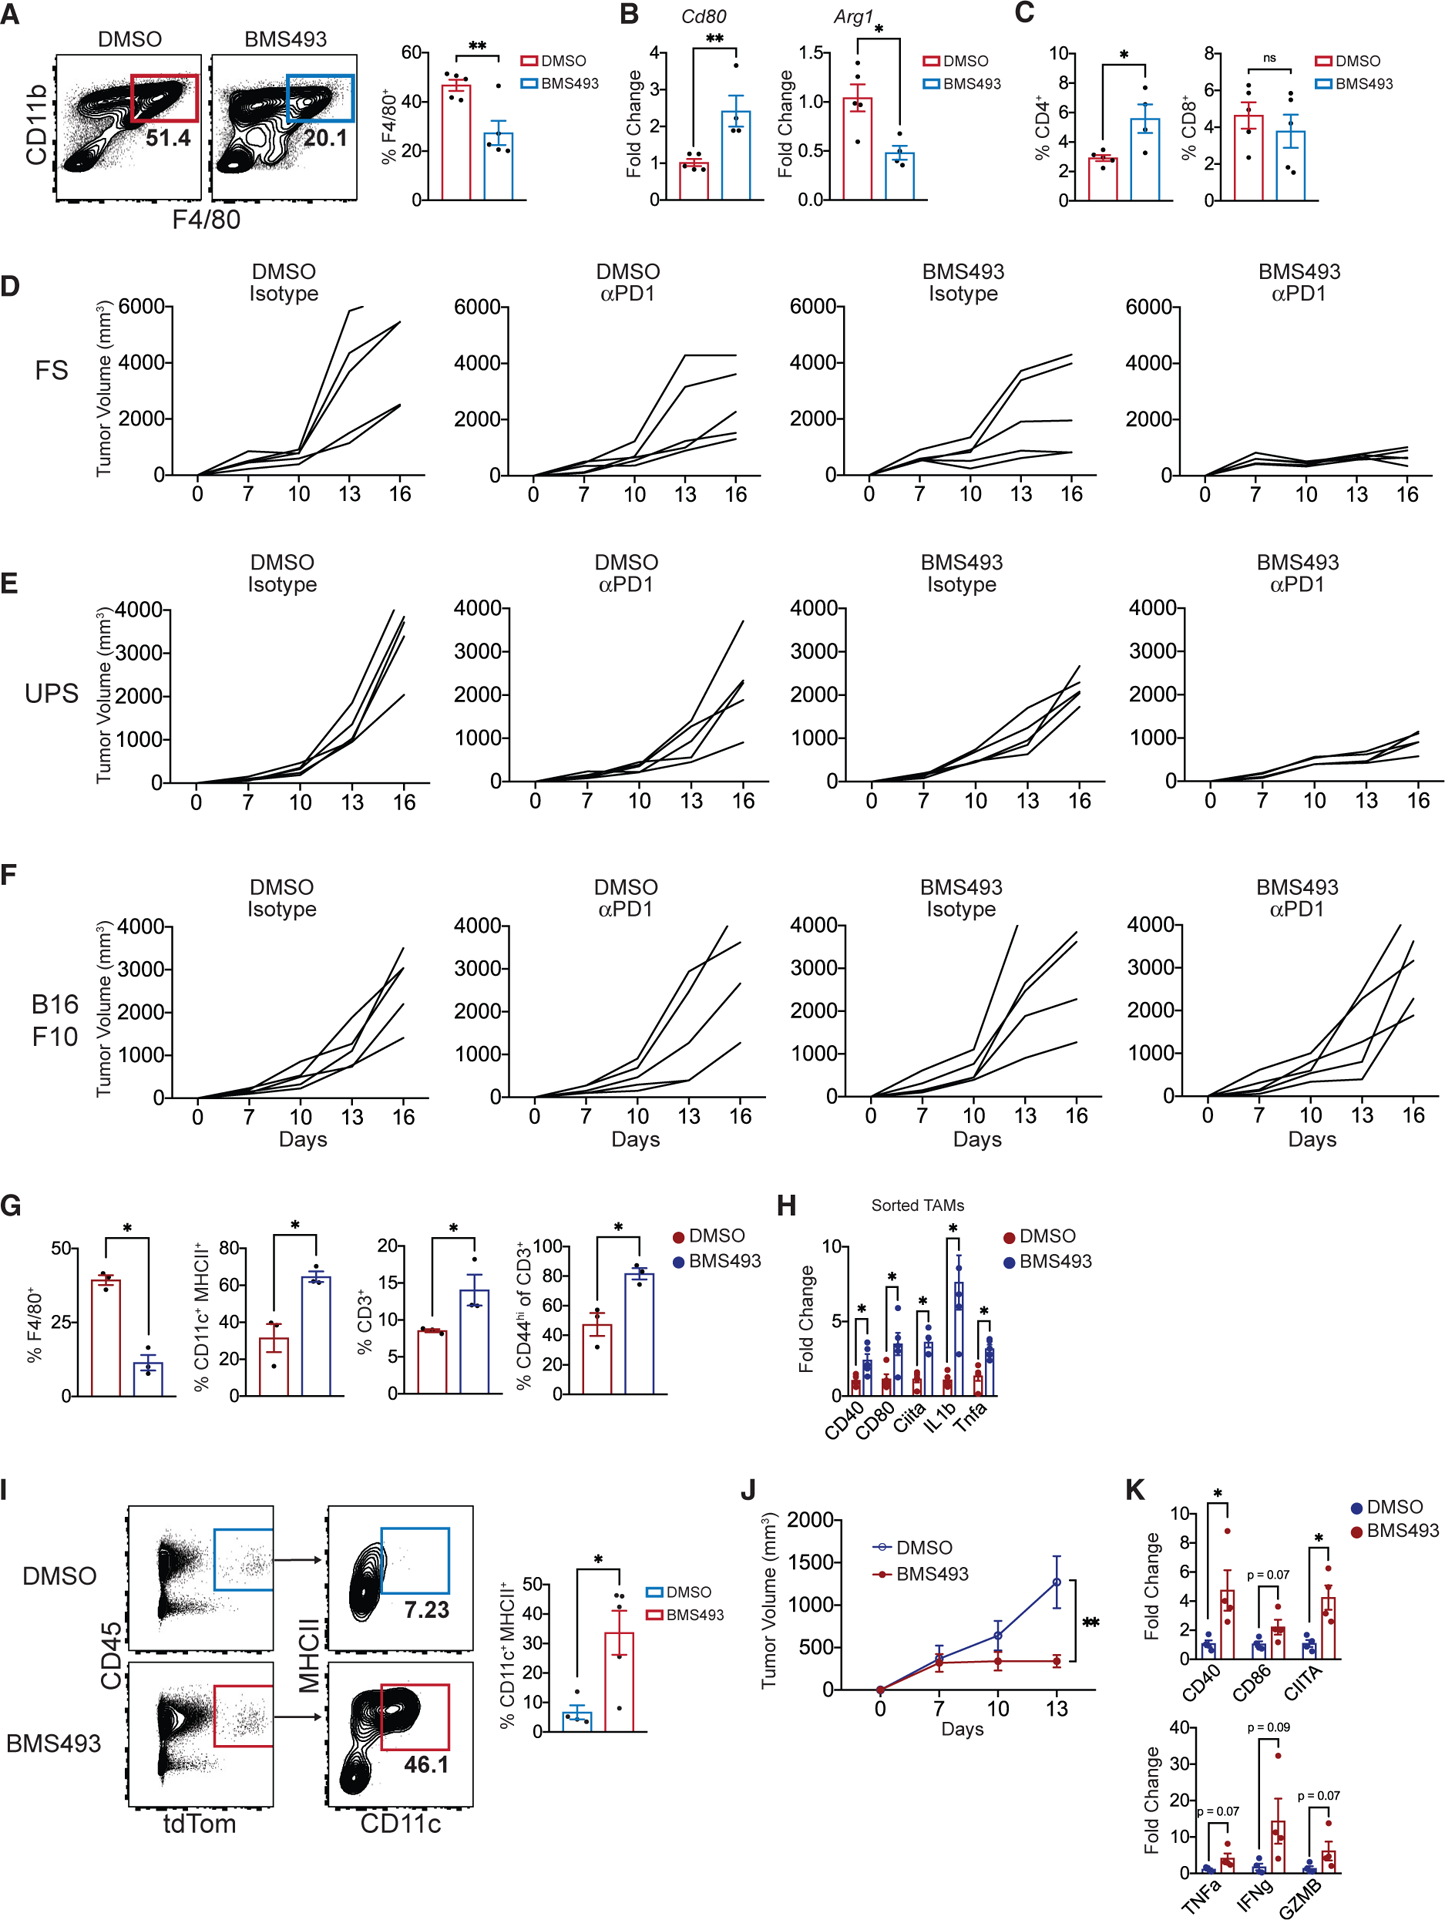
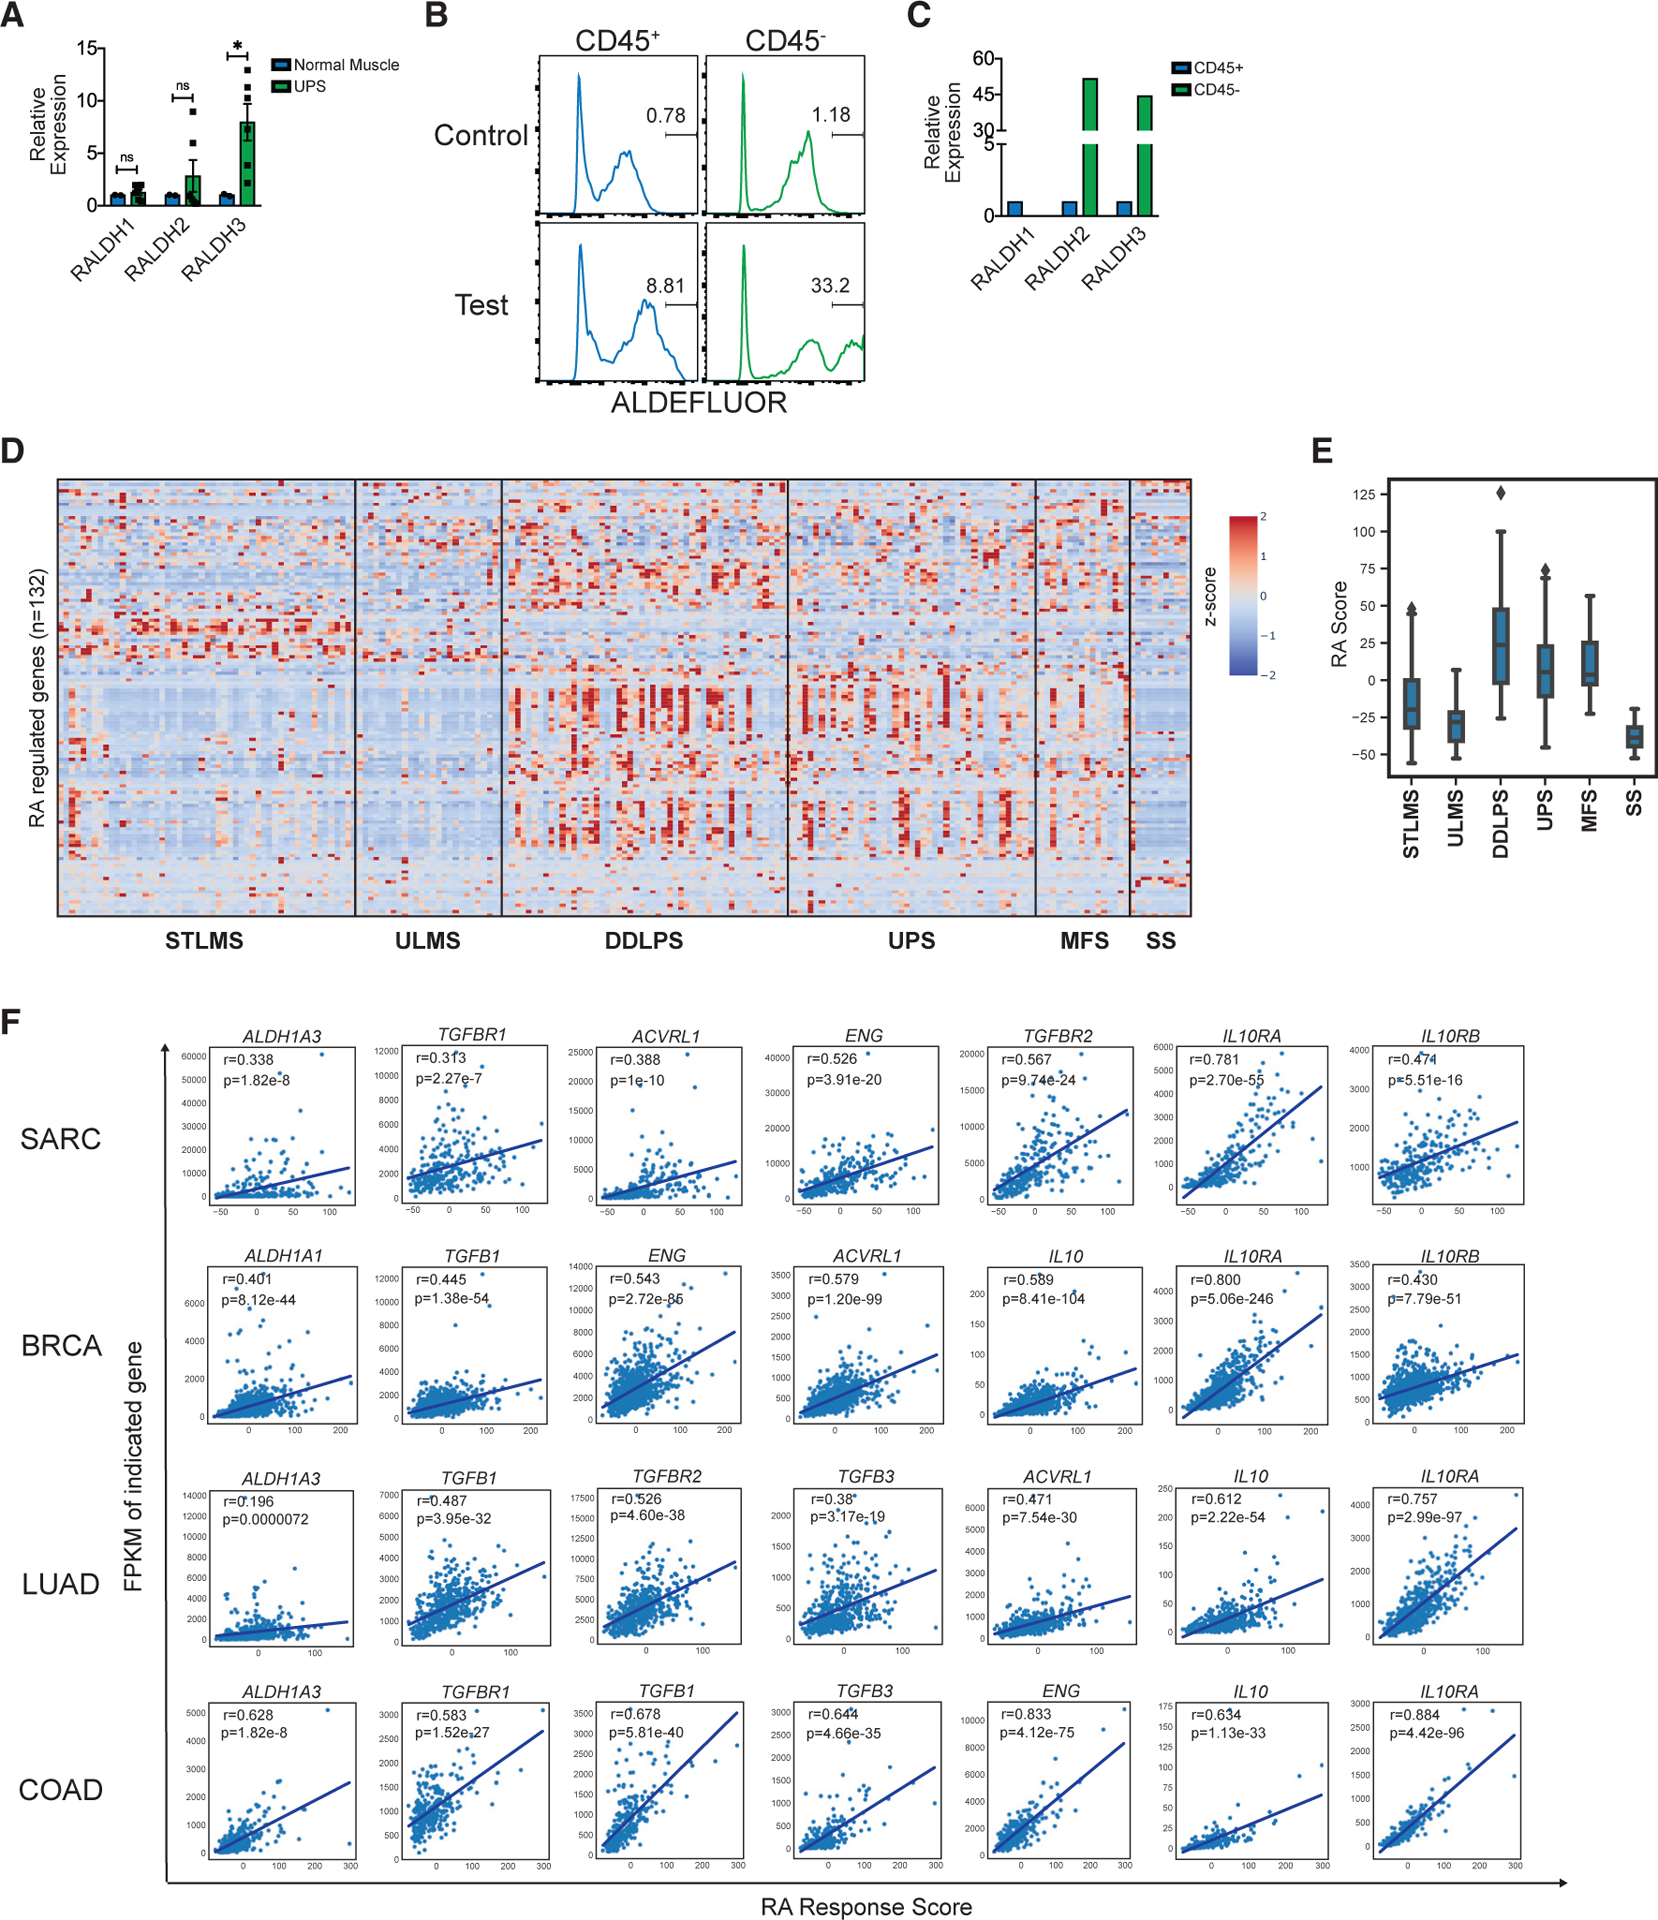
The immunosuppressive tumor microenvironment (TME) is a major barrier to immunotherapy. Within solid tumors, why monocytes preferentially differentiate into immunosuppressive tumor-associated macrophages (TAMs) rather than immunostimulatory dendritic cells (DCs) remains unclear. Using multiple murine sarcoma models, we find that the TME induces tumor cells to produce retinoic acid (RA), which polarizes intratumoral monocyte differentiation toward TAMs and away from DCs via suppression of DC-promoting transcription factor Irf4. Genetic inhibition of RA production in tumor cells or pharmacologic inhibition of RA signaling within TME increases stimulatory monocyte-derived cells, enhances T cell-dependent anti-tumor immunity, and synergizes with immune checkpoint blockade. Furthermore, an RA-responsive gene signature in human monocytes correlates with an immunosuppressive TME in multiple human tumors. RA has been considered as an anti-cancer agent, whereas our work demonstrates its tumorigenic capability via myeloid-mediated immune suppression and provides proof of concept for targeting this pathway for tumor immunotherapy.

Keywords: dendritic cell; immune checkpoint blockade; immune evasion; macrophage; monocyte; retinoic acid; tumor microenvironment.


Conflict of interest statement

Declaration of Interests The authors declare no competing interests.

Figures

Figure 1.
Figure 1.. TME Promotes Differentiation of Monocytes into Immunosuppressive Macrophages
(A and B) Flow cytometry (FCM) showing monocytes (CD45+CD11b+Ly6C+) and TAMs (CD45+CD11b+F4/80+Ly6C) (A), and DCs (CD45+ZBTB46+) (B) in FS tumors implanted into Zbtb46GFP hosts. (C) T cell suppression assay (D and E) with tumor MPs (gating shown in A and B). (D) T cell proliferation with tumor monocytes or TAMs (n = 5 tumors, pooled). Shown are frequency and absolute number of proliferated CD4 and CD8 T cells. Representative of three independent experiments. (E) Frequency and absolute number of proliferated T cells following co-culture with DCs or TAMs (n = 3 tumors, pooled). Representative of two independent experiments. (F) Intratumoral monocyte transplantation experiment. (G and H) FCM plots of tdT+ cells (derived from Lyz2Cre: Rosa26tdT: Zbtb46GFP transplanted monocytes) in FS tumors at 3 days or 7 days post-monocyte transplant (G). Frequency of F4/80+ or Zbtb46-GFP+ cells within the tdT+ fraction at indicated time points (H). Data aggregated from three independent experiments. (I) Ex vivo intratumoral monocyte differentiation experiment. (J) FCM plots (left) and frequencies (right) of DCs and macrophages after 3 days in culture. Representative of three independent experiments. Each dot represents an individual mouse. *p < 0.05, **p < 0.01, ***p < 0.001. Two-tailed t test. (D) and (E) were analyzed with one-way ANOVA with Tukey’s post hoc test. All error bars represent SEM. Events shown in FCM plots are pregated on live singlets unless otherwise specified and numbers represent percentage of cells within indicated gates. See also Figure S1.
Figure 2.
Figure 2.. TME Induces Tumor Cells to Produce High Levels of RA
(A) Microarray (Affymetrix, mouse gene 1.0ST) analyses of CD45+ F4/80+ CD11c TAMs sorted from autochthonous UPS. Shown is the expression (y axis, linear scale) of cellular retinoic acid binding proteins (CRABPs) in TAMs compared to selected tissue resident macrophages (expression data from ImmGen.org). LPM, large peritoneal macrophage; RPM, red pulp macrophage; MG, microglia. (B) Microarray (Affymetrix mouse gene 1.0ST)-based expression of Aldh1a2 (Raldh2) in autochthonous SS compared to surrounding skeletal muscle. Each dot represents an individual mouse tumor (n = 3 per group). (C) Liquid chromatography/mass spectrometry for all-trans retinoic acid (ATRA) was performed on frozen subcutaneous adipose tissue (n = 3), primary lung microvascular endothelial cells (n = 3), FS tumors (n = 10), UPS tumors (n = 5), or SS tumors (n = 5). (D) ALDERED assay on mouse SS. FCM show eGFP+ tumors cells, CD45+ leukocytes and eGFP CD45 stromal cells. Representative histograms of ALDERED fluorescence in the aforementioned populations (right). “Control” (top) show ALDERED with Aldh inhibitor (DEAB) while “test” (bottom) show the same without the inhibitor, which distinguishes fluorescence via Aldh activity from background. Bar graph shows frequency of Aldh+ cells within indicated populations (n = 6 tumors). (E) Aldh+ or Aldh cells were sorted from mouse SS (n = 3) tumors and the expression of Raldh isoforms quantified by qPCR (normalized to Hprt). Representative of two independent experiments. (F) Raldh expression in FS tumor cells cultured in vitro compared to FS tumors in vivo (n = 4 FS tumors, qPCR normalized to Hprt expression). Representative of three independent experiments. (G) Experimental outline for (H) and (I). (H) ALDEFLUOR assay on cultured Aldh+ tumor cells showing loss of Aldh activity in vitro. (I) Tumors generated from re-transplanted Aldh+ or Aldh tumor cells (as described in G) were harvested and assayed by ALDEFLUOR. Frequency of ALDEFLUOR+ cells is shown (n = 5 tumors per group). Representative of two independent experiments. (J) ALDH+ or ALDHtumor cells were sorted from FS or UPS flank tumors and the expression ofIL13Ra2 was measured by qPCR (n = 3 FS tumors individually sorted; n = 5 UPS tumors pooled and sorted). (K) FS or UPS cells were treated in vitro with recombinant IL-4 (20 ng/mL), IL-13 (20 ng/mL), or DMSO and the relative expression of Raldh1 and Raldh3 measured. (L) Cas9 Control or IL13Ra1 KO UPS cells were treated in vitro with recombinant IL-13 (20 ng/mL) or DMSO. Relative expression ofIl13ra1, Il13ra2, Raldh1, and Raldh3 quantified by qPCR. (M) C57BL/6 mice were transplanted (s.c.) with Cas9 Control or IL13Ra1 KO UPS cell lines. Tumors were harvested 11 days post-implantation, tumor cells were fluorescence-activated cell sorted (FACS), and relative expression of Il13ra1, Il13ra2, Raldh1, and Raldh3 in sorted tumor cells is shown (qPCR). All expression normalized to Hprt. *p < 0.05, **p < 0.01, ***p < 0.001. Two-tailed t test. (A), (C)–(E), (K), and (L) were analyzed with one-way ANOVA with Tukey’s post hoc test. All error bars represent SEM. Events shown in FCM plots are pregated on live singlets unless otherwise specified and numbers represent percentage of cells within indicated gates. See also Figure S2.
Figure 3.
Figure 3.. RA Promotes Immunosuppressive Macrophage and Inhibits DC Differentiation from Monocytes In Vitro
(A and B) Zbtb46GFP bone marrow monocytes (A) or human monocytes from normal donors (B) were cultured with GM-CSF, IL-4, and RA (100 nM for mice and 20 nM for human) or DMSO. FCM plots and cumulative frequencies of DCs are shown. Representative of five independent experiments. (C) Frequency of CD11c+ CD1a+ cells generated from human monocytes cultured with GM-CSF and IL-4 with either DMSO, RA (20 nM), CH55 (RAR agonist; 10 nM), BMS493 (pan-RAR inverse agonist; 1 mM), or RA + BMS493. Representative of two independent experiments. (D) FCM plots and frequencies of F4/80+ cells generated from mouse monocytes cultured with GM-CSF and IL-4 with DMSO or RA. Representative of five independent experiments. (E) Frequency of CD68+ cells in human monocytes cultured with GM-CSF and IL-4 with DMSO or RA. Representative of three independent experiments. (F and G) Ly6C+ Zbtb46-GFP monocytes from FS tumors were cultured with GM-CSF and IL-4. DMSO or RA (100 nM) was added at the onset of culture. FCM plots and frequencies of macrophages (G) and DCs (bar graph, F) are shown (n = 3 FS tumors, representative of three independent experiments). (H and I) BM monocytes were cultured with GM-CSF and IL-4 (H) or with M-CSF (I). RA (100 nM) or DMSO was added at day 0. After 3 days, differentiated APCs were washed, and co-cultured for 3 days with CFSE-labeled aCD3/28 stimulated splenic T cells. Shown are histograms and frequency of proliferated T cells. Representative of four independent experiments. (J) Human monocytes from normal donors were cultured with M-CSF. After 5 days, differentiated macrophages were washed and co-cultured for 3 days with CFSE-labeled aCD3/28 stimulated T cells (from different human donor). RA or DMSO was added to the co-culture at day 0. Shown is frequency of proliferated T cells. Representative of two independent experiments. (K and L) Mouse (C57BL/6J) BM monocytes (K) or human monocytes from normal donors (L) were cultured with GM-CSF and IL-4 with DMSO or RA. Cells were harvested 1 day later, RNA was extracted, and microarray (Affymetrix Mouse Gene 2.0ST) analysis was performed. Shown are fold changes of selected macrophage and DC signature genes. (M) Mouse BM monocytes were cultured with GM-CSF and IL-4 with either RA, CH55 (RAR agonist), BMS493, or DMSO. After 3 days, RNA was extracted and expression of Irf4 and Zbtb46 measured by qPCR. Representative of two independent experiments. (N) Human monocytes from normal donors were cultured with GM-CSF and IL-4. After 5 days, RNA was extracted and expression of Irf4 and Zbtb46 measured by qPCR. Representative of two independent experiments. (O) Mouse BM monocytes from LysMCre: Irf4fl/fl or LysMCre: Irf4+/+ mice and cultured with GM-CSF and IL-4. RA or DMSO was added at Day 0. After 3 days, differentiated APCs were washed and co-cultured for 3 days with CFSE-labeled αCD3/28 stimulated splenic T cells. Shown is frequency of proliferated T cells. Data aggregated from three independent experiments. (P) Human monocytes were transfected with control plasmid (pMax-GFP from Lonza) or IRF4 (IRF4-IRES2-eGFP (GeneCopoeia) using Human Monocyte Nucleofector Kit (Lonza). 2 × 10⁶ cells were transfected with 1 mg plasmid. Expression of IRF4 and ZBTB46 is shown. Data aggregated from two independent experiments. Normalized to Hprt. *p < 0.05, **p < 0.01, ***p < 0.001. Two-tailed t test. (C), (H)–(J), (M)–(P) were analyzed with one-way ANOVA with Tukey’s post hoc test. All error bars represent SEM. Events shown in FCM plots are pregated on live singlets unless otherwise specified and numbers represent percentage of cells within indicated gates. See also Figure S3.
Figure 4.
Figure 4.. Decreasing Tumor RA Enhances Intratumoral Stimulatory APCs
(A) Frequency of CD11b+ F4/80+ TAMs in Raldh1/3 DKO or Cas9 control FS tumors (n = 8 tumors). (B) Frequency of CD11b+ or CD103+ DCs in Raldh1/3 DKO or Cas9 control (n = 8 tumors). (C) Frequency of TAMs expressing both CD11c and MHCII (pregated on CD11b+ F4/80+) in Raldh1/3 DKO or Cas9 control FS tumors (n = 8 tumors per group). (D) CD45+ leukocytes from Raldh1/3 DKO or Cas9 control FS tumors were profiled by scRNA-seq (n = 4 tumors per group). Shown are merged t-distributed stochastic neighbor embedding (tSNE) plots of identified immune populations (left) and selected marker gene expression (right). (E) Merged tSNE plot of reclustered myeloid populations (top) and selected marker gene expression (bottom). (F) Density plots (top) and relative frequencies (bottom) of myeloid clusters in Raldh1/3 DKO or Cas9 Control tumors. (G) Heatmap of top 15 differentially expressed genes in TAM 1 compared to TAM 2 myeloid populations. (H) T cell suppression assay using CD11b+ F4/80+ TAMs sorted from Raldh1/3 DKO or Cas9 control tumors. Sorted TAMs were co-cultured with CFSE-labeledαCD3/28 stimulated splenic T cells obtained from a non-tumor-bearing host. Representative histograms, frequencies, and absolute numbers of proliferated T cells are shown. Representative of two independent experiments. (I) Monocyte and neutrophil frequency in peripheral blood of C57BL/6 hosts bearing Raldh1/3 DKO or Cas9 control tumors (n = 5 mice per group). Representative of two independent experiments. (J) CD4+ or CD8+ T cell frequencies within CD45+ leukocytes in Raldh1/3 DKO or Cas9 control tumors (n = 8 tumors per group). Representative of three independent experiments. (K) IFNγ production in T cells from Raldh1/3 DKO or Cas9 control tumors. Intratumoral T cells were incubated with GolgiStop and stimulated for 4 h with PMA/ionomycin. Shown are representative contour plots (left) and frequencies (right) of IFNγ+ CD4 or CD8 T cells (n = 5 tumors per group). Representative of two independent experiments. *p < 0.05, **p < 0.01, ***p < 0.001. Two-tailed t test. (H) was analyzed with one-way ANOVA with Tukey’s post hoc test. All error bars represent SEM. Events shown in FCM plots are pregated on live singlets unless otherwise specified and numbers represent percentage of cells within indicated gates. See also Figure S4.
Figure 5.
Figure 5.. Decreasing Tumor RA Augments Anti-tumor T Cell Responses and Synergizes with PD-1 Blockade
(A) Volume of Raldh1/3 DKO or Cas9 control FS tumors implanted s.c. in C57BL/6 mice measured every 3 days starting 7 days post-implantation (n = 8 tumors per group, representative of three independent experiments). (B) Survival of mice bearing Raldh1/3 DKO or Cas9 control FS tumors implanted s.c. in C57BL/6 mice (n = 12 tumors per group, data aggregated from three independent experiments). (C) Volume of Raldh1/3 DKO overexpressing Raldh2-GFP (Raldh rescue), Raldh1/3 DKO, or Cas9 control FS tumors implanted s.c. in Lyz2Cre:Rosa26-LSLCas9-IRES-GFP mice. These mice were used as hosts to minimize potential immune responses against Cas9 and GFP. Tumor volume measured every 3 days starting at 7 days post-implantation (n = 10 tumors per group, representative of two independent experiments). (D) Relative expression of Cd40, Cd86, and Tnfa by qPCR in indicated FS tumors (n = 5 tumors per group, representative of two independent experiments). (E) Tumor volume following CD4+ or CD8+ T cell depletion. aCD4, aCD8, or isotype control antibody was administered to 3 days before s.c. implantation of Raldh1/3 DKO or Cas9 control FS tumors. Thereafter, antibodies were administered intraperitoneally (i.p.) every 3 days (n = 5 tumors per group). (F) Growth of Raldh1/3 DKO or Cas9 control FS tumors implanted s.c. in in Batf3−/− hosts (n = 7 mice per group). (G) Raldh1/3 DKO or Cas9 control FS tumor cell lines expressing cytoplasmic OVA-ZsGreen were injected s.c. into C57BL/6 hosts. Shown are frequency and number of H-2kb/SINFEKL tetramer-positive splenic CD8+ T cells at 11 days post-tumor implantation. (H and I) αPD1 or isotype control antibody was administered to C57BL/6 mice starting 7 days post-implantation of Raldh1/3 DKO or Cas9 control tumors. Three doses (200 mg i.p.) were given at days 7, 10, and 13. Shown are tumor growth curves (H) and waterfall plots (I) of change in tumor volume after 12 days of therapy. (J) Parental FS, KP sarcoma, or B16-F10 melanoma tumor cell lines were implanted s.c. into mice that previously rejected (60 days tumor-free) Raldh1/3 DKO tumors upon αPD1 therapy or into naive C57BL/6 mice as control (n = 10 FS, n = 5 KP, n = 5 B16-F10). Shown is the survival curve for indicated groups. (K) Experimental outline: C57BL/6 mice received either Cas9 control tumors on both sides or Cas9 control on one side and Raldh1/3 DKO tumor on the other. αPD-1 was administered (200 mg i.p. on days 7, 10, and 13). (L) Tumor volume measured every 3 days starting at 7 days post-implantation (n = 5 tumors per group). (M) Frequencies of CD4+ or CD8+ T cells in Cas9 tumors contralateral to Cas9 tumors or Cas9 tumors contralateral to Raldh1/3 DKO tumors (left). Relative expression of Gzmb and Ifnγ in bulk tumors (right). Normalized to Hprt expression. *p < 0.05, **p < 0.01, ***p < 0.001. Two-tailed t test. (D) was analyzed with one-way ANOVA with Tukey’s post hoc test. (A)–(C), (E), (F), (H), (J), and (L) were analyzed with linear mixed-effects modeling with Tukey’s HSD post-test or Kaplan-Meier with log-rank test. All error bars represent SEM. See also Figure S5.
Figure 6.
Figure 6.. Intratumoral RAR Signaling Inhibition Engenders Stimulatory APCs and Synergizes with PD-1 Blockade
(A) Frequency of CD11b+ F4/80+ TAMs in FS tumors treated with BMS493 or DMSO. Three doses (200 mg, intratumorally) at days 7, 10, and 13 (n = 5 tumors per group, harvested 15 days post-transplant). (B) Cd80 and Arg1 expression (qPCR) in FS tumors treated with intratumoral BMS493 or DMSO (n = 5 tumors per group). (C) Frequencies of CD4+ or CD8+ T cells within CD45+ leukocytes in FS tumors treated with intratumoral BMS493 or DMSO (n = 5 tumors per group). (D–F) Individual growth curves of FS (D), UPS (E), and B16-F10 melanoma (F) tumors treated with αPD1 (or isotype control) in combination with intratumoralBMS493 (or DMSO). BMS493 (200 mg intratumorally) and/or αPD1 (200 mg i.p.) were administered at days 7, 10, and 13 (n = 5 tumors per group). (G) Mice with established SS tumors (autochthonous model) were treated with DMSO or BMS493 i.p. (3 doses of 200 mg at days 1, 3, and 5; mice euthanized on day 7). Shown are frequencies of specified myeloid and lymphoid populations in SS tumors (n = 3 per group). (H) Relative expression of Cd40, Cd80, Ciita, Il1b, and Tnfa in sorted TAMs from DMSO- or BMS493-treated SS tumors (n = 3 per group). (I) Monocytes from bone marrow of Lyz2Cre: Rosa26tdT mice were treated with either DMSO or BMS493 (1 mM) for 1 h and washed twice in PBS. Subsequently, 5 × 10⁵ monocytes were injected directly into FS flank tumors (three injections; 7 days, 9 days, and 11 days post- transplant). FCM plots of tdT+ cells (derived from transplanted monocytes) and frequencies of CD11c+ MHCII+ within the tdT+ fraction at 13 days post-tumor implantation. (J) Growth of FS tumors injected with DMSO- or BMS493-treated monocytes. Tumor volume was measured every 3days starting at 7 days post-implantation (n = 4 tumors per group, representative of three independent experiments). (K) Relative expression of Cd40, Cd86, Ciita, Tnfa, Ifng, and Gzmb in bulk FS tumors transplanted with either DMSO- or BMS493-treated monocytes. Normalized to Hprt expression. *p < 0.05, **p < 0.01, ***p < 0.001. Two-tailed t test. (J) was analyzed with linear mixed-effects modeling with Tukey’s HSD post-test. All error bars represent SEM. Events shown in FCM plots are pregated on live singlets unless otherwise specified and numbers represent percentage of cells within indicated gates. See also Figure S6.
Figure 7.
Figure 7.. Monocyte RA-Responsive Gene Signature Correlates with an Immunosuppressive TME in Human Cancer
(A) RALDH1, RALDH2, and RALDH3 expression (qPCR) in human UPS compared to human skeletal muscle. Each dot represents tissue sampled from a different location of tumor (two tissue samples from n = 3 tumors). (B) ALDEFLUOR assay on human UPS. Shown are histograms of “control” and “test” samples pregated on CD45+ (left) or CD45 cells (right). Representative of 2 human UPS. (C) Relative expression of RALDH1, RALDH2, and RALDH3 (qPCR) in sorted CD45+ compared to CD45 cells from human synovial sarcoma (SS). Representative of 2 human SS. Normalized to Hprt. (D) Heatmap of Z scores of human monocyte RA regulated genes (n = 132; y axis) for each tumor sample (n = 259; x axis) in TCGA SARC (sarcoma) dataset. SARC dataset was further subcategorized into soft tissue leiomyosarcoma (STLMS), uterine leiomyosarcoma (ULMS), dedifferentiated liposarcoma (DDLPS), undifferentiated pleomorphic sarcoma (UPS), myxofibrosarcoma (MFS), and synovial sarcoma (SS). Human monocyte RA regulated gene list was obtained by analyzing microarray data of human monocytes cultured with GM-CSF and IL-4 treated with RA (20 nM) versus DMSO. The names of individual genes on the y axis have been listed in Figure S7. Additional details in Figure S7 and STAR Methods. (E) Boxplots of “RA response score” for samples in SARC TCGA dataset (grouped as described in D). “RA response score” for each tumor sample was calculated by summing over the Z score for all RA-regulated genes. (F) “RA response score” plotted against fragments per kilobase of exon model per million reads mapped (FPKM) values for each tumor sample for the indicated genes. Pearson’s correlation analysis to determine r and p values. BRCA, breast invasive carcinoma; LUAD, lung adenocarcinoma; COAD, colon adenocarcinoma. The individual p value for each correlation is shown within each plot. *p < 0.05. Two-tailed t test. All error bars represent SEM. Events shown in FCM plots are pregated on live singlets unless otherwise specified and numbers represent percentage of cells within indicated gates. See also Figure S7.

Comment in

References

    1. Abram CL, Roberge GL, Hu Y, and Lowell CA (2014). Comparative analysis of the efficiency and specificity of myeloid-Cre deleting strains using ROSA-EYFP reporter mice. J. Immunol. Methods 408, 89–100. - PMC - PubMed
    1. Barrott JJ, Illum BE, Jin H, Zhu J-F, Mosbruger T, Monument MJ, Smith-Fry K, Cable MG, Wang Y, Grossmann AH, et al. (2015). β-catenin stabilization enhances SS18-SSX2-driven synovial sarcomagenesis and blocks the mesenchymal to epithelial transition. Oncotarget 6, 22758–22766. - PMC - PubMed
    1. Bhatt S, Qin J, Bennett C, Qian S, Fung JJ, Hamilton TA, and Lu L (2014). All-trans retinoic acid induces arginase-1 and inducible nitric oxide synthase-producing dendritic cells with T cell inhibitory function. J. Immunol 192, 5098–5108. - PMC - PubMed
    1. Bhattacharya N, Yuan R, Prestwood TR, Penny HL, DiMaio MA, Reticker-Flynn NE, Krois CR, Kenkel JA, Pham TD, Carmi Y, et al. (2016). Normalizing Microbiota-Induced Retinoic Acid Deficiency Stimulates Protective CD8(+) T Cell-Mediated Immunity in Colorectal Cancer. Immunity 45, 641–655. - PMC - PubMed
    1. Binnewies M, Roberts EW, Kersten K, Chan V, Fearon DF, Merad M, Coussens LM, Gabrilovich DI, Ostrand-Rosenberg S, Hedrick CC, et al. (2018). Understanding the tumor immune microenvironment (TIME) for effective therapy. Nat. Med 24, 541–550. - PMC - PubMed

Publication types