. 2020 Nov;69(11):1988-1997.
doi: 10.1136/gutjnl-2019-320105. Epub 2020 Mar 13.

A purified membrane protein from Akkermansia muciniphila or the pasteurised bacterium blunts colitis associated tumourigenesis by modulation of CD8+ T cells in mice

Affiliations

A purified membrane protein from Akkermansia muciniphila or the pasteurised bacterium blunts colitis associated tumourigenesis by modulation of CD8+ T cells in mice

Lijuan Wang et al. Gut. 2020 Nov.

Abstract

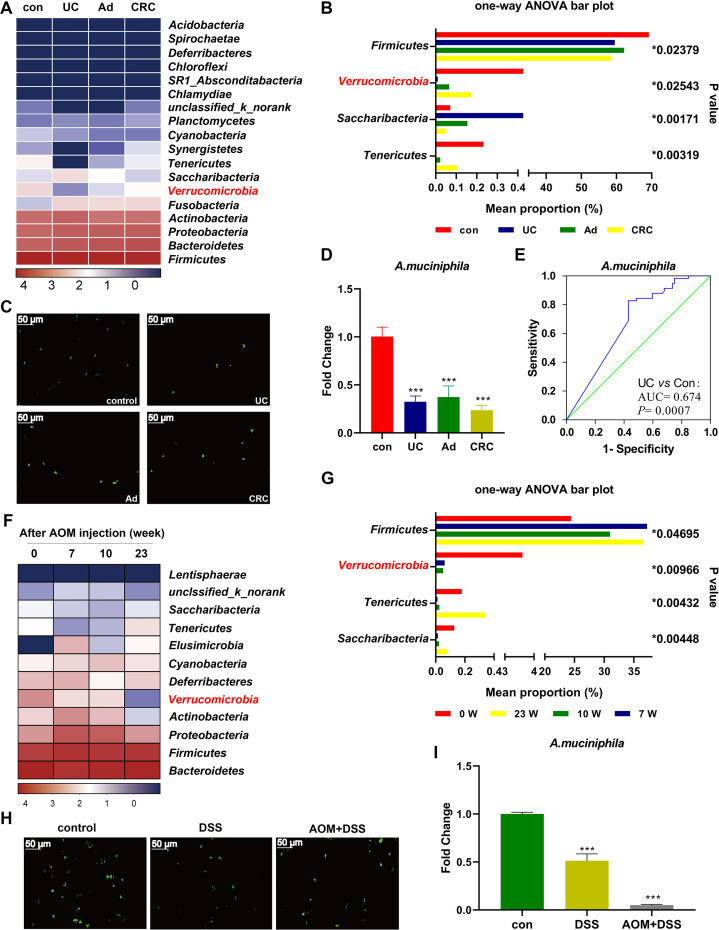
Objective: Gut microbiota have been linked to inflammatory bowel disease (IBD) and colorectal cancer (CRC). Akkermansia muciniphila (A. muciniphila) is a gram-negative anaerobic bacterium that is selectively decreased in the faecal microbiota of patients with IBD, but its causative role and molecular mechanism in blunting colitis-associated colorectal cancer (CAC) remain inconclusive. This study investigates how A. muciniphila engages the immune response in CAC.

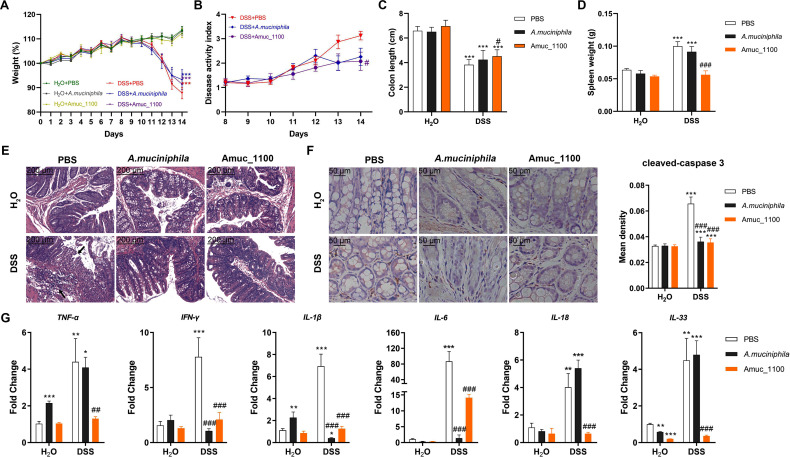
Design: Mice were given dextran sulfate sodium to induce colitis, followed by azoxymethane to establish CAC with or without pasteurised A. muciniphila or a specific outer membrane protein (Amuc_1100) treatment. Faeces from mice and patients with IBD or CRC were collected for 16S rRNA sequencing. The effects of A. muciniphila or Amuc_1100 on the immune response in acute colitis and CAC were investigated.

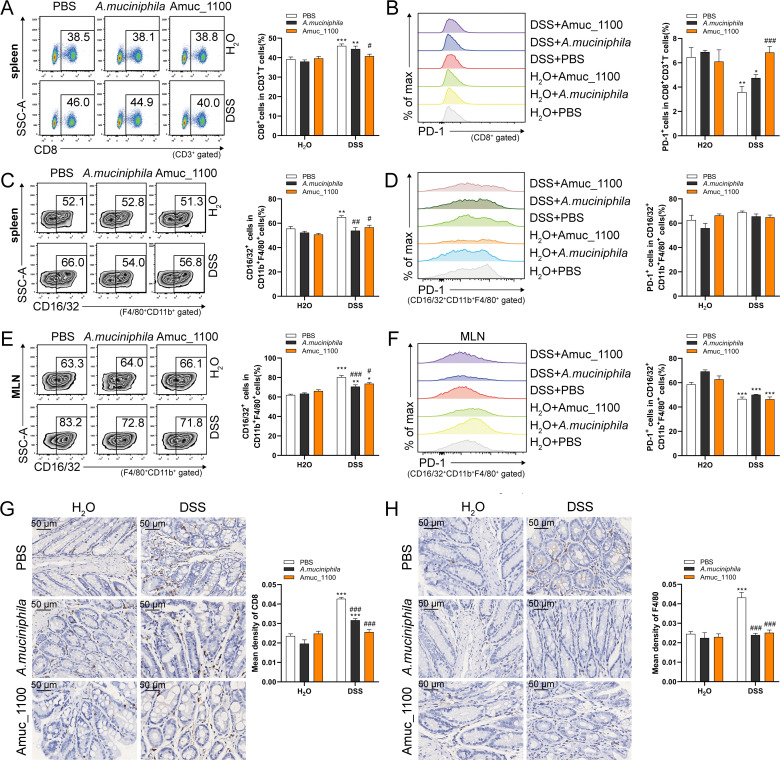
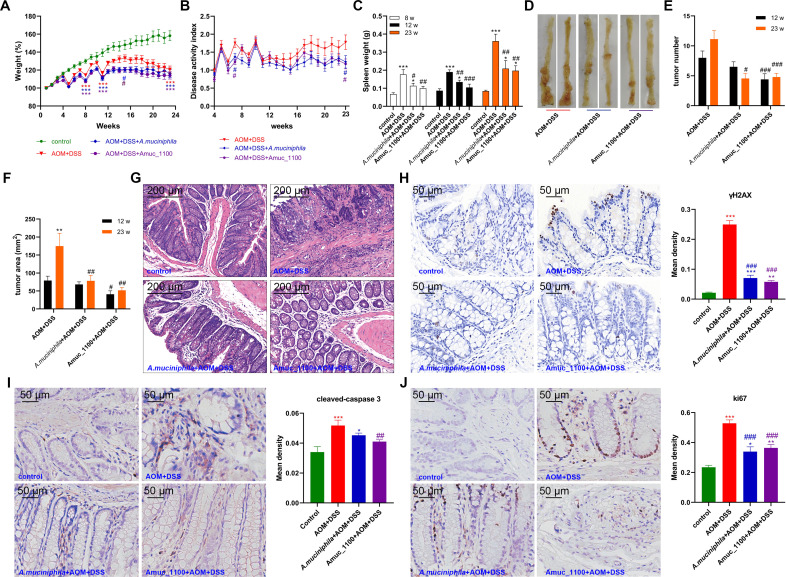
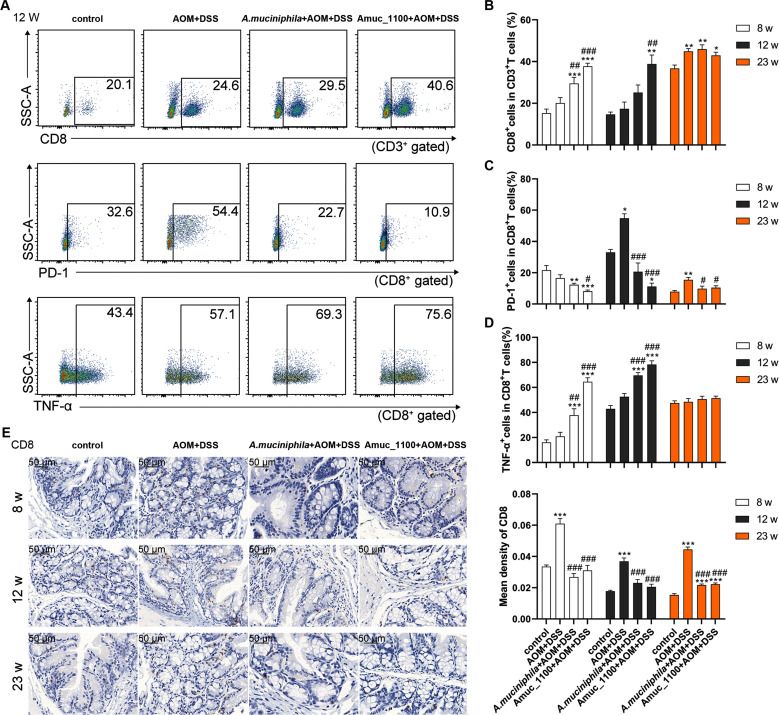
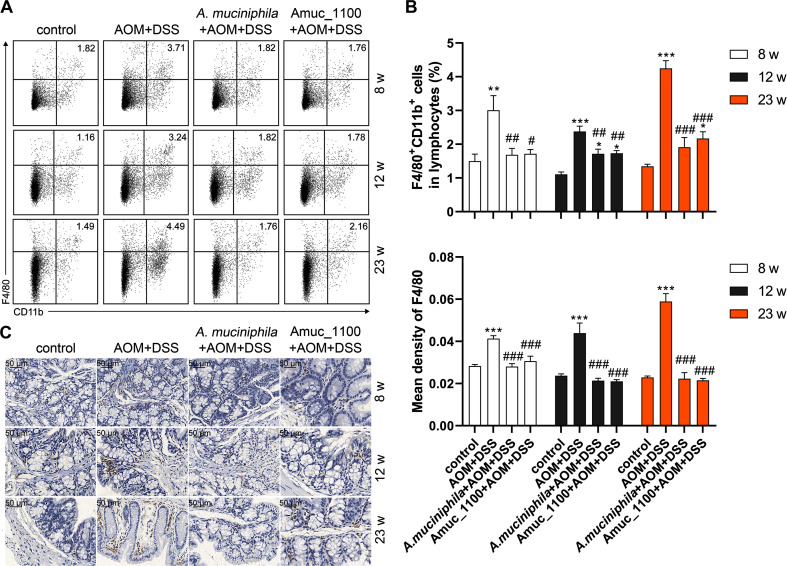
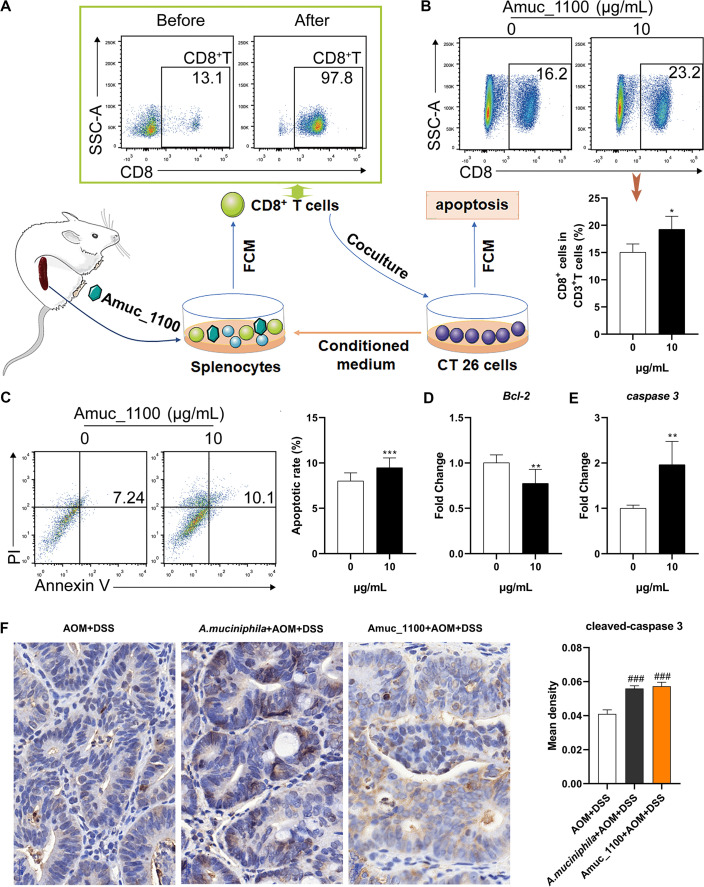
Results: A. muciniphila was significantly reduced in patients with IBD and mice with colitis or CAC. A. muciniphila or Amuc_1100 could improve colitis, with a reduction in infiltrating macrophages and CD8+ cytotoxic T lymphocytes (CTLs) in the colon. Their treatment also decreased CD16/32+ macrophages in the spleen and mesenteric lymph nodes (MLN) of colitis mice. Amuc_1100 elevated PD-1+ CTLs in the spleen. Moreover, A. muciniphila and Amuc_1100 blunted tumourigenesis by expanding CTLs in the colon and MLN. Remarkably, they activated CTLs in the MLN, as indicated by TNF-α induction and PD-1downregulation. Amuc_1100 could stimulate and activate CTLs from splenocytes in CT26 cell conditioned medium.

Conclusions: These data indicate that pasteurised A. muciniphila or Amuc_1100 can blunt colitis and CAC through the modulation of CTLs.

Keywords: colonic microflora; colorectal cancer; experimental colitis; gut immunology; nutritional supplementation.


Conflict of interest statement

Competing interests: None declared.

Figures

Figure 1
Figure 1
Decreased A. muciniphila was associated with colitis and CRC in human and mice. (A) Heatmap of faecal microbiota from patients with UC, Ad, CRC and healthy controls. (B) Comparison of the faecal microbiota among UC, Ad, CRC and controls at the phylum level. (C) FISH detection of A. muciniphila in the colon of human patients using a FITC-conjugated A. muciniphila specific probe (green). Scale bars, 50 µm. (D) qPCR validation of the relative abundance of A. muciniphila in human patients. (E) ROC curves of A. muciniphila in predicting UC. (F) Heatmap of faecal microbiota from mice with CAC at different time points. (G) Comparison of faecal microbiota in CAC mice at the phylum level. (H) FISH detection of A. muciniphila in the mice with colitis and CAC (at week 23). (I) The relative abundance of A. muciniphila in colitis and CAC (at week 23) mice by qPCR. Data are presented as the mean±SEM and were analysed by ordinary one-way ANOVA with Tukey’s multiple comparisons. ***P<0.001. Ad, adenoma; ANOVA, analysis of variance; CAC, colitis-associated colorectal cancer; CRC, colorectal cancer; UC, ulcerative colitis
Figure 2
Figure 2
Supplementation with pasteurised A. muciniphila or Amuc_1100 improved colitis induced by DSS. (A) Weight changes are expressed as the mean change from the starting weight. (B) (DAI, (C) colon length and (D) spleen weight were analysed. (E) Representative histological images of colon tissues by H&E staining. Scale bars, 200 µm. (F) IHC staining and quantitation of cleaved-caspase 3 in the proximal colon. Scale bars, 50 µm. (G) The mRNA expression of proinflammatory cytokines in colon tissue, including TNF-α, IFN-γ, IL-1β, IL-6, IL-18 and IL-33. Data are presented as the means±SEM and were analysed by ordinary one-way ANOVA with Tukey’s multiple comparisons. *P<0.05, **p<0.01, ***p<0.001, compared with respective control; ##p<0.01, ###p<0.001, compared with DSS group. ANOVA, analysis of variance; DAI, disease activity index; DSS, dextran sulfate sodium; IHC, immunohistochemistry.
Figure 3
Figure 3
Supplementation with pasteurised A. muciniphila or Amuc_1100 suppressed the activation and infiltration of CD8+ CTLs and macrophages in colitis mice. Representative FCM analysis and quantification of CTLs (A) and PD1+ CTLs (B) in the spleen. Representative FCM analysis and quantification of CD16/32+ macrophages (CD11b+F4/80+) (C) and PD1+ CD16/32+ macrophages (D) in the spleen. Scale bars, 50 µm. Representative FCM analysis and quantification of CD16/32+ macrophages (E) and PD1+ CD16/32+ macrophage (F) in the MLN. IHC staining of CD8a (G) and F4/80 (H) in the proximal colon. Data are presented as the means±SEM and were analysed by ordinary one-way ANOVA Tukey’s multiple comparisons. *P<0.05, **p<0.01, ***p<0.001, compared with respective control; #p<0.05, ##p<0.01, ###p<0.001, compared with DSS group. ANOVA, analysis of variance; CTL, cytotoxic T lymphocytes; DSS, dextran sulfate sodium; FCM, flow cytometry; IHC, immunohistochemistry; MLN, mesenteric lymph nodes.
Figure 4
Figure 4
Supplementation with pasteurised A. muciniphila or Amuc_1100 blunted tumourigenesis induced by azoxymethane (AOM)/DSS. (A) Weight changes are expressed as the mean change from the starting weight. (B) DAI, (C) spleen weight, (D) tumour development, number (E) and tumour area (F) were analysed. (G) Representative histological images of colon tissues by H&E staining. Scale bars, 200 µm. IHC staining and quantitation of γH2AX (8 weeks, H), cleaved-caspase 3 (23 weeks, I) and Ki67 (23 weeks, J) in the proximal colon. Scale bars, 50 µm. Data are presented as the mean±SEM and were analysed by ordinary one-way ANOVA with Tukey’s multiple comparisons. *P<0.05, **p<0.01, ***p<0.001, compared with respective control; #p<0.05, ##p<0.01, ###p<0.001, compared with AOM+DSS group. ANOVA, analysis of variance; DAI, disease activity index; DSS, dextran sulfate sodium; IHC, immunohistochemistry.
Figure 5
Figure 5
Pasteurised A. muciniphila or Amuc_1100 enhanced CTLs activation in CAC mice. FCM analysis of CTLs, PD-1+ CTLs and TNF-α+ CTLs in the MLN in the 12th week (A). Quantification of CTLs (B), PD-1+ CTLs (C) and TNF-α CTLs (D) in the 8th, 12th and 23rd week, respectively. (E) IHC staining of CD8a in the colon. Scale bars, 50 µm. Data are presented as the means±SEM and were analysed by ordinary one-way ANOVA with Tukey’s multiple comparisons. *P<0.05, **p<0.01, ***p<0.001, compared with control; #p<0.05, ##p<0.01, ###p<0.001, compared with AOM+DSS group. ANOVA, analysis of variance; AOM, azoxymethane; CAC, colitis-associated colorectal cancer; CTL, cytotoxic T lymphocyte; DSS, dextran sulfate sodium; FCM, flow cytometry; IHC, immunohistochemistry.
Figure 6
Figure 6
The reduced proportion and infiltration of macrophages in CAC mice treated with pasteurised A. muciniphila or Amuc_1100. (A) FCM analysis and (B) quantification of macrophage (CD11b+F4/80+) in lymphocytes of the spleen in the 8th, 12th and 23rd week. (C) IHC of F4/80 in the colon. Scale bars,50 μm. Data are presented as the mean±SEM and were analysed by ordinary one-way ANOVA with Tukey’s multiple comparisons. *P<0.05, **p<0.01, ***p<0.001, compared with control; #p<0.05, ##p<0.01, ###p<0.0001, compared with AOM+DSS group. ANOVA, analysis of variance; AOM, azoxymethane; CAC, colitis-associated colorectal cancer; DSS, dextran sulfate sodium; FCM, flow cytometry; IHC, immunohistochemistry.
Figure 7
Figure 7
Amuc_1100 induced CTL activation in CT26 cell conditioned medium. (A) Schematic representation of CTL isolation and coculture with CT26 cells. (B) The fraction of CTLs in the splenocytes cultured with CT26 cell conditioned medium with or without Amuc_1100 for 72 hours. (C) The apoptotic rate of CT26 cells cocultured with sorted CTLs for 48 hours (n=3). The mRNA expression of Bcl-2 (D) and caspase 3 (E) and in CT26 cells was detected by qPCR. (F) Intratumoural cleaved-caspase 3 in CAC mice were analysed by IHC. Scale bars, 20 µm. Data are presented as the means±SEM and were analysed with t test. *P<0.05, **p<0.01, ***p<0.001, compared with control. CAC, colitis-associated colorectal cancer; CTL, cytotoxic T lymphocyte; IHC, immunohistochemistry.

References

    1. Huyghe JR, Bien SA, Harrison TA, et al. . Discovery of common and rare genetic risk variants for colorectal cancer. Nat Genet 2019;51:76–87. 10.1038/s41588-018-0286-6 - DOI - PMC - PubMed
    1. Carr PR, Weigl K, Jansen L, et al. . Healthy lifestyle factors associated with lower risk of colorectal cancer irrespective of genetic risk. Gastroenterology 2018;155:1805–15. 10.1053/j.gastro.2018.08.044 - DOI - PMC - PubMed
    1. Grivennikov SI. Inflammation and colorectal cancer: colitis-associated neoplasia. Semin Immunopathol 2013;35:229–44. 10.1007/s00281-012-0352-6 - DOI - PMC - PubMed
    1. Zhu W, Miyata N, Winter MG, et al. . Editing of the gut microbiota reduces carcinogenesis in mouse models of colitis-associated colorectal cancer. J Exp Med 2019;216:2378–93. 10.1084/jem.20181939 - DOI - PMC - PubMed
    1. Choi C-HR, Al Bakir I, Ding Nik-Sheng (John), et al. . Cumulative burden of inflammation predicts colorectal neoplasia risk in ulcerative colitis: a large single-centre study. Gut 2019;68:414–22. 10.1136/gutjnl-2017-314190 - DOI - PMC - PubMed

Publication types

Substances

Supplementary concepts