. 2020 Apr 22;40(17):3348-3359.
doi: 10.1523/JNEUROSCI.2211-19.2020. Epub 2020 Mar 13.

Nitric Oxide Signaling Strengthens Inhibitory Synapses of Cerebellar Molecular Layer Interneurons through a GABARAP-Dependent Mechanism

Affiliations

Nitric Oxide Signaling Strengthens Inhibitory Synapses of Cerebellar Molecular Layer Interneurons through a GABARAP-Dependent Mechanism

Erik A Larson et al. J Neurosci. .

Abstract

Nitric oxide (NO) is an important signaling molecule that fulfills diverse functional roles as a neurotransmitter or diffusible second messenger in the developing and adult CNS. Although the impact of NO on different behaviors such as movement, sleep, learning, and memory has been well documented, the identity of its molecular and cellular targets is still an area of ongoing investigation. Here, we identify a novel role for NO in strengthening inhibitory GABAA receptor-mediated transmission in molecular layer interneurons of the mouse cerebellum. NO levels are elevated by the activity of neuronal NO synthase (nNOS) following Ca2+ entry through extrasynaptic NMDA-type ionotropic glutamate receptors (NMDARs). NO activates protein kinase G with the subsequent production of cGMP, which prompts the stimulation of NADPH oxidase and protein kinase C (PKC). The activation of PKC promotes the selective strengthening of α3-containing GABAARs synapses through a GΑΒΑ receptor-associated protein-dependent mechanism. Given the widespread but cell type-specific expression of the NMDAR/nNOS complex in the mammalian brain, our data suggest that NMDARs may uniquely strengthen inhibitory GABAergic transmission in these cells through a novel NO-mediated pathway.SIGNIFICANCE STATEMENT Long-term changes in the efficacy of GABAergic transmission is mediated by multiple presynaptic and postsynaptic mechanisms. A prominent pathway involves crosstalk between excitatory and inhibitory synapses whereby Ca2+-entering through postsynaptic NMDARs promotes the recruitment and strengthening of GABAA receptor synapses via Ca2+/calmodulin-dependent protein kinase II. Although Ca2+ transport by NMDARs is also tightly coupled to nNOS activity and NO production, it has yet to be determined whether this pathway affects inhibitory synapses. Here, we show that activation of NMDARs trigger a NO-dependent pathway that strengthens inhibitory GABAergic synapses of cerebellar molecular layer interneurons. Given the widespread expression of NMDARs and nNOS in the mammalian brain, we speculate that NO control of GABAergic synapse efficacy may be more widespread than has been appreciated.

Keywords: GABA receptor; GABARAP; cerebellum; electrophysiology; inhibitory synapse; plasticity.


Figures

Figure 1.
Figure 1.
Repetitive stimulation of MLI excitatory synapses strengthens inhibitory neurotransmission. A, Schematic illustrating the arrangement of stimulating and recording electrodes. Stimulating electrode was positioned to focally depolarize (yellow circle) excitatory and inhibitory axons of cells innervating MLIs. PC, Purkinje cell; GC, granule cell. B, C, Representative current-clamp recordings from two MLIs with either a biphasic (B; cell 141105r2) or monophasic (C; cell 141125r3) response at three time points; before (baseline) and after (5 min or 25 min) HFS. D, Representative current-clamp recordings from a MLI with a biphasic response at three time points; before (baseline) and 5 min after application of the GABAARs antagonist bicuculline and 25 min after HFS + bicuculline treatment (cell 150225r1). E, Time course plot of the eEPSP amplitude before and after HFS from monophasic (n = 7) or biphasic (n = 10) cells or biphasic cells in the presence of the bicuculline (n = 4). F, Summary plot of the eEPSP amplitude at 25 min following HFS shown as a percentage of the initial baseline. Tukey's post hoc contrasts: ***p < 0.001. ns, not significant.
Figure 2.
Figure 2.
High-frequency stimulation evokes an increase in eIPSC amplitude and a slowing of decay kinetics. A, GABAAR currents from different MLIs just before the start (i.e., baseline) of the HFS protocol at t = 0 min and after 25 min (cell numbers, Control: 160718r1, −60HFS: 171101r1, +40HFS: 160714r1, +BAPTA: 171019r1). Inset, Scaled response from the same trace as the +40HFS demonstrating the slowing of decay kinetics following the HFS treatment. Stimulation artifacts have been removed for clarity. B, Summary plot of the time course of eIPSC amplitude during and following HFS expressed as a percentage of the baseline. C, Summary bar graph of the eIPSC amplitude observed in different experimental conditions at 25 min after HFS and expressed as a percentage of the baseline. D, Summary plot comparing the decay kinetics of eIPSCs at 25 min in different experimental conditions after HFS. Error bars indicate SEM. Tukey's post hoc contrasts: *p < 0.05, **p < 0.01, ***p < 0.001. ns, not significant.
Figure 3.
Figure 3.
GABAergic synapses are strengthened by the activation of extrasynaptic NMDARs. A, Representative traces of evoked currents from a single stimulus at +40 mV (top) or −60 mV (bottom) membrane potential (cell 150317r1). Traces in blue or black denote responses observed in the presence or absence of the AMPAR antagonist, GYKI 53 655 (10 μm), respectively. B, Representative traces of evoked currents (from the same cell as A) during a 100 Hz 6 train stimulus (or HFS) at a membrane potential of +40 mV (top) and −60 mV (bottom) in the presence (orange trace) and absence (black trace) of GYKI 53 655. C, Overlay of pharmacologically-isolated NMDAR currents (same traces as in A and B) following a single stimulus (blue trace) or during a 100 Hz 6 stimulus train (orange trace, HFS) at +40 mV and −60 mV membrane potential. Stimulation artifacts have been removed for clarity. D, Bar graph of the peak amplitude (left;t(9) = 3.43, p = 0.007, paired t test) or charge transfer (right; t(9) = 3.32, p = 0.009, paired t test) of NMDAR responses following a single stimulus or during a HFS train. E, Representative current-clamp recordings from a MLI with a biphasic response in the presence of the NMDAR antagonist D-APV before and after HFS treatment (cell 150203r2). F, Time course plot of the eEPSP amplitude before and after HFS in the presence (n = 4; open circle) and absence (n = 10; filled circles) of D-APV. Arrows indicate when the HFS protocol was performed. G, Summary plot of the eEPSP amplitude at 25 min following HFS expressed as a percentage of the baseline. Error bars indicate SEM. Control data represents the biphasic response from Figure 1 and is shown for comparison purposes. **p < 0.01, ***p < 0.001. ns, not significant.
Figure 4.
Figure 4.
Inhibition of NO synthase and NADPH oxidase blocks iLTP. A, Representative recordings from four different MLIs in current-clamp showing the response to patch electrode perfusion with different pharmacological agents. The first three traces (left to right, cell numbers: 151105r2, 150423r1, 150302r1) show the overlay of responses before (black) and after (gray) HFS. In each case, the recording electrode solution contained either NAC (cell 151105r2), RR (cell 150423r1), or Apo (cell 150302r1). The rightmost trace shows the overlay of two averaged EPSPs at the beginning (black) of patch perfusion with cGMP and after 25 min (blue; cell 190530r2). B, Summary bar graph of the eEPSP amplitude at 25 min under different conditions expressed as a percentage of the baseline. Error bars indicate SEM. C, Representative GABAAR membrane currents from three different voltage-clamped MLIs at the start (black) and after 25 min (blue) of internal patch perfusion with cGMP (cell numbers left to right: 190122r1, 190311r2, 190530r2). D, Representative GABAAR currents from two different voltage-clamped MLIs at baseline (black) and 25 min after HFS (orange) with internal patch perfusion of KT-5823 (PKG inhibitor, cell 191214r2) or ODQ (guanylate cyclase inhibitor, cell 191217r2). E, Summary plot of the time course of eIPSC amplitude during internal perfusion of cGMP or HFS treatment. F, Summary bar graph of the change in eIPSC amplitude after 25 min perfusion with internal perfusion of cGMP or HFS treatment with pharmacological blockers. Data are expressed as a percentage of the baseline. G, Schematic diagram outlining the key signaling steps triggered by Ca2+ influx through NMDARs. An elevation in cytosolic Ca2+, activates nNOS which generates NO from arginine (Arg). NO's action on guanylate cyclase (sGC) generates cGMP from GTP which, in turn, signals to PKG and NOX2 to generate the ROS, superoxide (O2). Line markers in red denote the pharmacological target of 3-Br-7-Ni (nNOS), Apo (NOX2), RR (mitochondria), D-APV (NMDAR), KT-5823 (PKG), and ODQ (sGC). Error bars indicate SEM. *p < 0.05, **p < 0.01, ***p < 0.001. ns, not significant.
Figure 5.
Figure 5.
Activation of protein kinase C strengthens GABAergic synapses. A, Representative recordings from four different MLIs in current-clamp showing the response to patch electrode perfusion with different kinase inhibitors or activators. The first three traces (left to right) show the overlay of responses before (black) and after (blue) HFS. In each case, the recording electrode solution contained either KN-93 (cell 150904r1), PKA 6-22 (cell 150717r2) or Gö 6983 (cell 150629r2). The rightmost trace shows the overlay of two averaged EPSPs at the beginning (black) of patch perfusion with the phorbol ester, PMA, and after 25 min (blue; cell 160204r2). B, Summary bar graph of the eEPSP amplitude at 25 min under different conditions expressed as a percentage of the baseline. Error bars show SEM. C, Representative GABAAR membrane currents from four different MLIs in the voltage-clamp configuration. Synaptically-evoked membrane currents observed before the onset of HFS (black) and after 25 min (orange) in the presence of the PKC inhibitor, Gö 6983 (left; cell 171027r1). The remaining traces correspond to eIPSCs observed at the start (black) and after 25 min (orange) of patch perfusion with PMA (cell 160825r1), antimycin A (cell 190630r1), and antimycin A + Gö 6983 (cell 190704r1). D, Summary bar graph of the data shown in C expressed as a percentage of the baseline. Error bars indicate SEM. *p < 0.05, **p < 0.01, ***p < 0.001. ns, not significant.
Figure 6.
Figure 6.
iLTP is dependent on α3-containing GABAA receptors and GABARAP. A, Overlay of eEPSP recordings from four different MLIs in current-clamp configuration before the start of HFS (black) and after 25 min (orange). Left to right, Representative examples of recordings from MLIs from a GABAAR α3 KO mouse (cell 151110r1) and wild-type cells perfused with the gephyrin interfering peptide (cell 150612r1), GABARAP interfering peptide (cell 150518r1) and scrambled GABARAP peptide (cell 150908r1). B, Time course of the averaged eEPSP amplitude before and after HFS for the biphasic response from Figure 1 and in recordings from GABAAR α3 KO mice. C, Summary bar graph of eEPSP amplitude at 25 min following HFS expressed as a percentage of the baseline. Error bars indicate SEM. ***p < 0.001. ns, not significant.
Figure 7.
Figure 7.
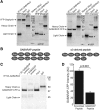
Co-assembly of α3-containing GABAA receptors with GABARAP can be disrupted by short-chain interfering peptides. A, Western blots of lysates from HEK 293 cells transfected with HA-GABAR-α3, GABAR-β2, and GABAR-γ2 (short) to form α3β2γ2 GABAR channels that have been coexpressed with either Gephyrin-YFP (left) or GABARAP-CFP (right). A, Left, Blot with eluates and inputs (n = 3) of cell lysates immunoprecipitated with an anti-HA antibody and analyzed by immunoblotting with an anti-GFP antibody. YFP is presented as a negative control (note that the anti-GFP antibody recognizes both YFP and CFP). Right, Blot with eluates and inputs (n = 3) of cell lysates immunoprecipitated with an anti-HA antibody and analyzed by immunoblotting with an anti-GFP antibody. B, Primary amino-acid sequence of the K1-GABARAP blocking peptide and the α3-derived-gephyrin blocking peptide. C, Scrambled GABARAP peptide or GABARAP peptide were added to lysates from the same transfections and pulled down with anti-HA antibody. Immunoblotting was performed with an anti-GFP antibody, as in A. D, Bar graph comparing GABARAP immunoblot levels after pre-incubation with GABARAP or scrambled peptide. p < 0.001, n = 4, Student's t test. Error bars indicate SEM.
Figure 8.
Figure 8.
Summary of iLTP signaling pathway. Schematic summarizing the main signaling events and molecules that lead to the selective recruitment of α3-containing GABAARs into inhibitory synapses of cerebellar MLIs. HFS of parallel fibers from granule cells stimulates extrasynaptic NMDARs of MLIs and activates nNOS through the influx of external Ca2+. nNOS generates NO, which acts on guanylate cyclase (sGC) elevating cGMP which, in turn, stimulates PKG and NOX2. We speculate the production of superoxide by NOX2 leads to the activation of PKC and the recruitment of GABAARs via a GABARAP-dependent pathway. This signaling pathway selectively acts on α3-containing GABAARs and does not affect synapses containing α1-GABAARs.

Similar articles

Cited by

References

    1. Accardi MV, Brown P, Miraucourt LS, Orser BA, Bowie D (2015) α6-Containing GABAA receptors are the principal mediators of inhibitory synapse strengthening by insulin in cerebellar granule cells. J Neurosci 35:9676–9688. 10.1523/JNEUROSCI.0513-15.2015 - DOI - PMC - PubMed
    1. Accardi MV, Daniels BA, Brown P, Fritschy JM, Tyagarajan SK, Bowie D (2014) Mitochondrial reactive oxygen species regulate the strength of inhibitory GABA-mediated synaptic transmission. Nat Commun 5:3168 10.1038/ncomms4168 - DOI - PMC - PubMed
    1. Alexander RPD, Mitry J, Sareen V, Khadra A, Bowie D (2019) Cerebellar stellate cell excitability is coordinated by shifts in the gating behavior ofvoltage-gated Na(+) and A-type K(+) channels. eNeuro 6:ENEURO.0126-19.2019 10.1523/ENEURO.0126-19.2019 - DOI - PMC - PubMed
    1. Arenz A, Silver RA, Schaefer AT, Margrie TW (2008) The contribution of single synapses to sensory representation in vivo. Science 321:977–980. 10.1126/science.1158391 - DOI - PMC - PubMed
    1. Bayer KU, LeBel E, McDonald GL, O'Leary H, Schulman H, De Koninck P (2006) Transition from reversible to persistent binding of CaMKII to postsynaptic sites and NR2B. J Neurosci 26:1164–1174. 10.1523/JNEUROSCI.3116-05.2006 - DOI - PMC - PubMed

Publication types

MeSH terms

LinkOut - more resources