. 2020 Mar 31;117(13):7150-7158.
doi: 10.1073/pnas.1915923117. Epub 2020 Mar 13.

A key mammalian cholesterol synthesis enzyme, squalene monooxygenase, is allosterically stabilized by its substrate

Affiliations

A key mammalian cholesterol synthesis enzyme, squalene monooxygenase, is allosterically stabilized by its substrate

Hiromasa Yoshioka et al. Proc Natl Acad Sci U S A. .

Abstract

Cholesterol biosynthesis is a high-cost process and, therefore, tightly regulated by both transcriptional and posttranslational negative feedback mechanisms in response to the level of cellular cholesterol. Squalene monooxygenase (SM, also known as squalene epoxidase or SQLE) is a rate-limiting enzyme in the cholesterol biosynthetic pathway and catalyzes epoxidation of squalene. The stability of SM is negatively regulated by cholesterol via its N-terminal regulatory domain (SM-N100). In this study, using a SM-luciferase fusion reporter cell line, we performed a chemical genetics screen that identified inhibitors of SM itself as up-regulators of SM. This effect was mediated through the SM-N100 region, competed with cholesterol-accelerated degradation, and required the E3 ubiquitin ligase MARCH6. However, up-regulation was not observed with statins, well-established cholesterol biosynthesis inhibitors, and this pointed to the presence of another mechanism other than reduced cholesterol synthesis. Further analyses revealed that squalene accumulation upon treatment with the SM inhibitor was responsible for the up-regulatory effect. Using photoaffinity labeling, we demonstrated that squalene directly bound to the N100 region, thereby reducing interaction with and ubiquitination by MARCH6. Our findings suggest that SM senses squalene via its N100 domain to increase its metabolic capacity, highlighting squalene as a feedforward factor for the cholesterol biosynthetic pathway.

Keywords: chemical genetics; cholesterol homeostasis; squalene; squalene monooxygenase.


Conflict of interest statement

The authors declare no competing interest.

Figures

Fig. 1.
Fig. 1.
A chemical screen identifies SM inhibitors as SM stabilizers. (A) HEK293 cells stably expressing SM-ELuc were treated with 1 μM or 10 μM test compounds for 16 h, and expression levels were quantified by luciferase assay. Hit compounds were those with a reproducible robust Z score of >5. (B) HEK293 cells stably expressing SM-ELuc were treated with the indicated concentrations of SM inhibitors for 16 h, and expression levels were quantified by luciferase assay (mean ± SD; n = 3 independent experiments). EC50 values are mean ± SD (n = 3 independent experiments). N.D., not determined.
Fig. 2.
Fig. 2.
The N-terminal regulatory domain of SM is sufficient for NB-598–mediated up-regulation. (A) Schematic representation of predicted SM topology. (B) Schematic representation of SM-ELuc deletion constructs. (C) HEK293 cells stably expressing SM-ELuc, SM-N100-ELuc, or SM-ΔN100-ELuc were treated with the indicated concentrations of NB-598 for 16 h, and expression levels were quantified by luciferase assay (mean ± SD; n = 3 independent experiments). (D) HEK293 cells stably expressing SM-N100-GFP-V5 were treated with the indicated concentrations of NB-598 for 16 h, and protein levels were determined by immunoblotting. For quantification, see SI Appendix, Fig. S1.
Fig. 3.
Fig. 3.
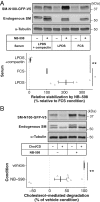
NB-598–mediated stabilization of SM-N100 depends on the availability of cholesterol biosynthetic intermediates. (A) HEK293 cells stably expressing SM-N100-GFP-V5 were conditioned in medium containing fetal calf serum (FCS), LPDS, or LPDS plus 5 µM compactin and 50 µM mevalonate for 8 h, then treated in conditioning medium with or without 1 µM NB-598 for 16 h. Graph shows densitometric representation of immunoblot of SM-N100-GFP-V5 levels. Data were normalized to NB-598–mediated stabilization in the FCS condition, which was set to 100%. Black lines and error bars denote mean ± SEM, and gray open triangles denote raw data points from each of n = 5 independent experiments (•P < 0.1, *P < 0.05, **P < 0.01, two-sided paired t test versus FCS with the Benjamini-Hochberg p adjustment for multiple comparison). (B) HEK293 cells stably expressing SM-N100-GFP-V5 were conditioned in medium with or without 1 µM NB-598 for 16 h, then treated in conditioning medium with or without 20 µg/mL Chol/CD for 8 h. Graph shows densitometric representation of immunoblot of SM-N100-GFP-V5 cholesterol regulation. Data were normalized to cholesterol-mediated degradation in the vehicle condition, which was set to 100% (mean ± SEM; n = 9 independent experiments; **P < 0.01, two-sided paired t test versus vehicle). Gray open triangles denote raw data points.
Fig. 4.
Fig. 4.
Squalene accumulation mediates the stabilization of SM-N100 by NB-598. (A) Schematic representation of cholesterol biosynthesis enzymes and their inhibitors. (B) HEK293 cells stably expressing SM-N100-ELuc were treated with or without 1 μM inhibitor for 16 h, and expression levels were quantified by luciferase assay (black circles and error bars denote mean ± SD; n = 3 independent experiments). Multiple comparisons were performed using a Dunn Kruskal–Wallis test, and P values were adjusted based on the Benjamini–Hochberg correction (n = 3 independent experiments, *P < 0.05). (C) HEK293 cells stably expressing SM-N100-ELuc were treated with the indicated concentrations of NB-598 for 16 h, nonsaponifiable lipids were extracted, and squalene levels were analyzed using GC-MS (black circles and error bars denote mean ± SD; n = 3–4 independent experiments). See also SI Appendix, Fig. S2. (D) Correlation between squalene levels (from C) and SM-N100-ELuc levels (from Fig. 2C). Black circles and error bars indicate mean ± SD; black line indicates regression fit of a baseline-shifted Michaelis–Menten equation (y = 59 + 111x/[x + 0.12]). (E) HEK293 cells stably expressing SM-N100-ELuc were treated with the indicated concentrations of NB-598, with or without 10 µM TAK-475 and/or 300 µM squalene, as indicated for 16 h, and expression levels were quantified by luciferase assay (black circles and error bars denote mean ± SD; n = 3 independent experiments). Data were normalized to the vehicle condition (-TAK-475, -squalene, and 0 nM NB-598).
Fig. 5.
Fig. 5.
Squalene-mediated stabilization occurs at the ER. (A) HEK293 cells stably expressing SM-N100-FLAG-ELuc were treated with or without 1 µM NB-598 for 16 h, and cell homogenates were fractionated by sucrose gradient ultracentrifugation. Fractions were collected and analyzed for the presence of SM-N100-FLAG-ELuc and endogenous SM by immunoblotting. Open arrowheads denote SM-N100-FLAG-ELuc or endogenous, full-length SM. Asterisk indicates a nonspecific band. Note that the fractions 5–6 showed higher background due to larger amount of total protein in the fractions. (B) The presence of the indicated organelle markers in cell fractions was quantified by immunoblotting or enzyme assays (see also SI Appendix, Fig. S6). Data are representative of n = 2 independent experiments with similar results.
Fig. 6.
Fig. 6.
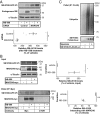
Squalene stabilizes SM-N100 by blunting its interaction with MARCH6 and ubiquitination. (A) HEK293 cells stably expressing SM-N100-GFP-V5 were transfected with the indicated siRNA for 24 h and then treated with or without 1 µM NB-598 for 16 h. Graph shows densitometric representation of Western blot of SM-N100-GFP-V5 fold stabilization. Data were normalized to the vehicle condition, which was set to 100% (mean ± SEM; n = 5 independent experiments; *P < 0.05, paired t test versus control siRNA). (B) HEK293 cells stably expressing SM-N100-GFP-V5 were transfected with MARCH6-myc for 24 h and treated with or without 1 µM NB-598 for 16 h. Equal protein amounts were immunoprecipitated using anti-myc antibody or anti-mTOR antibody as a specificity control, followed by immunoblotting. Graphs show densitometric representation of SM-N100-GFP-V5 levels in immunoprecipitation input, and relative interaction with MARCH6-myc. Data were normalized to the vehicle condition, which was set to 100% (mean ± SEM; n = 3 independent experiments; •P < 0.1, **P < 0.01, paired t test versus vehicle). (C) HEK293 cells or HEK293 cells stably expressing SM-N100-FLAG-ELuc were treated with or without 300 μM squalene, in the presence of 10 μM CB-5083, 1 μM NB-598, and 10 μM TAK-475 for 6 h. Equal protein amounts were immunoprecipitated using anti-FLAG antibody, followed by immunoblotting.
Fig. 7.
Fig. 7.
Squalene is recognized by SM-N100 via direct binding. (A) Chemical structures of squalene, squalane, and corresponding photoaffinity probes. (B) HEK293 cells stably expressing SM-N100-ELuc were treated with 300 µM squalene, 300 µM squalane, 30 µM SqBPY-153, or 30 µM SqBPY-150 in the presence of 10 µM TAK-475 and 1 µM NB-598 for 16 h. SM-N100-ELuc expression levels were quantified by luciferase assay (mean ± SD, n = 3 independent experiments). Multiple comparisons were performed using a Dunn Kruskal–Wallis test, and P values are adjusted based on the Benjamini–Hochberg correction (n = 3 independent experiments, *P < 0.05, **P < 0.01). (C) Membrane fractions isolated from HEK293 cells or HEK293 cells stably expressing SM-N100-ELuc were treated with the indicated probes for 30 min at 4 °C and photoaffinity labeling was performed with 365-nm UV light for 3 min at 0 °C. Anti-FLAG–immunoprecipitated products were biotinylated by click chemistry followed by immunoblotting. Data are representative of n = 2 independent experiments. (D) Photoaffinity labeling was performed as described in C in the absence or presence of squalene. Data are representative of n = 3 independent experiments.
Fig. 8.
Fig. 8.
Current model of SM regulation by squalene and cholesterol. (A) Under basal conditions, MARCH6 maintains steady-state levels of SM by ubiquitinating and targeting it for degradation. (B) During cholesterol excess, SM undergoes accelerated degradation in a MARCH6-dependent manner. (C) The SM-N100 regulatory domain senses squalene levels by directly binding squalene in the membrane, resulting in decreased interaction with MARCH6, decreased ubiquitination, and decreased degradation. (D) Squalene-rich conditions blunt the cholesterol-dependent degradation of SM-N100, perhaps by preventing cholesterol-induced conformational changes and recognition by MARCH6. This implies a feed-forward mechanism that prevents excessive accumulation of the SM substrate.

Comment in

Similar articles

Cited by

References

    1. Brown M. S., Radhakrishnan A., Goldstein J. L., Retrospective on cholesterol homeostasis: The central role of Scap. Annu. Rev. Biochem. 87, 783–807 (2018). - PMC - PubMed
    1. Chin D. J., et al. , Sterols accelerate degradation of hamster 3-hydroxy-3-methylglutaryl coenzyme A reductase encoded by a constitutively expressed cDNA. Mol. Cell. Biol. 5, 634–641 (1985). - PMC - PubMed
    1. Gil G., Faust J. R., Chin D. J., Goldstein J. L., Brown M. S., Membrane-bound domain of HMG CoA reductase is required for sterol-enhanced degradation of the enzyme. Cell 41, 249–258 (1985). - PubMed
    1. Sever N., Yang T., Brown M. S., Goldstein J. L., DeBose-Boyd R. A., Accelerated degradation of HMG CoA reductase mediated by binding of insig-1 to its sterol-sensing domain. Mol. Cell 11, 25–33 (2003). - PubMed
    1. Gill S., Stevenson J., Kristiana I., Brown A. J., Cholesterol-dependent degradation of squalene monooxygenase, a control point in cholesterol synthesis beyond HMG-CoA reductase. Cell Metab. 13, 260–273 (2011). - PubMed

Publication types

LinkOut - more resources