. 2020 Mar 31;117(13):7326-7337.
doi: 10.1073/pnas.1909546117. Epub 2020 Mar 13.

NETosis proceeds by cytoskeleton and endomembrane disassembly and PAD4-mediated chromatin decondensation and nuclear envelope rupture

Affiliations

NETosis proceeds by cytoskeleton and endomembrane disassembly and PAD4-mediated chromatin decondensation and nuclear envelope rupture

Hawa Racine Thiam et al. Proc Natl Acad Sci U S A. .

Abstract

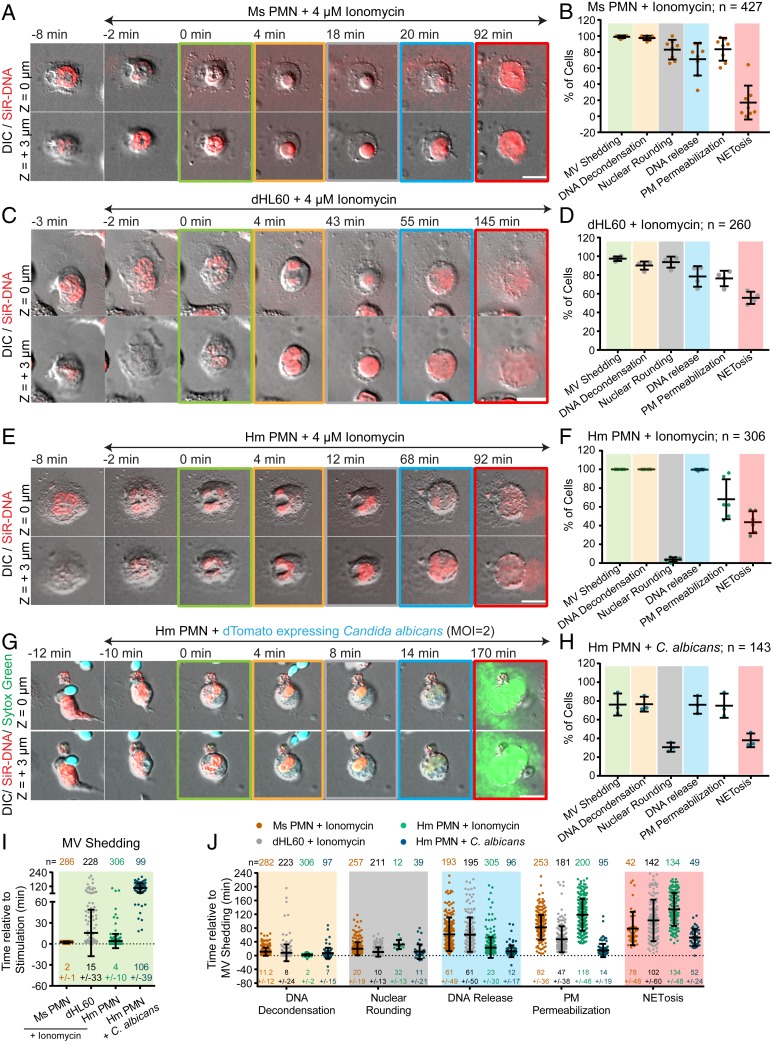
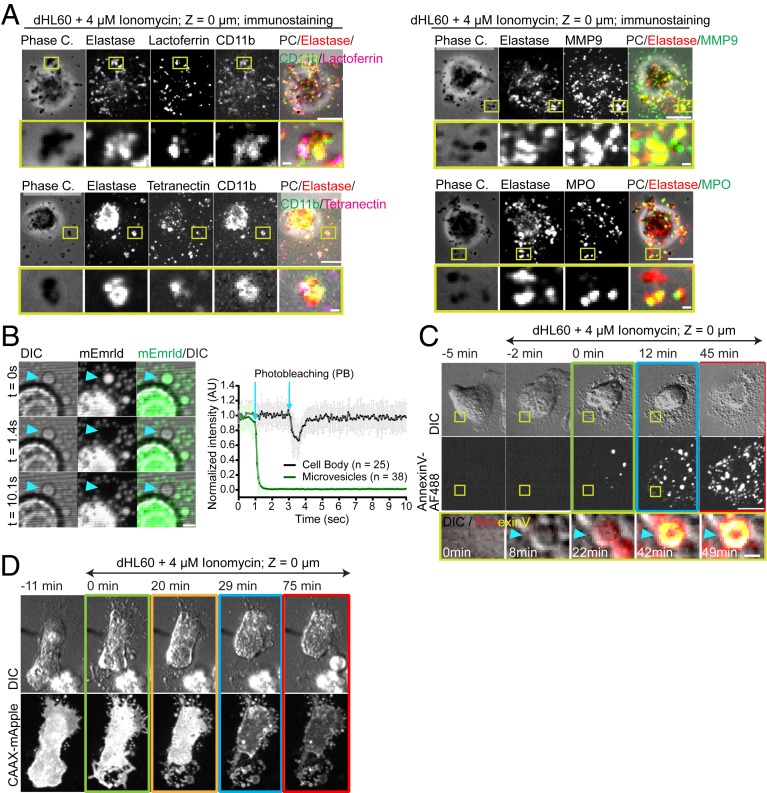
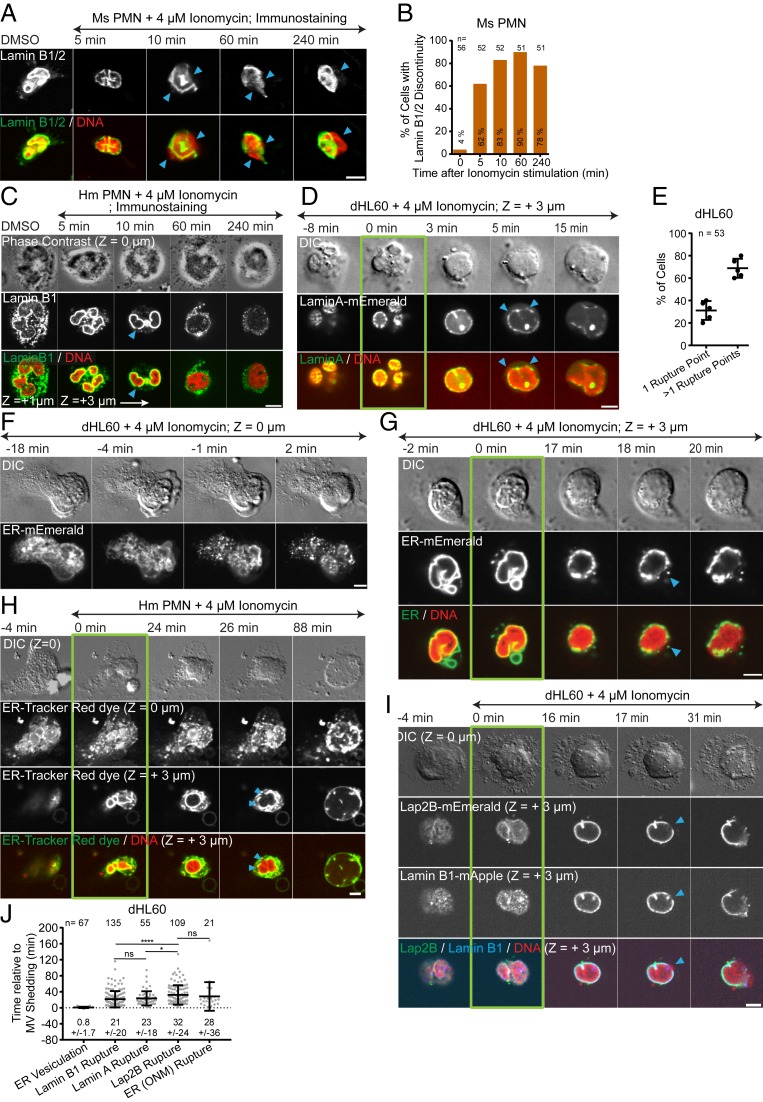
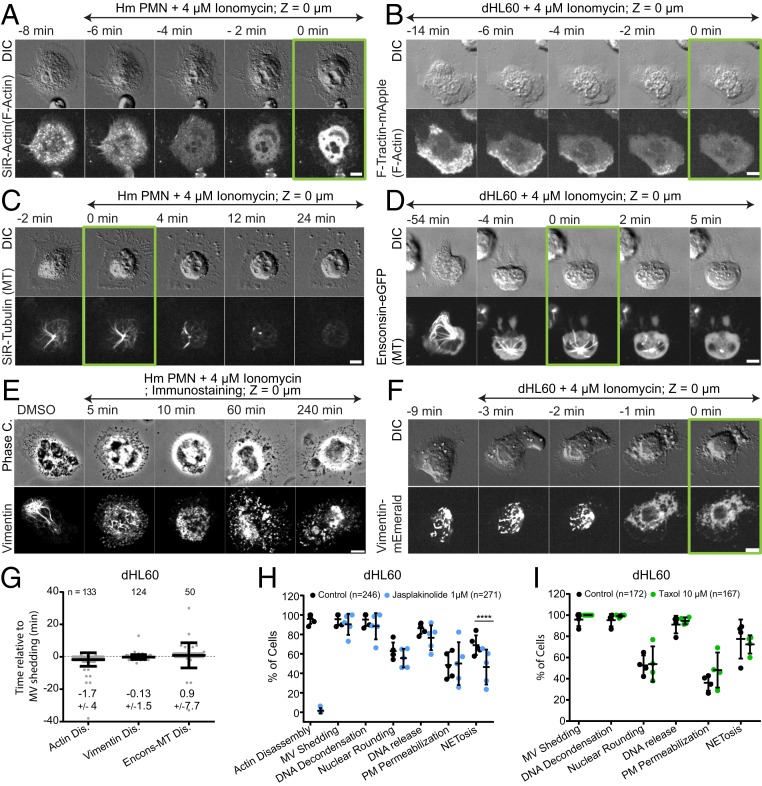
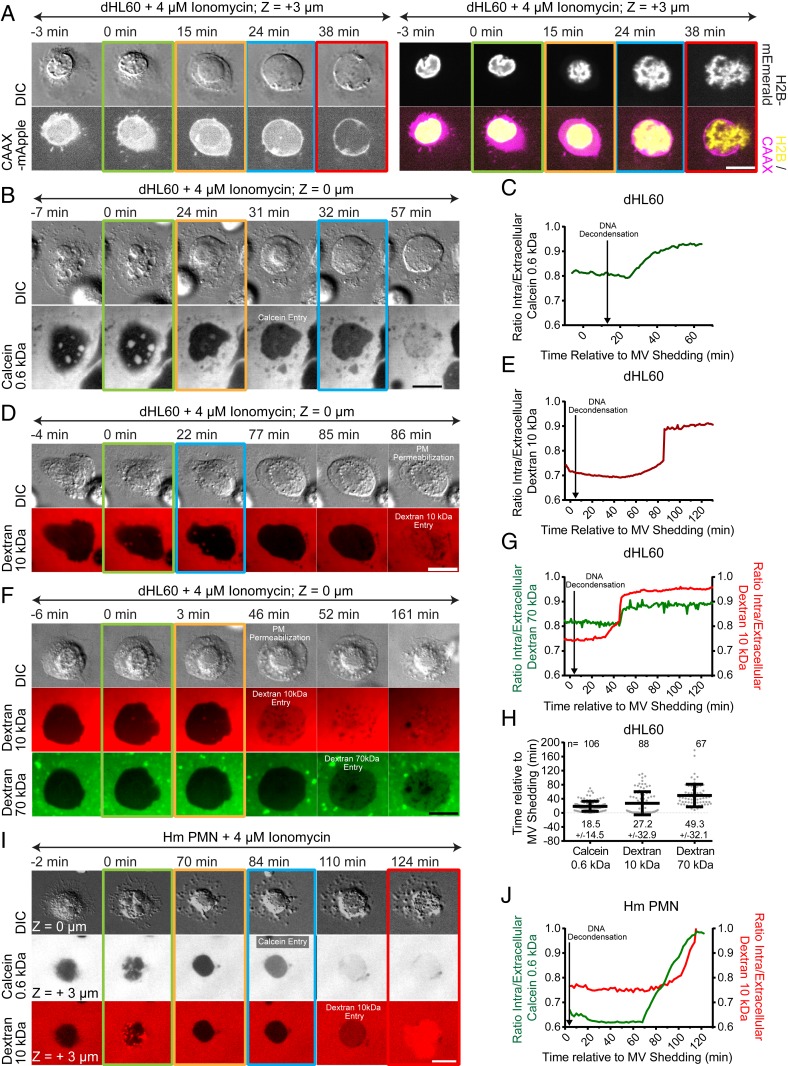
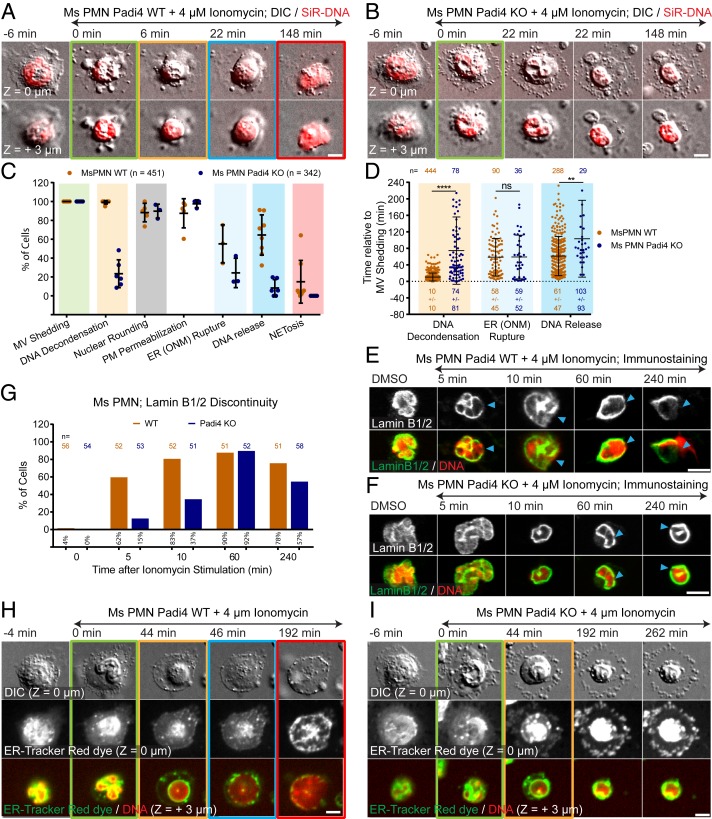
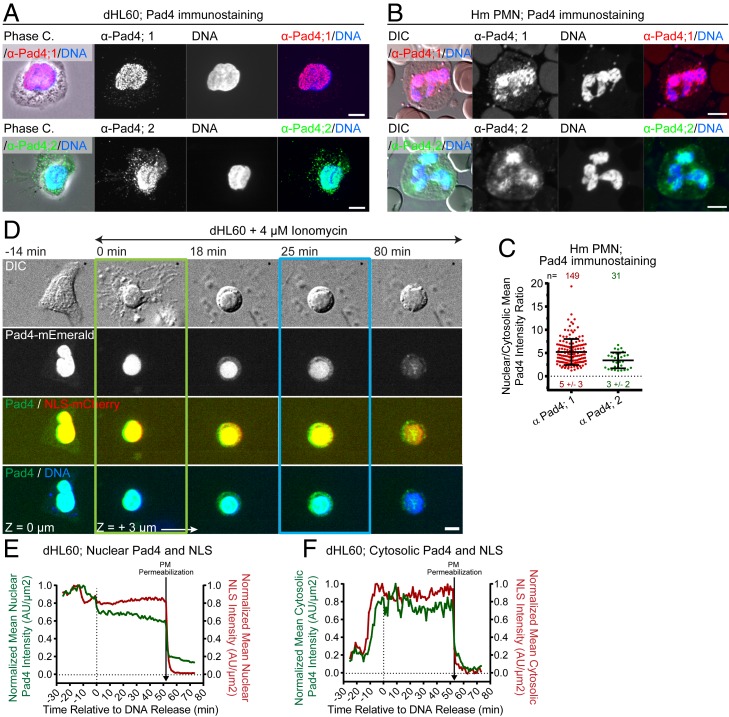
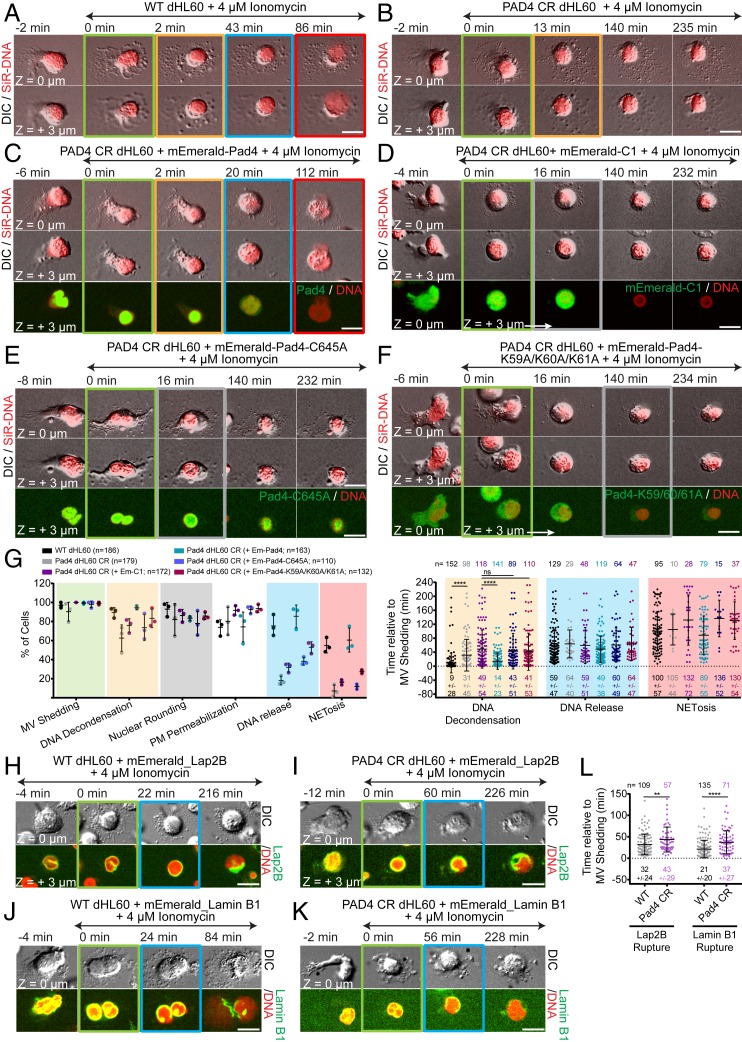
Neutrophil extracellular traps (NETs) are web-like DNA structures decorated with histones and cytotoxic proteins that are released by activated neutrophils to trap and neutralize pathogens during the innate immune response, but also form in and exacerbate sterile inflammation. Peptidylarginine deiminase 4 (PAD4) citrullinates histones and is required for NET formation (NETosis) in mouse neutrophils. While the in vivo impact of NETs is accumulating, the cellular events driving NETosis and the role of PAD4 in these events are unclear. We performed high-resolution time-lapse microscopy of mouse and human neutrophils and differentiated HL-60 neutrophil-like cells (dHL-60) labeled with fluorescent markers of organelles and stimulated with bacterial toxins or Candida albicans to induce NETosis. Upon stimulation, cells exhibited rapid disassembly of the actin cytoskeleton, followed by shedding of plasma membrane microvesicles, disassembly and remodeling of the microtubule and vimentin cytoskeletons, ER vesiculation, chromatin decondensation and nuclear rounding, progressive plasma membrane and nuclear envelope (NE) permeabilization, nuclear lamin meshwork and then NE rupture to release DNA into the cytoplasm, and finally plasma membrane rupture and discharge of extracellular DNA. Inhibition of actin disassembly blocked NET release. Mouse and dHL-60 cells bearing genetic alteration of PAD4 showed that chromatin decondensation, lamin meshwork and NE rupture and extracellular DNA release required the enzymatic and nuclear localization activities of PAD4. Thus, NETosis proceeds by a stepwise sequence of cellular events culminating in the PAD4-mediated expulsion of DNA.

Keywords: innate immunity; microscopy; neutrophil.


Conflict of interest statement

The authors declare no competing interest.

Figures

Fig. 1.
Fig. 1.
NETosis proceeds by vesiculation, DNA decondensation, DNA release from the nucleus into the cytoplasm, and extracellular DNA expulsion in mouse and human blood neutrophils and dHL-60 cells. Mouse (Ms; A, B, I, and J) or human (Hm; EJ) PMNs or dHL-60 cells (C, D, I, and J) stained with far-red SiR-DNA were stimulated with ionomycin (4 μM, AF, I, and J) or dTomato-expressing C. albicans (C. albicans, MOI of 2, GJ, dTomato shown in blue), and imaged by DIC and confocal microscopy at the coverslip–cell interface (Z = 0 μm) and in the cell center (Z = +3 μm) at 1- to 2-min intervals for 4 h. Time (min) relative to plasma membrane microvesicle (MV) shedding noted. Double-arrow-headed lines indicate presence of ionomycin (A, C, and E) or phagocytosed C. albicans (G); colored boxes around images correspond to color coded cellular events in the graphs. C. albicans experiments (G and H) included Sytox green to highlight extracellular DNA. (A, C, E, and G) Time series of image overlays of DIC (grayscale) and fluorescence of cell, C. albicans (blue in G) and DNA (red in A, C, E, red and green in G) dynamics. (B, D, F, and H) Percent of cells exhibiting MV shedding, DNA decondensation, nuclear rounding, DNA release into the cytoplasm, loss of DIC contrast (PM permeabilization), and extracellular DNA release (NETosis) after stimulation. n = total number of cells, each point = percent of cells in one experiment. (I and J) Timing of MV shedding relative to ionomycin or C. albicans stimulation (I) or of cellular event initiation relative to MV shedding (J). N = total number of cells observed, points = individual cells. In B, D, F, H, I, and J: long bar = mean, short bars = SD. (Scale bars In A, C, E, and G: 10 μm.)
Fig. 2.
Fig. 2.
Microvesicles containing cytosolic components are shed from the plasma membrane to initiate NETosis. (AD) dHL-60 cells stimulated with ionomycin. (A) Phase contrast (grayscale) and immunolocalization of neutrophil elastase (Elastase, red), myeloperoxidase (MPO, green), lactoferrin (magenta), CD11b (green), MMP9 (green), and tetranectin (magenta), fixed 30 min after stimulation. (B, Left) DIC and confocal images of a living dHL-60 cell expressing soluble mEmerald (green) before (Upper row), and after (time noted, Middle and Lower row) photobleaching (PB) of the vesicle (arrowhead). (Scale bar: 2 μm.) (Right) Normalized fluorescence intensity of the bleached region over time in regions in the cell body (black) or in microvesicles (MVs) (green), error bar = SD, arrows = time of photobleaching. (C and D) Cells imaged by DIC and confocal microscopy at the coverslip–cell interface (Z = 0 μm) and in the cell center (Z = +3 μm) at 1- to 2-min intervals for 4 h. Time (min) relative to plasma membrane MV shedding noted. Double-arrow-headed lines indicate presence of ionomycin; boxes around images indicate different cellular events (green: MV shedding; yellow: DNA decondensation; blue: DNA release to the cytosol, red: extracellular DNA release). (C and D) Time series of DIC (Upper) and fluorescence of cells in media containing annexin V-Alexa Fluor 488 (AF488, C) or expressing CAAX-mApple (Lower row, D). C, Bottom row: DIC (grayscale) and annexin V-AF488 (red-hot color scale) overlay. (Scale bar: 10 μm.) (A and C) Yellow boxes (Upper rows, Scale bars: 10 μm.) shown zoomed below (Scale bars: 1 μm.).
Fig. 3.
Fig. 3.
ER vesiculation is followed by nuclear lamina disassembly, NE rupture, and release of DNA into the cytoplasm, leading to NETosis. Mouse (Ms; A and B) or human (Hm; C and H) PMN or dHL60 cells (DG, I, and J) stimulated with ionomycin and fixed (A and C, time noted) or imaged live (D and FI) by DIC and confocal microscopy at the coverslip–cell interface (Z = 0 μm) and in the cell center (Z = +3 μm) at 1- to 2-min intervals for 4 h. Time (min) relative to MV shedding noted. Double-arrow-headed lines indicate presence of ionomycin. Arrowheads, lamina or NE rupture points. (D and GI) Green boxes around images indicate MV shedding. (A and C) Immunofluorescence of lamin B1/B2 in Ms PMN (A, Upper row and Bottom row, green) or of lamin B1 in Hm PMN (C, Middle row and Bottom row, green) and staining of DNA with DAPI (A, 10 min, C) or SiR-DNA (A, DMSO, 5, 60, and 240 min) (Bottom row, red) fixed after ionomycin stimulation at the time noted. (C, Top row) Phase contrast images at Z = 0 μm; Middle and Bottom rows: confocal images at Z = 0 μm and Z = +1 μm, Z = +3 μm. (B) Percent (numbers in bar) of Ms PMN exhibiting lamin meshwork discontinuities, 0 = DMSO control. n = total cells. (D) Time-series of DIC (Top row) and confocal (Lower rows) images of dHL60 cells expressing lamin A-mEmerald (Middle row and Bottom row, green) and stained with SiR-DNA (Bottom row, red). (E) Percent of cells with one or more rupture points. n = total number of cells, each point = percent of cells in one experiment. (FI) Time series of DIC (Upper rows) and confocal (Lower rows) images of dHL60 cells (F, G, and I) expressing ER-mEmerald (F, Bottom row; G, Middle and Bottom row, green) or coexpressing Lap2β-mEmerald (I, second row and bottom row, green) and lamin B1-mApple (I, third row and bottom row, blue), or live Hm PMN (H) stained with ER-Tracker Red (H, Middle rows and Bottom row, green) and stained with SiR-DNA (GI Bottom rows red). (J) Timing of initiation of ER vesiculation or Lamin B1 or Lamin A rupture, Lap2β rupture or outer NE rupture (ER [ONM]) relative to MV shedding in dHL-60 cells. n = total number of cell observed, points = individual cells. (E and J) Mean (long bar) and SD (short bar), shown below each plot. ****P < 0.0001; *P < 0.1; ns, nonsignificant. Statistical test: Mann–Whitney U test. (Scale bars in A, C, D, FI: 5 μm.)
Fig. 4.
Fig. 4.
The actin, MT, and vimentin cytoskeletons disassemble prior to NETosis, and F-actin disassembly is important for NET release. Human (Hm) PMN (A, C, and E) or dHL-60 cells (B, D, F, and GI) stimulated with ionomycin and fixed (time noted, E) or imaged by DIC and confocal microscopy at the coverslip–cell interface (Z = 0 μm) and in the cell center (Z = +3 μm) at 1- to 2-min intervals for 4 h, time relative to microvesicle (MV) shedding noted. Double-arrow-headed lines indicate presence of ionomycin. (AF) Time-series of DIC (AD and F) or phase contrast (E) (Top rows) and confocal (Lower rows) images of live (A and C) or fixed (E) Hm PMN or live dHL-60 cells (B, D, and F). (A and B) Actin visualized with far red SiR-actin (A) or expression of F-Tractin-mApple (B). (C and D) MTs visualized with far red SiR-tubulin (C) or expression of Ensconsin-eGFP (D). (E and F) Immunolocalized vimentin (E) or expression of vimentin-mEmerald (F). (AD and F) Green boxes around images indicate MV shedding. (G) Timing of actin, MT, and vimentin disassembly (Dis) relative to MV shedding. n = total number of cell observed, points represent individual cells, mean (long bar) and SD (short bar) shown below each plot. (H and I) Percent of cells exhibiting actin disassembly, MV shedding, DNA decondensation, nuclear rounding, DNA release into the cytoplasm, loss of DIC contrast (plasma membrane (PM) permeabilization, and extracellular DNA release (NETosis) after stimulation in cells treated with vehicle (control), jasplakinolide (1 μM, H), or taxol (10 μM, I), n = total of cell observed, points = percent of cells in one experiment, long bar = mean, short bars = SD. Statistical test: Fisher’s exact test, ****P < 0.0001. (Scale bars in AF: 5 μm.)
Fig. 5.
Fig. 5.
Plasma membrane becomes permeable to progressively larger molecules prior to plasma membrane rupture and NET release. dHL-60 (AH) or human (Hm) PMN (I and J) stimulated with ionomycin imaged by DIC and confocal microscopy at the coverslip–cell interface (Z = 0 μm) and in the cell center (Z = +3 μm) at 1- to 2-min intervals for 4 h, time relative to MV shedding noted. Double-arrow-headed lines indicate presence of ionomycin; colored boxes around images correspond to color coded cellular events in the graphs in Fig. 1. (A) Time series of DIC (Upper Left) and fluorescence images of a dHL-60 cell coexpressing CAAX-mApple (Lower Left and Right, magenta) and H2B-mEmerald (Upper Right and Bottom Right, yellow). (B, D, F, and I) Time series of DIC (Upper row) and fluorescence (Lower rows) images of dHL-60 (B, D, and F) or Hm PMN (I) cells and calcein (622 Da, B and I, grayscale), Alexa Fluor 647 (D and F, red) or Alexa Fluor 594 (I, red), 10 kDa dextran, or Oregon Green 488 70 kDa (F, green) added to the media. (C, E, G, and J) Normalized intracellular fluorescence of calcein (C and J, green), 10 kDa (E, G, and J, red) or 70 kDa (G, green) dextran over time (in min). Time points of DNA decondensation noted. (H) Onset of calcein, 10 or 70 kDa fluorescent dextran cellular entry relative to MV shedding in dHL-60 cells. n = total number of cell observed, points = individual cells, mean (long bar) and SD (short bar) shown below each plot. (Scale bars in A, B, D, F, and I: 10 μm.)
Fig. 6.
Fig. 6.
PAD4 is critical to DNA decondensation, NE rupture, and extracellular DNA expulsion in mouse PMN. PMN from Padi4 WT or Padi4 KO mice (Ms) stimulated with ionomycin, stained with SiR-DNA, and imaged live (A, B, H, and I) by DIC and confocal microscopy at the coverslip–cell interface (Z = 0 μm) and in the cell center (Z = +3 μm) at 2-min intervals for 4 h, time relative to MV shedding noted, or fixed (E and F) after stimulation (time noted). Double-arrow-headed lines above images indicate presence of ionomycin, colored boxes around images correspond to color coded cellular events in the graphs (C). (A, B, H, and I). Time series of image overlays of DIC (Top rows, grayscale) and SiR-DNA (Bottom rows, red). (C) Percent of cells exhibiting MV shedding, DNA decondensation, nuclear rounding, loss of DIC contrast (PM permeabilization) and outer nuclear membrane (ER(ONM)) rupture in cells stained with ER-Tracker Red, DNA release into the cytoplasm, and extracellular DNA release (NETosis) after ionomycin stimulation. n = total cells, point = percent of cells in one experiment. (D) Timing relative to MV shedding of DNA decondensation, ER (ONM) rupture and DNA release. n = total cells observed, point = individual cells, mean (long bar) and SD (short bar) shown below each plot. **** and ** for P value < 0.0001, and <0.01, respectively; ns, nonsignificant, Mann–Whitney U test. (E and F) Immunofluorescence of lamin B1/B2 (Upper row and Bottom row, green) and DAPI (at 10 min) or SiR-DNA (in DMSO, and at 5, 60, and 240 min) staining of DNA (Bottom row, red) in fixed WT (E) or PAD4 KO Ms PMN (F). Arrowheads, rupture points in the lamina. (G) Percent (numbers below bars) of cells with discontinuities in lamin B1/B2 meshwork (time after stimulation noted, 0 = DMSO control). n = total cells. (H and I) Cells stained with ER-Tracker Red (Middle row and Bottom row, green) and SiR-DNA (Bottom row, red). (Scale bars in A, B, E, F, H, and I: 5 μm.)
Fig. 7.
Fig. 7.
PAD4 localizes to the nucleus and enters the cytosol prior to nuclear rupture. dHL-60 (A, D, E, and F) or human (Hm) PMN (B and C) fixed (A and B) or stimulated with ionomycin and imaged live by DIC and confocal microscopy (D) at the coverslip–cell interface (Z = 0 μm) and in the cell center (Z = +3 μm) at 2-min intervals for 4 h, time relative to MV shedding noted. (A and B) Phase-contrast (A, phase C), or DIC (B) and confocal images of DAPI staining of DNA (blue) and immunolocalization of PAD4 by two different antibodies (α-Pad4; 1 [red] and 2 [green]). (C) Mean nuclear to cytosolic ratio of PAD4 intensity from immumostaining. n = total cells observed, points = individual cells, mean (long bar) and SD (short bar) below each plot. (D) Time series of a dHL-60 coexpressing PAD4-mEmerald (Middle and Bottom, green), and NLS-mCherry (third row, red) and SiR-DNA (Bottom row, blue). Double-arrow-headed lines indicate presence of ionomycin, boxes around images indicate cellular events (green: MV shedding; blue: DNA release to the cytosol). (E and F) Normalized mean nuclear (E) and cytosolic (F) intensity over time of PAD4-mEmerald and NLS-mCherry measured from the cell in (D). Loss of DIC contrast (PM permeabilization) noted. (Scale bars in A, B, and D: 5 μm.)
Fig. 8.
Fig. 8.
PAD4 enzymatic and nuclear localization activities mediate efficient DNA decondensation, NE rupture and extracellular DNA expulsion in human dHL-60. dHL-60 (WT; A, G, H, J, and L) or PAD4 CR dHL-60 (BG, I, K, and L), stained with SiR-DNA, stimulated with ionomycin, and imaged by DIC and confocal microscopy at the coverslip–cell interface (Z = 0 μm) and in the cell center (Z = +3 μm) at 2-min intervals for 4 h, time in min relative to MV shedding noted on images. Double-arrow-headed lines indicate presence of ionomycin, colored boxes around images correspond to color-coded cellular events in the graphs. (AF and HK) Time series of image overlays of DIC (grayscale) and SiR-DNA (red). (CF) PAD4 CR dHL-60 cells expressing mEmerald-PAD4 (C; Bottom row, green), mEmerald (D; Bottom row, green), mEmerald-PAD4-C645A (E; Bottom row, green) or mEmerald-PAD4-K59A/K60A/K61A (F; Bottom row, green). (G, Left) Percent of cells exhibiting MV shedding, DNA decondensation, nuclear rounding, loss of DIC contrast (PM permeabilization), DNA release to the cytoplasm, and extracellular DNA release (NETosis); (G, Right) Timing relative to MV shedding of DNA decondensation, DNA release to the cytoplasm, and NETosis after ionomycin stimulation. n = total cells observed, point = percent of cells in one experiment (Left), or individual cells (Right). Long bar = mean, short bars = SD shown below each plot (Right). (HK) WT or PAD4 CR dHL-60 cells expressing Lap2β-mEmerald (H and I; Bottom rows, green) or lamin B1-mEmerald (J and K; Bottom rows, green). (L) Timing relative to MV shedding of the Lap2β or laminB1 rupture. n = total cells observed, points = individual cells, mean (long bar) and SD (short bar) shown below each plot. (G and L) ****P < 0.0001; **P < 0.01; ns, nonsignificant; (G Left and L): Mann–Whitney U test. (Scale bars in AF and HK: 10 μm.)

Comment in

Similar articles

Cited by

References

    1. Brinkmann V., et al. , Neutrophil extracellular traps kill bacteria. Science 303, 1532–1535 (2004). - PubMed
    1. Urban C. F., Reichard U., Brinkmann V., Zychlinsky A., Neutrophil extracellular traps capture and kill Candida albicans yeast and hyphal forms. Cell. Microbiol. 8, 668–676 (2006). - PubMed
    1. Saitoh T., et al. , Neutrophil extracellular traps mediate a host defense response to human immunodeficiency virus-1. Cell Host Microbe 12, 109–116 (2012). - PubMed
    1. Sorvillo N., Cherpokova D., Martinod K., Wagner D. D., Extracellular D. N. A., Extracellular DNA NET-works with dire consequences for health. Circ. Res. 125, 470–488 (2019). - PMC - PubMed
    1. Clark S. R., et al. , Platelet TLR4 activates neutrophil extracellular traps to ensnare bacteria in septic blood. Nat. Med. 13, 463–469 (2007). - PubMed

Publication types

LinkOut - more resources