. 2020 Mar 31;117(13):7430-7436.
doi: 10.1073/pnas.1912064117. Epub 2020 Mar 13.

Imaging local genetic influences on cortical folding

Affiliations

Imaging local genetic influences on cortical folding

Aaron F Alexander-Bloch et al. Proc Natl Acad Sci U S A. .

Erratum in

Abstract

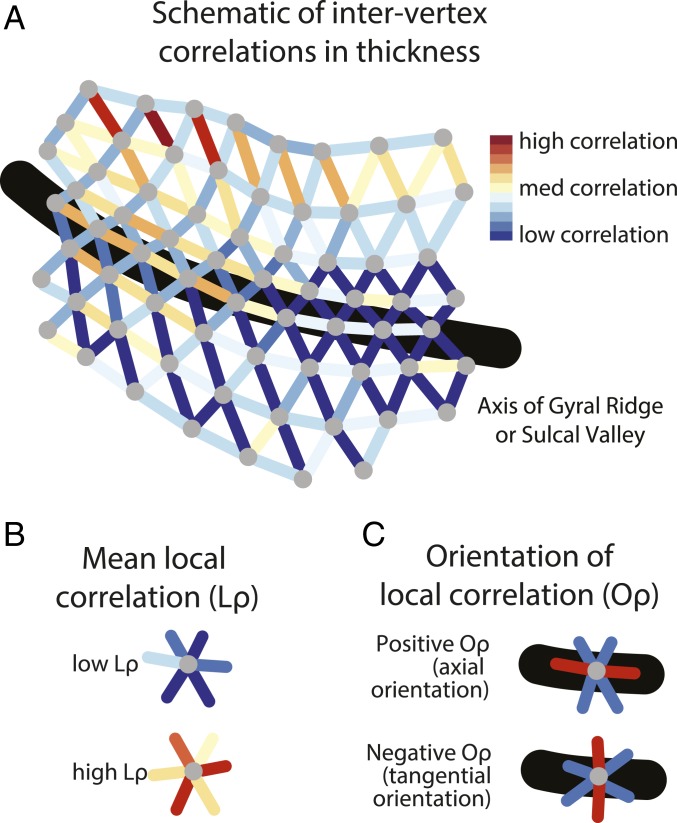
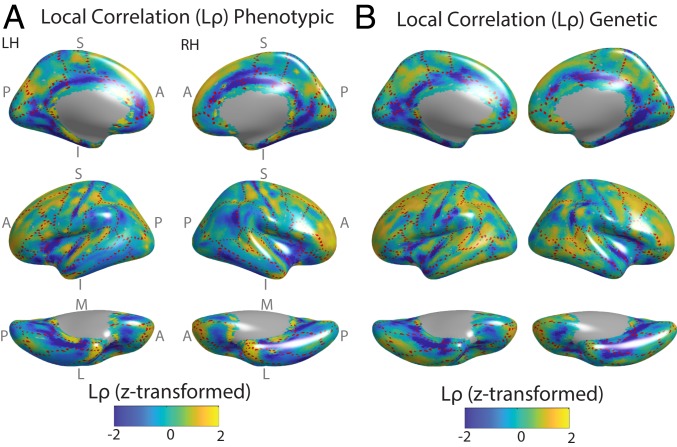
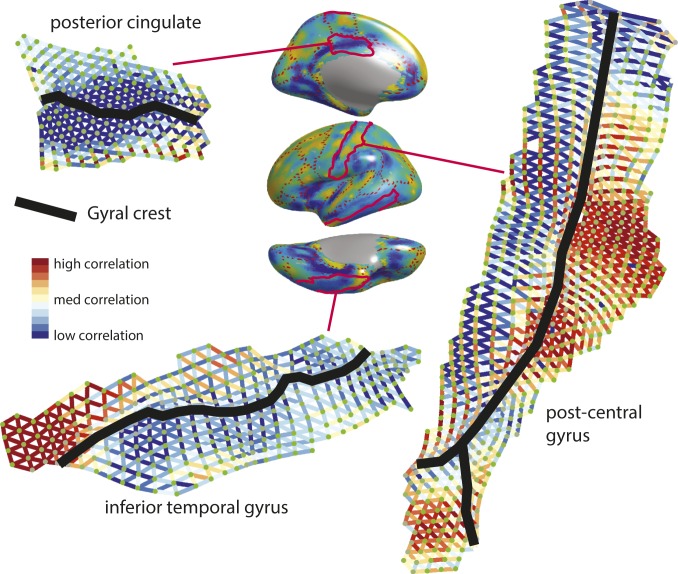
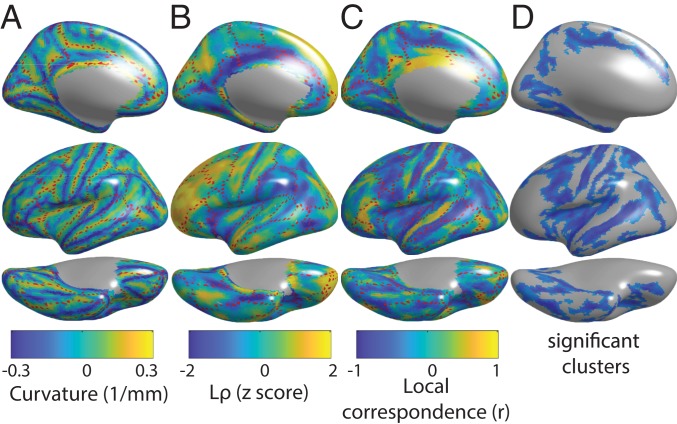
Recent progress in deciphering mechanisms of human brain cortical folding leave unexplained whether spatially patterned genetic influences contribute to this folding. High-resolution in vivo brain MRI can be used to estimate genetic correlations (covariability due to shared genetic factors) in interregional cortical thickness, and biomechanical studies predict an influence of cortical thickness on folding patterns. However, progress has been hampered because shared genetic influences related to folding patterns likely operate at a scale that is much more local (<1 cm) than that addressed in prior imaging studies. Here, we develop methodological approaches to examine local genetic influences on cortical thickness and apply these methods to two large, independent samples. We find that such influences are markedly heterogeneous in strength, and in some cortical areas are notably stronger in specific orientations relative to gyri or sulci. The overall, phenotypic local correlation has a significant basis in shared genetic factors and is highly symmetric between left and right cortical hemispheres. Furthermore, the degree of local cortical folding relates systematically with the strength of local correlations, which tends to be higher in gyral crests and lower in sulcal fundi. The relationship between folding and local correlations is stronger in primary sensorimotor areas and weaker in association areas such as prefrontal cortex, consistent with reduced genetic constraints on the structural topology of association cortex. Collectively, our results suggest that patterned genetic influences on cortical thickness, measurable at the scale of in vivo MRI, may be a causal factor in the development of cortical folding.

Keywords: cerebral cortex; cortical folding; cortical thickness; genetic correlation; structural MRI.


Conflict of interest statement

The authors declare no competing interest.

Figures

Fig. 1.
Fig. 1.
Schematic of methodological approaches. (A) An illustration of a patch of triangular mesh fit to the cortical surface. Vertices are colored gray. Edges between two vertices are colored in accordance with the correlation in the interindividual variation in the cortical thickness of the two vertices. (B) Mean local correlation is the average of the correlation in the interindividual variation of the vertex with that of its neighbors. (C) Correlation orientation () is the difference between the axial correlation (parallel or close-to-parallel to the long axis of the local gyrus or sulcus) and the tangential correlation (perpendicular or close-to-perpendicular to this axis).
Fig. 2.
Fig. 2.
Shared, local genetic influences on the pattern of cortical thickness across the cortex, in the GOBS datasets. (A) For all subjects, thickness was estimated at ∼10,000 vertices of the triangular mesh fit to the left and right cortical surface, and the interindividual variation of each vertex was correlated with the interindividual variation of each of its neighbors (here, adjacent vertices on the cortical mesh) to yield the phenotypic correlation. After regressing out the nonlinear relationship between the anatomical distance between vertices and these correlations, the local correlation () of each vertex was calculated as the mean of its correlations with its neighbors. For purposes of visualization, was z-transformed within each cortical map. The dashed red lines mark boundaries between gyral regions of FreeSurfer’s Desikan atlas (38), such that the dashed lines generally occur within sulcal fundi. (B) The phenotypic correlation was decomposed into environmental (SI Appendix, Fig. S2) and genetic components based on the subjects’ extended pedigree structure. Genetic was then calculated analogously to A. There is a strong and statistically significant anatomical correspondence between these maps (SI Appendix, Fig. S3). A, anterior; I, inferior; L, lateral; LH, left hemisphere; M, medial; P, posterior; RH, right hemisphere; S, superior.
Fig. 3.
Fig. 3.
Flattened surfaces showing the phenotypic correlations between adjacent vertices, which are the basis for the brain maps of average local correlation () and orientation of local correlation (). Phenotypic is shown on the surface plot in the center (as per Fig. 1), with three anatomical gyri outlined in red. Flat maps of these gyri are shown, clockwise from center: postcentral gyrus, inferior temporal gyrus, and posterior cingulate. A relationship between phenotypic correlation and the location of the gyral crest within these gyri can be observed in each of these cases.
Fig. 4.
Fig. 4.
Mean phenotypic local correlation (Lρ) and its relationship with gyral–sulcal organization as measured by mean curvature. (A) Map of mean curvature. Sulci are positively curved, while gyri are negatively curved. (B) Map of Lρ. (C) Map of local correspondence between mean curvature and . (D) Significant clusters of local correspondence based on the spin test. See SI Appendix, Fig. S8 for analogous maps showing both cerebral hemispheres.

References

    1. Hilgetag C. C., Barbas H., Role of mechanical factors in the morphology of the primate cerebral cortex. PLoS Comput. Biol. 2, e22 (2006). - PMC - PubMed
    1. Van Essen D. C., A tension-based theory of morphogenesis and compact wiring in the central nervous system. Nature 385, 313–318 (1997). - PubMed
    1. Xu G., et al. , Axons pull on the brain, but tension does not drive cortical folding. J. Biomech. Eng. 132, 071013 (2010). - PMC - PubMed
    1. Caviness V., Mechanical model of brain convolutional development. Science 189, 18–21 (1975). - PubMed
    1. Tallinen T., Chung J. Y., Biggins J. S., Mahadevan L., Gyrification from constrained cortical expansion. Proc. Natl. Acad. Sci. U.S.A. 111, 12667–12672 (2014). - PMC - PubMed

Publication types

LinkOut - more resources