. 2020 Mar 31;117(13):7482-7493.
doi: 10.1073/pnas.1918539117. Epub 2020 Mar 13.

COST1 regulates autophagy to control plant drought tolerance

Affiliations

COST1 regulates autophagy to control plant drought tolerance

Yan Bao et al. Proc Natl Acad Sci U S A. .

Abstract

Plants balance their competing requirements for growth and stress tolerance via a sophisticated regulatory circuitry that controls responses to the external environments. We have identified a plant-specific gene, COST1 (constitutively stressed 1), that is required for normal plant growth but negatively regulates drought resistance by influencing the autophagy pathway. An Arabidopsis thaliana cost1 mutant has decreased growth and increased drought tolerance, together with constitutive autophagy and increased expression of drought-response genes, while overexpression of COST1 confers drought hypersensitivity and reduced autophagy. The COST1 protein is degraded upon plant dehydration, and this degradation is reduced upon treatment with inhibitors of the 26S proteasome or autophagy pathways. The drought resistance of a cost1 mutant is dependent on an active autophagy pathway, but independent of other known drought signaling pathways, indicating that COST1 acts through regulation of autophagy. In addition, COST1 colocalizes to autophagosomes with the autophagosome marker ATG8e and the autophagy adaptor NBR1, and affects the level of ATG8e protein through physical interaction with ATG8e, indicating a pivotal role in direct regulation of autophagy. We propose a model in which COST1 represses autophagy under optimal conditions, thus allowing plant growth. Under drought, COST1 is degraded, enabling activation of autophagy and suppression of growth to enhance drought tolerance. Our research places COST1 as an important regulator controlling the balance between growth and stress responses via the direct regulation of autophagy.

Keywords: Arabidopsis; COST1; autophagy; drought.


Conflict of interest statement

The authors declare no competing interest.

Figures
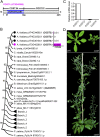
Fig. 1.
Fig. 1.
A conserved plant-specific COST1 (ID: AT2G45260) protein required for normal growth and development. (A) Schematic diagram of the structure of the COST1 protein; the conserved DUF641 domain is indicated at the N terminus (N); numbers below indicate the position of amino acids. (B) Phylogenetic analysis of COST proteins in different plant species. The numbers on the branch node refer to bootstrap value of the phylogenetic tree; 500 bootstrap replicates were performed. Dots denote the four Arabidopsis COST proteins, with COST1 shown in magenta. Fragments per kilobase of transcript per million mapped reads (FPKM) values of the four Arabidopsis COST genes are shown on the right based on the RNA-seq in this study. Protein IDs are listed after abbreviated species names. The full species names are (from top to bottom): Arabidopsis thaliana, Arabidopsis lyrata, Capsella rubella, Brassica rapa, Populus trichocarpa, Solanum lycopersicum, Medicago truncatula, Aquilegia coerulea, Brachypodium distachyon, Oryza Sativa, Zea mays, Amborella trichopoda, Picea abies, and Physcomitrella patens. Triangles represent hidden subtrees, which are shown in detail in SI Appendix, Fig. S2. (C) Analysis of expression of the Arabidopsis COST genes by qPCR. (D) Pleiotropic defects of a cost1 mutant. Four-week-old and 45-d-old WT and cost1 plants are shown in the Upper and Lower, respectively.
Fig. 2.
Fig. 2.
Knockout of COST1 confers drought tolerance and induces the expression of a spectrum of stress-responsive genes. (A and B) WT, cost1 (cost1-1), gCOST1#1 (complementation line with COST1 genomic DNA), and two COST1 RNAi lines (COST1-RNAi#1 and COST1-RNAi#3) were subjected to drought treatment for 2 wk, and the water loss of detached rosette leaves from each genotype was recorded every 30 min for 5 h (C). (D) Expression of representative drought responsive genes in WT and cost1 with and without drought treatment was assessed by qPCR. (E) Clustering of DEGs (fold-change in expression level >2 between two samples) in WT and cost1 plants with and without dehydration treatment, “C” denotes control and “D” denotes dehydration. Color legend denotes normalized gene-expression value. (F and G) Comparison of drought-regulated DEGs in whole-transcriptome RNA-seq. (H and I) Enrichment of Biological Process GOs in drought-regulated DEGs. Color scale: −log10 (adjusted P value). Over- and underrepresentation are shown in red and blue, respectively.
Fig. 3.
Fig. 3.
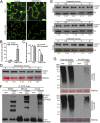
Expression of COST1 during drought stress. (A) Localization and characteristics of COST1-YFP protein after 3 h of dehydration treatment. (Scale bar, 10 µm.) (B and C) Quantification of fluorescence intensity and punctate structures before and after 3 h of dehydration treatment. Signals were quantified for at least 10 images per replicate, with 3 biological replicates. Asterisks indicate significant differences, compared with no treatment. (D) Immunoblot of COST1-YFP protein after dehydration treatment for the indicated times using antibodies against GFP. The number below indicates the band intensity of COST1-YFP, and Ponceau staining was used as a loading control. (E) Immunoblot of COST1-YFP protein after treatment with DMSO (control), MG132, or ConcA. (F) COST1-YFP was immunoprecipitated after treatment with DMSO, MG132, or ConcA under normal conditions, followed by detection using anti-GFP antibodies. (G) Ubiquitination of COST1-YFP after dehydration of 10-d-old COST1-YFP or YFP transgenic plants for 6 h. After immunoprecipitation with GFP-trap, samples were immunoblotted using antibodies against ubiquitin. Transgenic COST1-YFP plants were generated in cost1 mutant background with full complementation.
Fig. 4.
Fig. 4.
Direct interaction between COST1 and ATG8e. (A) Colocalization of COST1-YFP with mCherry-ATG8e and mCherry-NBR1. (Scale bar, 10 µm.) (B) Split luciferase analysis of the interaction between COST1-nLUC and cLUC-ATG8e. Different combinations of GFP-nLUC and cLUC-GFP with and without COST1 or ATG8e were used as negative controls. (C) GST pull-down assay between GST-COST1 and His-ATG8e. GST alone was used as negative control. (D) Co-IP of COST1-Flag with GFP-ATG8e. Agrobacterium-mediated coinfiltrations were carried out in tobacco leaves with combinations of 35S:GFP and 35S:COST1-Flag, and 35S:GFP-ATG8e and 35S:COST1-Flag. After 2 d of incubation, leaves were ground in liquid nitrogen and proteins immunoprecipitated with GFP-Trap. The immunoblot was probed with anti-GFP and anti-Flag antibodies. Leaves expressing 35S:GFP alone were used as a negative control.
Fig. 5.
Fig. 5.
Autophagy is required for drought tolerance of the cost1 mutant. (A) WT, cost1, and the two cost1 atg double mutants after exposure to drought for 2 wk. (B and C) Water loss upon drought treatment of cost1 in combination with atg5-1 and atg7-2. Three independent experiments were done with similar results. Values are means ± SE of three replicates and at least 10 leaves from each genotype were assessed per replicate. Asterisks indicate significant difference. (D) Ten-day-old seedlings of the indicated genotypes were treated with or without 300 mM mannitol for 6 h, stained with MDC, and elongation zones of the roots were observed by epifluorescence. (Scale bar, 50 µm.) (E) Autophagosomes from D were quantified for at least 10 images per replicate, with 3 biological replicates. Asterisks indicate significant differences.
Fig. 6.
Fig. 6.
COST1 is a negative regulator of autophagy. (A) Confocal microscopy analysis of autophagy in the same autophagosome marker line GFP-ATG8e in the genetic background of WT, cost1, and COST1 overexpression lines #35 and #42. (Scale bar, 50 µm) Ten-day-old seedlings were treated with dehydration for 6 h or starvation for 16 h and representative images are shown. (B) Analysis of GFP-ATG8e cleavage as an indicator of autophagy activity in WT, cost1, and two COST1 overexpression lines with and without 6-h dehydration. Ponceau staining was used as a loading control. (C) Assay for drought tolerance of WT, cost1, and two COST1 overexpression lines. Four-week-old plants of the indicated genotypes were subjected to water withholding for 2 wk and a representative image is shown. (D) A working model of COST1 function in the drought response. Under normal growth conditions, COST1 inhibits stress responses by directly interacting with ATG8, leading to degradation and thus favoring plant growth. In stress conditions, COST1 proteins are degraded by both the 26S proteasome and autophagy, releasing ATG8, and thus the repression of autophagy, and in turn conferring drought tolerance.

Comment in

References

    1. Pennisi E., Plant genetics. The blue revolution, drop by drop, gene by gene. Science 320, 171–173 (2008). - PubMed
    1. Mittler R., Blumwald E., Genetic engineering for modern agriculture: Challenges and perspectives. Annu. Rev. Plant Biol. 61, 443–462 (2010). - PubMed
    1. Zhu J. K., Salt and drought stress signal transduction in plants. Annu. Rev. Plant Biol. 53, 247–273 (2002). - PMC - PubMed
    1. Yamaguchi-Shinozaki K., Shinozaki K., Transcriptional regulatory networks in cellular responses and tolerance to dehydration and cold stresses. Annu. Rev. Plant Biol. 57, 781–803 (2006). - PubMed
    1. Stone S., The role of ubiquitin and the 26S proteasome in plant abiotic stress signaling. Front. Plant Sci. 5, 135 (2014). - PMC - PubMed

Publication types

MeSH terms