. 2020 Mar 13;11(1):1395.
doi: 10.1038/s41467-020-15229-5.

An engineered oncolytic virus expressing PD-L1 inhibitors activates tumor neoantigen-specific T cell responses

Affiliations

An engineered oncolytic virus expressing PD-L1 inhibitors activates tumor neoantigen-specific T cell responses

Guan Wang et al. Nat Commun. .

Abstract

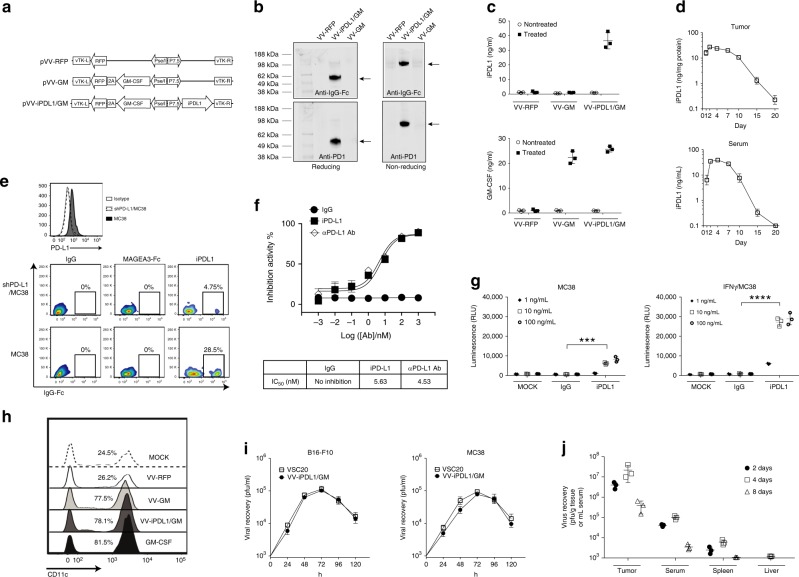
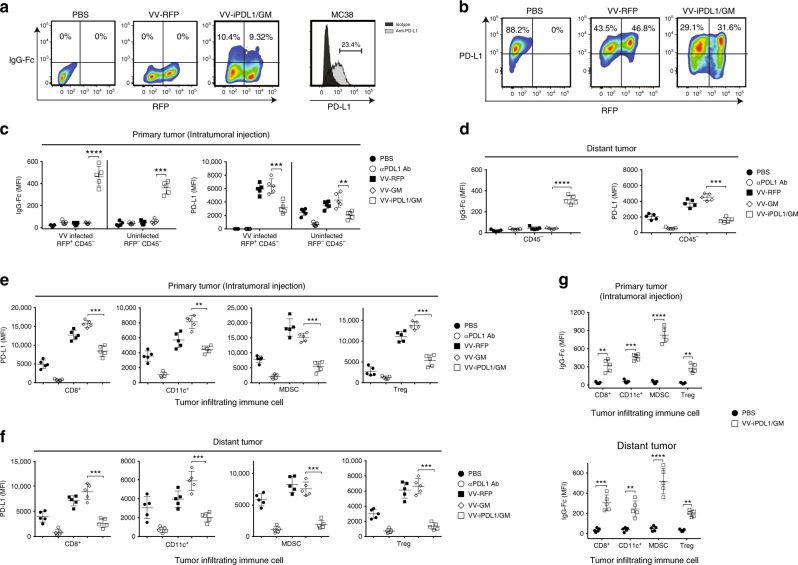
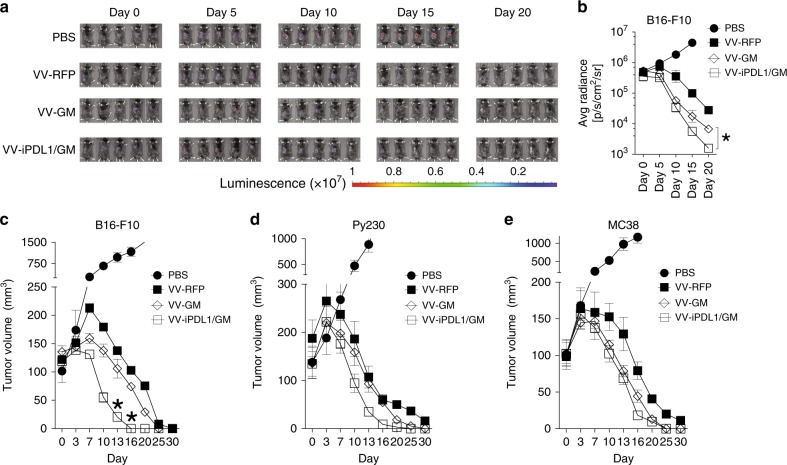
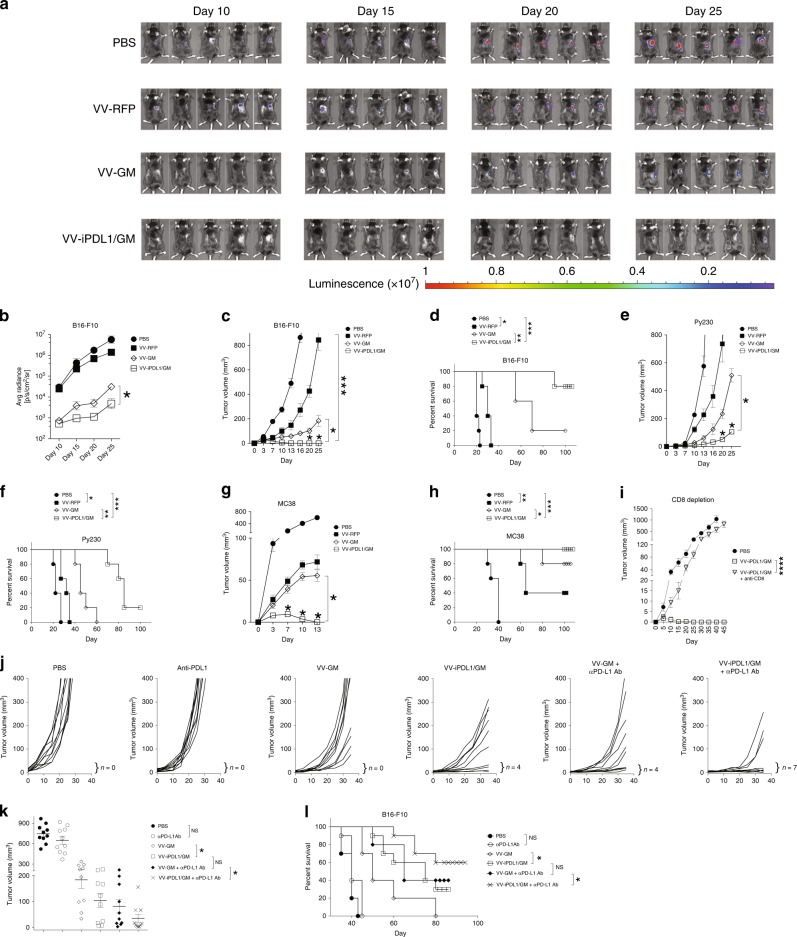
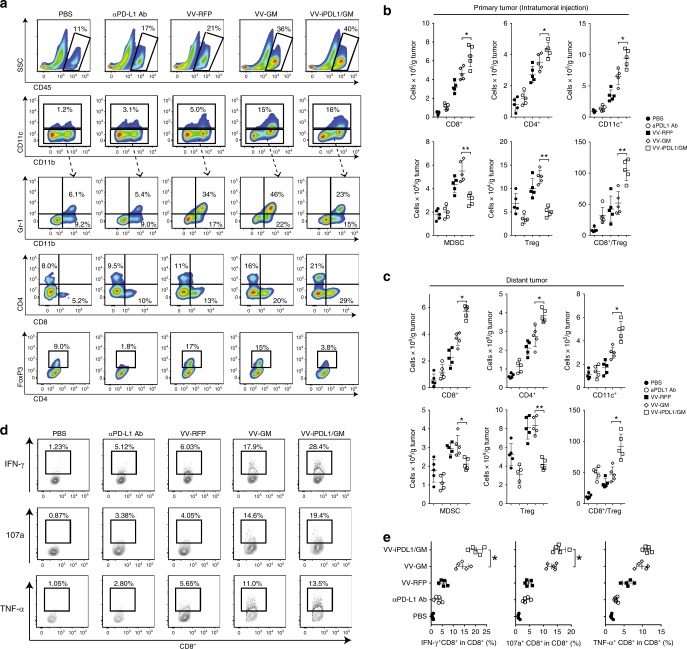
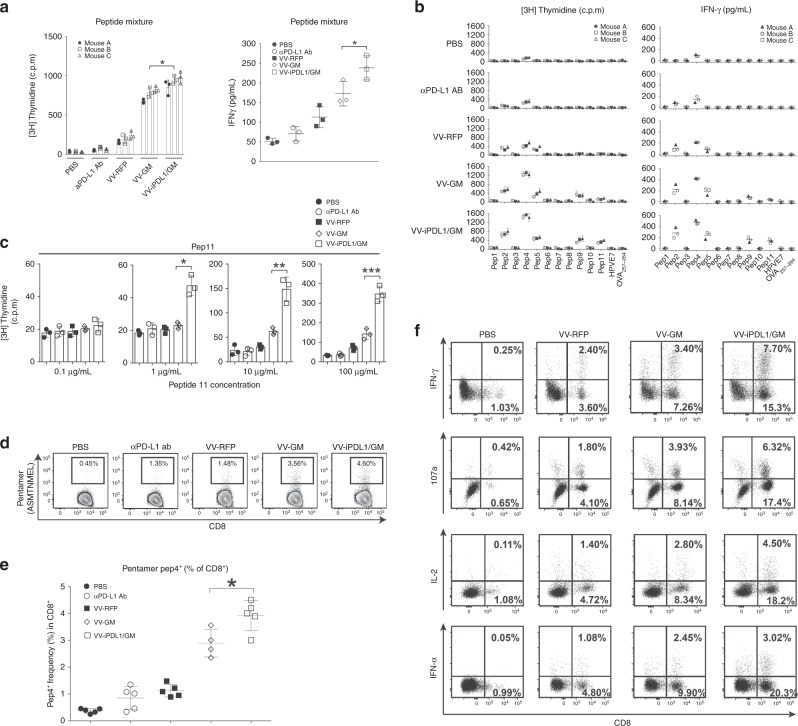
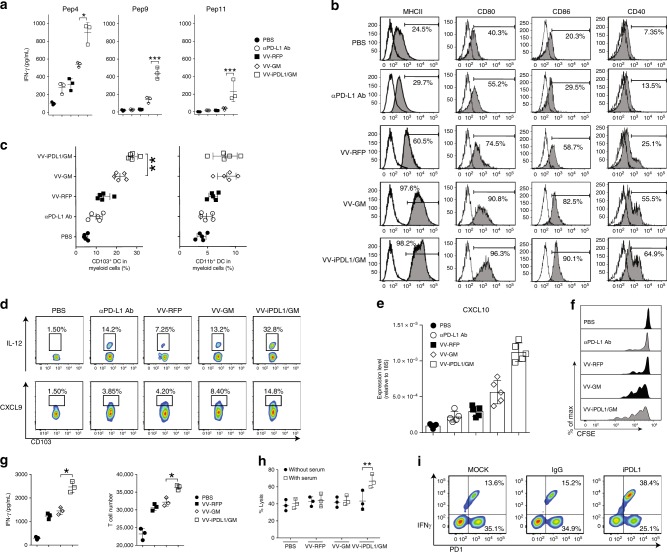
Oncolytic viruses offer an in situ vaccination approach to activate tumor-specific T cell responses. However, the upregulation of PD-L1 expression on tumor cells and immune cells leads to tumor resistance to oncolytic immunotherapy. In this study, we generate an engineered oncolytic virus that coexpresses a PD-L1 inhibitor and GM-CSF. We find that the oncolytic virus is able to secrete the PD-L1 inhibitor that systemically binds and inhibits PD-L1 on tumor cells and immune cells. Importantly, the intratumoral injection with the oncolytic virus overcomes PD-L1-mediated immunosuppression during both the priming and effector phases, provokes systemic T cell responses against dominant and subdominant neoantigen epitopes derived from mutations, and leads to an effective rejection of both virus-injected and distant tumors. In summary, this engineered oncolytic virus is able to activate tumor neoantigen-specific T cell responses, providing a potent, individual tumor-specific oncolytic immunotherapy for cancer patients, especially those resistant to PD-1/PD-L1 blockade therapy.


Conflict of interest statement

X.F.H. and J.C. are employees and shareholders of Pomona Biotechnology Corp. X.F.H. is also a shareholder of LifeSeq Limited Corp. The remaining authors declare no competing interests.

Figures

Fig. 1
Fig. 1. Generation and characterization of an oncolytic vaccinia virus coexpressing a mouse PD-L1 inhibitor and GM-CSF.
a A schematic diagram of recombinant vaccinia virus (VV) shuttle vectors that express GM-CSF or/and iPDL1 (soluble PD-1-Fc). vTK, VV thymidine kinase gene; R and L, right and left flank sequences; RFP, red fluorescent protein. b Expression and secretion of iPDL1 from infected MC38 tumor cells infected with the indicated VVs. Anti-IgG Fc (Licor 926-32210; upper) or anti-PD-1 (Biolegend 114101; lower) was used for western blot with reducing or non-reducing loading buffer. The experiment was repeated twice. c, d Serum iPDL1 and GM-CSF levels in different VV-treated MC38-bearing mice at 2 days post-virus injection c. Kinetics of iPDL1 levels in injected tumors or sera of the VV-iPDL1/GM-treated mice d. n = 3 independent samples. Data are presented as the means ± SD. The experiment was repeated twice. e Purified iPDL1 binds to PD-L1+ tumor cell. Upper panel: flow cytometric analysis of PD-L1 expression on shPD-L1/MC38 tumor cells that were transduced with PD-L1-shRNA and wild-type MC38 cells. Lower panel: shPD-L1/MC38 cells and wild-type MC38 cells were incubated with 50 μg/mL of purified iPDL1, an irrelevant MAGE3-IgG Fc fusion protein, or IgG control, followed by staining with an anti-IgG Fc for flow cytometry. f Inhibition of PD-1/PD-L1 binding by purified iPDL1 protein using ELISA. An anti-PD-L1 antibody was used as a positive control; n = 3 independent samples. g iPDL1-mediated ADCC. ADCC Reporter Bioassays were performed in triplicate wells, and the concentrations of iPDL1 protein and control IgG Fc used for this assay are indicated; n = 3 independent samples. Data presented as the means ± SD. The experiment was repeated twice. Significant differences are indicated as ***P < 0.001, or ****P < 0.0001 using two-tailed student’s t-test. h CD11c+ DC frequency in monocyte cultures in the presence of culture media of MC38 cells infected with VV-RFP, VV-GM, VV-iPDL1/GM, or GM-CSF as a positive control, and IL-4. i Viral replication in vitro; n = 3 independent samples. j Replication and biodistribution of VV after intratumor injections. Data presented as the means ± SD. The experiment was repeated twice.
Fig. 2
Fig. 2. PD-L1 inhibitors secreted from VV-iPDL1/GM-infected cells bind to PD-L1 on tumor cells and immune cells.
a MC38 tumor cells were infected with VV-RFP, VV-iPDL1/GM at an MOI = 0.5, or PBS for 24 h. The percentage of IgG Fc+ population representing iPDL1 (soluble PD-1-IgG Fc)-bound VV-infected (RFP+) or uninfected (RFP) PD-L1-expressing tumor cells was measured by flow cytometry. b MC38 tumor cells that were stimulated with IFN-γ (20 ng/mL) for 48 h were infected with the indicated VVs. PD-L1 expression of infected (RFP+) or uninfected (RFP) cells was determined by flow cytometry. cg MC38 cells were subcutaneously inoculated into the left (1 × 106) and right (5 × 105) flanks of C57BL/6 mice. When left flank tumor sizes reached ~100 mm3 (counted as day 0), the tumors of the left flank were intratumorally injected with 50 μL of PBS, VV-RFP, VV-GM, or VV-iPDL1/GM (5 × 107 pfu per tumor), or 200 μg of anti-PD-L1 antibody (clone 10F.9G2) intravenously on days 0 and 3. Two days post-second VV treatment, VV-treated (primary tumor) and untreated, distant tumors were collected, weighed and digested with collagenase type I and DNase. Tumor cell suspensions were blocked with anti-CD16/32 antibody and then stained with antibodies against CD45, CD3, CD8, CD4, CD11c, CD11b, Gr-1, FoxP3, PD-L1, and IgG Fc to assess PD-L1 expression or IgG Fc+ frequency on infected (RFP+) or uninfected (RFP) tumor cells from the treated primary tumors c or untreated distant tumors (CD45 cells) d, and PD-L1 expression on infiltrating immune cells from treated e or untreated distant tumors f, IgG Fc+ frequency on infiltrating immune cells g. Infiltrating immune cells include cytotoxic T cells (CD45+CD3+CD8+), DCs (CD45+CD11c+), myeloid-derived suppressor cell MDSCs (CD45+CD11cCD11b+Gr-1+), and Treg (CD45+CD3+CD4+FoxP3+); n = 5 mice. Significant differences are indicated as **P < 0.01, ***P < 0.001, or ****P < 0.0001 determined by two-tailed Student’s t-test.
Fig. 3
Fig. 3. Enhanced antitumor activities against primary tumors.
ac C57BL/6 mice were subcutaneously inoculated with 5 × 105 luciferase-expressing B16-F10 (B16-F10-Luc) cells. When tumor sizes reached ~100 mm3 (counted as day 0), the mice were intratumorally injected with 50 μL of VV-RFP, VV-GM, or VV-iPDL1/GM (5 × 107 pfu per tumor) or PBS at days 0, 3, and 7. Bioluminescence monitoring a, b and caliper measurement c of B16-F10-Luc cells were performed on the indicated days. Data are presented as the means ± SD (n = 5 mice). Significant differences are indicated as *P < 0.05 determined by two-tailed Student’s t-test. d, e Py230 d or MC38 e tumor volume was monitored by caliper measurement using the same treatment schedule as in ac. Data are presented as the means ± SD (n = 5 mice).
Fig. 4
Fig. 4. Enhanced antitumor activities against untreated, distant tumors.
ad Inhibition of rechallenged tumor growth. B16-F10 melanoma cells were implanted intradermally to the left flank of C57B/6 mice. When tumor sizes reached ~100 mm3 (counted as day 0), the mice were intratumorally injected with the indicated VVs on days 0, 3, and 7. Treated mice were s.c. rechallenged with B16-F10-Luc cells 30 days after the last VV injection (counted as day 0 for rechallenge data). Bioluminescence monitoring a, b and caliper measurement of B16-F10-Luc cells c were performed. Data are presented as means ± SD (n = 5 mice). d Survival curve of B16-F10 rechallenged mice. eh The volumes of rechallenged Py230 e or MC38 g tumors were monitored using a similar treatment schedule as in a, except that 5 × 105 of Py230 or MC38 tumor cells were rechallenged. Data are presented as means ± SD (n = 5 mice). *P < 0.05, ***P < 0.001 determined by two-way ANOVA. Survival curve of Py230 f and MC38 h rechallenge mice. *P < 0.05, *** P < 0.001 by two-tailed Log rank test. i CD8 T cell depletion. Surviving mice treated with VV-iPDL1/GM for the original left flank tumor implantation were rechallenged with 5 × 105 MC38 cells at right side without or with weekly i.v. injections of anti-CD8 antibody for two times. Data are presented as means ± SD (n = 5 mice). ****P < 0.01 by two-tailed repeated-measures two-way ANOVA. jl Inhibition of untreated, established tumor growth. B16-F10 melanoma cells were implanted to the left and right flanks of C57B/6 mice. The mice were intratumorally injected to the left flank tumors with indicated VVs without or with i.v. injections of anti-PD-L1 antibody on days 0, 3, and 7. j Individual curves are depicted for each tumor. Numbers indicate complete tumor regression out of total tumors in each group. k Distribution of tumor volumes determined on day 30 after virus injection; n = 10 mice. Bars represent mean values ± SD. *P < 0.05 by two-tailed Mann–Whitney U test. l Cumulative survival curves. Data are from two independent experiments. *P < 0.05; **P < 0.01; NS, not significant by two-tailed Log rank test.
Fig. 5
Fig. 5. Enhanced tumor infiltration and activation of immune cells.
A similar treatment schedule as in Fig. 2c was used, except that 5 days after the second VV injection, VV-treated MC38 tumors were harvested, weighed, and digested for preparation of single-cell suspensions followed by antibody staining against CD45, CD8, CD4, CD11c, CD11b, Gr-1, and FoxP3. ac Representative plots of the percentages of infiltrating CD45+ immune cells, DCs, MDSCs, CD4+ T cells, CD8+ T cells, and Tregs in treated tumors a. Absolute numbers of the above immune cells and CD8+ T cell/Treg ratio values in treated tumors b and distant, untreated tumors c. n = 5 mice. Data presented as the means ± SD. *P < 0.05, **P < 0.01 by two-tailed Student’s t-test. d, e Expression of IFN-γ, TNF-α, and CD 107a of tumor-infiltrating CD8+ T cells in response to restimulation with MC38 tumor lysate-pulsed DCs in the presence of Golgi-plug for 8 h were measured by intracellular staining d. e Quantitative presentation of d. n = 5 mice. Data presented as the means ± SD. *P < 0.05 by two-tailed Student’s t-test.
Fig. 6
Fig. 6. Enhanced T cell responses against dominant and subdominant tumor neoantigen epitopes.
a Enhanced T cell responses against a pool of neoantigen peptides. MC38 tumor-bearing mice were intratumorally injected with various VVs at days 0, 3, and 7. One group of C57BL/6 mice were i.v. injected with 200 μg of anti-PD-L1 antibody. Ten days later, splenocytes were cultured in the presence of a mixture of 11 neoepitope peptides (10 μg/mL/each). After 80 h of incubation, supernatants were collected for IFN-γ ELISA (right). [3H] thymidine incorporation was measured (left). The graph shows the results from three mice of each group. Data presented as the means ± SD. *P < 0.05 by two-tailed Student’s t-test. b Enhanced T cell responses against individual neoantigens. The splenocytes from VV-treated mice were cocultured with each of the 11 neoepitope peptides (100 μg/ml) as above described above. [3H] thymidine incorporation (left) and ELISA IFN-γ concentrations (right) are shown; n = 3 mice. One bar or one dot represents one mouse. Data presented as the means ± SD. *P < 0.05 by two-tailed Student’s t-test. c Enhanced T cell responses against the neoantigenic peptide 11. The splenocytes isolated from VV-treated mice were cocultured with various concentrations of the neoepitope peptide 11 as above described above. [3H] thymidine incorporation was used to analyze T cell proliferation; n = 3 mice. Data presented as the means ± SD. *P < 0.05, **P < 0.01, ***P < 0.001 by two-tailed Student’s t-test. d, e Enhanced tumor infiltration of neopeptide 4-specific T cells. Tumor cell suspensions from various VV-treated mice using the same treatment schedule as Fig. 5a were stained with the neopeptide 4 (Pep4, ASMTNMEL)-loaded, H-2Db-labeled pentamers, anti-CD45, and anti-CD8. Data are representative of five independent experiments. d Dot plots of flow cytometry; e quantification of peptide 4-pentamer+ CD8+ T cells. Data presented as the means ± SD. *P < 0.05 by two-tailed Student’s t-test. f Enhanced generation of neopeptide-specific memory T cells. Forty days after the virus injection, splenocytes were restimulated with neopeptide 4-loaded DCs in the presence of Golgi-plug followed by surface staining with anti-CD8 and intracellular staining with anti-107a, anti-IFN-γ, anti-IL-2, and anti-TNF-α.
Fig. 7
Fig. 7. Enhanced neoantigen presentation and cytolytic activity of neoantigen-specific CTLs.
a Enhanced stimulatory potency of tumor-infiltrating DCs. Tumor-infiltrating DCs from VV-treated mice were loaded with neopeptide 4, 9, or 11, and cocultured with the neoantigens-primed T cells from mice immunized with the 11 neopeptide mixture to assess IFN-γ production; n = 3 mice. Data presented as the means ± SD. *P < 0.05, ***P < 0.001 by two-tailed Student’s t-test. b Enhanced maturation of tumor-infiltrating DCs. Using a similar treatment schedule as described in Fig. 5a, cell suspensions prepared from VV-treated tumors were analyzed by flow cytometry. c Enhanced tumor infiltration of CD103+ DCs. Using the same treatment schedule as in Fig. 5a, tumor cell suspensions from VV-treated mice were analyzed by FACS; n = 5 mice. Data presented as the means ± SD. **P < 0.01 by two-tailed Student’s t-test. d Intracellular staining of IL-12 and CXCL9 of CD103+ DCs from VV-treated tumors. e qRT-PCR analysis of CXCL10 mRNA levels in CD103+ DCs isolated from VV-treated tumors; n = 5 mice. Data presented as the means ± SD. **P < 0.01 by two-tailed Student’s t-test. f Neoantigens-primed T cells proliferated more efficiently in VV-iPDL1/GM-treated mice. The neoantigens-primed T cells were labeled with 5 μM CFSE and i.v. injected into VV-treated mice. Three days later, T cell proliferation was assessed by FACS. g Enhanced stimulatory effect of VV-iPDL1/GM-infected tumor cells. MC38 tumor cells infected with VVs at MOI = 1 were cocultured with the neoantigens-primed T cells. IFN-γ production (left) and T cell proliferation (right) were measured. Data presented as the means ± SD. *P < 0.05 by two-tailed Student’s t-test. h Serum of VV-iPDL1/GM-treated mice enhanced the cytolytic activity of neoantigens-primed T cells. MC38-Luc cells were cocultured with the neoantigen-specific T cells in the presence of the sera from treated MC38-bearing mice. Cytolytic activity was calculated using luciferase emission value. Data are presented as means ± SD. **P < 0.01 by two-tailed Student’s t-test. i PD-1+ CD8+ T cells isolated from VV-treated MC38 tumors were cocultured with MC38 cells in the presence of purified iPDL1 or IgG. IFN-γ+ frequencies of PD-1+ T cells were shown from one of two independent experiments.

References

    1. Lennerz V, et al. The response of autologous T cells to a human melanoma is dominated by mutated neoantigens. Proc. Natl Acad. Sci. USA. 2005;102:16013–16018. - PMC - PubMed
    1. Schumacher TN, Schreiber RD. Neoantigens in cancer immunotherapy. Science. 2015;348:69–74. doi: 10.1126/science.aaa4971. - DOI - PubMed
    1. Rizvi NA, et al. Cancer immunology. Mutational landscape determines sensitivity to PD-1 blockade in non-small cell lung cancer. Science. 2015;348:124–128. doi: 10.1126/science.aaa1348. - DOI - PMC - PubMed
    1. Schumacher TN, Scheper W, Kvistborg P. Cancer neoantigens. Annu. Rev. Immunol. 2018;37:173–200. doi: 10.1146/annurev-immunol-042617-053402. - DOI - PubMed
    1. Linnemann C, et al. High-throughput epitope discovery reveals frequent recognition of neo-antigens by CD4+ T cells in human melanoma. Nat. Med. 2015;21:81–85. doi: 10.1038/nm.3773. - DOI - PubMed

Publication types

MeSH terms