. 2020 Mar 13;11(1):1382.
doi: 10.1038/s41467-020-15121-2.

Encoding of contextual fear memory in hippocampal-amygdala circuit

Affiliations

Encoding of contextual fear memory in hippocampal-amygdala circuit

Woong Bin Kim et al. Nat Commun. .

Abstract

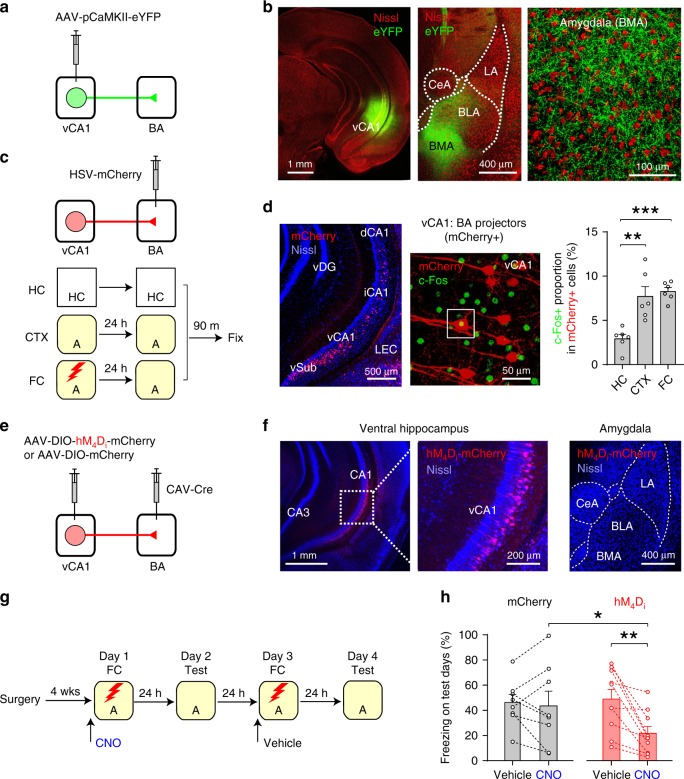
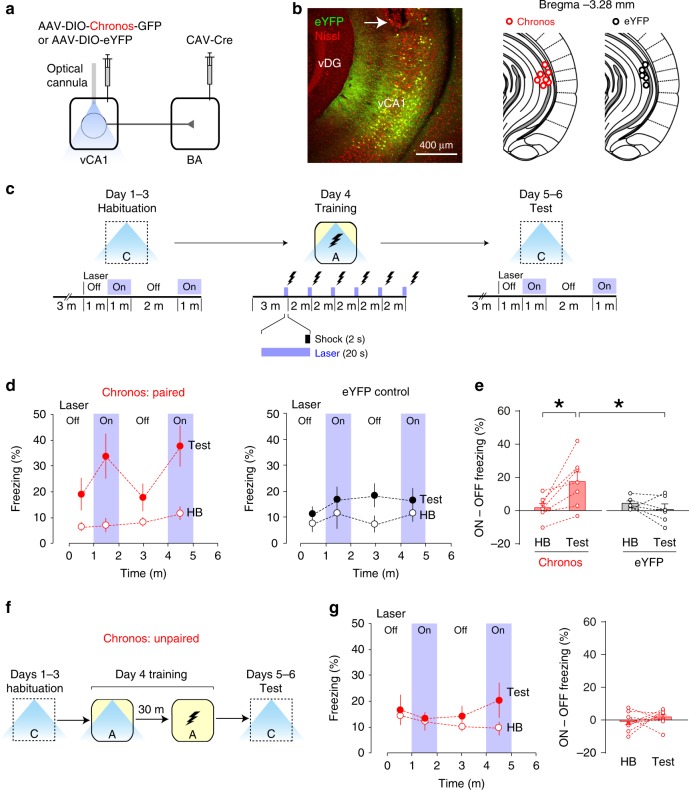
In contextual fear conditioning, experimental subjects learn to associate a neutral context with an aversive stimulus and display fear responses to a context that predicts danger. Although the hippocampal-amygdala pathway has been implicated in the retrieval of contextual fear memory, the mechanism by which fear memory is encoded in this circuit has not been investigated. Here, we show that activity in the ventral CA1 (vCA1) hippocampal projections to the basal amygdala (BA), paired with aversive stimuli, contributes to encoding conditioned fear memory. Contextual fear conditioning induced selective strengthening of a subset of vCA1-BA synapses, which was prevented under anisomycin-induced retrograde amnesia. Moreover, a subpopulation of BA neurons receives stronger monosynaptic inputs from context-responding vCA1 neurons, whose activity was required for contextual fear learning and synaptic potentiation in the vCA1-BA pathway. Our study suggests that synaptic strengthening of vCA1 inputs conveying contextual information to a subset of BA neurons contributes to encoding adaptive fear memory for the threat-predictive context.


Conflict of interest statement

The authors declare no competing interests.

Figures

Fig. 1
Fig. 1. Activity in the vCA1–BA pathway contributes to the acquisition of contextual fear memory.
a Experimental setup for b. b Images showing eYFP expression in the vCA1 (left, green) and eYFP-labeled vCA1 axons in the amygdala (middle and right). Red, Nissl stain. LA, BLA, BMA, and CeA: lateral, basolateral, basomedial, and central nuclei of the amygdala, respectively. c Experimental setup for d. Top: vCA1 neurons projecting to the BA (vCA1: BA projectors) were retrogradely labeled with HSV-mCherry. Bottom: mice in FC group were fear conditioned in Context A as in Supplementary Fig. 1a. Mice in CTX group were exposed to Context A without a US. After 24 h, they were tested for freezing behavior in Context A. Brain tissues were then fixed 90 min later for c-Fos immunohistochemistry. Mice in HC group were left in their home cages until brain fixation. d Left: image showing vCA1: BA projectors (red) in the dorsal (dCA1), intermediate (iCA1), ventral CA1 hippocampus (vCA1), and ventral subiculum (vSub). vDG, ventral dentate gyrus. LEC, lateral entorhinal cortex. Middle: image showing c-Fos+ cells (green) and vCA1: BA projectors (mCherry+, red). A square indicates a c-Fos+ vCA1: BA projector. Right: quantification of c-Fos+ proportion among vCA1: BA projectors (6 mice per group). **p = 0.001, ***p < 0.001 (one-way ANOVA with post hoc comparisons). e Experimental setup for fh. vCA1: BA projectors expressed hM4Di-mCherry or mCherry. We bilaterally injected retrograde CAV2-Cre into the BA and AAV-DIO-hM4Di-mCherry (hM4Di group) or AAV-DIO-mCherry (mCherry group) into the vCA1. f Images showing hM4Di-mCherry expression in vCA1: BA projectors (left and middle). Note no hM4Di-mCherry expression in the amygdala (right). g Behavioral training and testing protocols for h. h Quantification of freezing behavior on test days in the hM4Di (left, 10 mice) and mCherry groups (right, 8 mice) on test days. *p < 0.05, **p < 0.01 (two-way ANOVA with post hoc comparisons; group × treatment interaction, p < 0.05). Error bars indicate standard error of the mean (SEM). Source data are provided as a Source Data file. See also Supplementary Figs. 1 and 2.
Fig. 2
Fig. 2. The activation of vCA1 neurons projecting to the BA, paired with aversive stimuli, generated a new conditioned fear memory.
a An optical cannula was implanted to photostimulate vCA1 neurons projecting to the BA (vCA1: BA projectors) expressing Chronos-GFP (Chronos group) or eYFP (eYFP group). Retrograde CAV2-Cre was injected into the BA, and AAV-DIO-Chronos-GFP or AAV-DIO-eYFP was injected into the vCA1. b Left: image showing eYFP expression (green) in vCA1 neurons and optical cannula tip (arrow). Right: diagrams showing optical cannula implantation sites in d and e. c Experimental setup for d, e. Mice were habituated to 20 Hz photostimulation in Context C on days 1–3. After a 3-min acclimatization period and baseline recording of freezing behavior for 1 min, 20 Hz photostimulation was applied to the vCA1 through an optical cannulae (blue). On day 4, the mice received 20 Hz photostimulation (blue bars) 6 times, each co-terminating with a footshock, in Context A. On days 5–6, the mice were tested for freezing behavior in Context C in the presence and absence of 20 Hz photostimulation. d The time course of freezing behavior in Context C during habituation (HB) and test sessions in the Chronos (7 mice) and eYFP groups (6 mice). Freezing time on Days 1–3 (HB) and Days 5–6 (test) were averaged in each mouse for each time bin. e Summary plot showing the difference in the average freezing time in the presence and absence of photostimulation (ON – OFF freezing) during habituation and test sessions. *p < 0.05 (two-way ANOVA with post hoc comparisons, group × behavioral session interaction, p < 0.01). f Experimental setup for g. Mice in the Chronos: unpaired group underwent surgery with AAV-DIO-Chronos-GFP injected into the vCA1 as in a. On the training day, the mice received 20 Hz photostimulation 6 times in Context A and then received 6 shocks in Context A 30 min later. The mice were tested for photostimulation-induced freezing behavior in Context C. g Left: the time course of freezing behavior during habituation and test sessions in the Chronos: unpaired group (9 mice). Right: summary plot of the difference in the average freezing time in the presence and absence of photostimulation (ON – OFF freezing). p = 0.39, habituation vs. test sessions (two-sided paired t-test). Error bars represent the SEM. Source data are provided as a Source Data file. See also Supplementary Fig. 3.
Fig. 3
Fig. 3. Activity-dependent functional labeling identified vCA1 neurons that are active in a new context and project to a subset of BA neurons.
a Experimental setup for b and c. vCA1 neurons projecting to the BA were labeled with mCherry, whereas vCA1 neurons active in a novel context were labeled with eYFP in Fos-CreERT2 mice. b Top: mice were exposed to a novel context (red vertical bars) after tamoxifen injection (Tam). Bottom: magnified images of the vCA1. A vCA1 neuron labeled with both eYFP and mCherry is circled. c The proportion of eYFP-labeled neurons among all mCherry+ vCA1 neurons. n = 5 mice. d Experimental setup for e and f. e Top: after tamoxifen injection, mice were exposed to Context A to label with tdTomato vCA1 neurons active in Context A. Mice were then exposed to Context A (A–A group) or Context B (A–B group) before brain fixation for c-Fos immunostaining (IHC). Middle and bottom: images showing vCA1 neurons labeled with tdTomato (red) or c-Fos (green). vCA1 neurons labeled with both tdTomato and c-Fos are circled. f Comparisons of tdTomato+ cell density (p = 0.69), c-Fos+ cell density (p = 0.53), Fos+ and tdTomato+ cell density (*p = 0.015), and c-Fos+ proportion among all tdTomato+ vCA1 neurons (**p = 0.007). n = 6 mice per group. Two-sided paired t-tests were used. g Experimental setup for hn. Horizontal lines indicate the axons of vCA1 neurons, and vertical lines indicate the dendrites of BA neurons. vCA1 neurons active in Context A expressed ChR2-eYFP (blue). Photostimulation activated ChR2-expressing axons and induced postsynaptic responses recorded in BA neurons (Rec). h Top: after surgery, mice received a tamoxifen injection and were exposed to Context A as in b to induce ChR2-eYFP expression in vCA1 neurons active in Context A. They received three context labeling sessions with a 1-week interval. Bottom: images showing ChR2-eYFP+ vCA1 neurons (green) and their axons in the amygdala. Red, Nissl stain. i The proportion of ChR2-eYFP+ cells among all DAPI+ vCA1 neurons. n = 8 mice. j Representative traces of EPSCs induced by photostimulation of ChR2+ vCA1 axons and recorded at –80 mV in voltage-clamp mode in a BA principal neuron (red). EPSCs were inhibited by NBQX and MK-801 (black). Inset: image of BA neurons loaded with biocytin during recording and labeled with streptavidin-Alexa Fluor 633. k Left: EPSCs recorded in four BA neurons in a brain slice and induced by photostimulation of the same intensity. Right: scatter plot of the peak amplitudes of EPSCs recorded in BA neurons in each brain slice (n = 15 slices). Open circles indicate EPSC amplitudes in individual BA neurons. The average amplitude of EPSCs recorded in BA neurons in the same brain slice (black curve) was used to sort data along the x-axis in increasing order. l Histogram showing the distribution of the peak amplitudes of EPSCs induced by photostimulation of the same intensity (20.0 mW/mm2). n = 190 BA neurons. m Tetrodotoxin (TTX, 1 μM) completely blocked EPSCs in the Context A vCA1–BA pathway (left and middle). Subsequent application of 4-aminopyridine (4-AP, 1 mM) in the presence of TTX rescued EPSCs (right), indicating the monosynaptic nature of EPSCs. n Scatter plot of the peak amplitudes of monosynaptic EPSCs induced by photostimulation of the same intensity and recorded in BA neurons in each brain slice as in m. Open circles indicate EPSC amplitudes in each BA neurons. The average amplitude of EPSCs recorded in BA neurons in the same brain slice (black curve) was used to sort data along the x-axis in increasing order. Error bars represent the SEM. Source data are provided as a Source Data file. See also Supplementary Figs. 4–7.
Fig. 4
Fig. 4. Discriminative contextual fear learning induced synaptic strengthening in the vCA1 inputs that convey threat-predictive contextual information to the BA.
a Experimental setup for recording synaptic responses in the Context A vCA1–BA pathway in bf. ChR2 was expressed in vCA1 neurons active in Context A. Photostimulation selectively activated Context A vCA1 inputs and induced postsynaptic responses in BA neurons (Rec). b Mice were exposed to Context A for labeling vCA1 neurons active in Contest A as in Fig. 3h. Mice in the fear conditioning (FC) group were trained for discriminative fear in Context A on Days 1–5 as in Supplementary Fig. 1b. Mice in the no shock (NS) control group were exposed to the contexts without a shock. c Freezing behavior in Contexts (Ctx) A and B on Day 5 in the FC (11 mice) and NS groups (10 mice). d Traces of EPSCs induced by blue light (1 ms pulses, blue bars), which activated ChR2-expressing Context A vCA1 inputs. EPSCs were recorded at −80 mV, 0 mV, and +40 mV in voltage-clamp mode in the same BA neurons. AMPAR EPSCs were quantified as the peak amplitude of EPSCs recorded at −80 mV (open circles). NMDAR EPSCs were quantified as the average amplitude of EPSC recorded at +40 mV from 47.5 ms to 52.5 ms after photostimulation onset (gray vertical lines and closed circles). SR-95531 (10 μM) was added to block inhibitory postsynaptic currents. e Comparison of the AMPA/NMDA ratio in Context A-specific vCA1–BA pathway between the FC and NS groups (p = 0.024). Two-sided Kruskal Wallis multiple comparisons were used to analyze combined data in e and k. Open circles indicate the AMPA/NMDA ratio in each neuron. Numbers within the bars are the number of neurons examined in each group. f Histogram showing the distribution of the AMPA/NMDA EPSC ratio in Context A inputs to each BA neuron in the FC (red bars, 52 cells) and NS groups (open bars, 37 cells). A dotted vertical line indicates the mean + 2 standard deviations of the AMPA/NMDA ratio in the NS group. g Experimental setup for recording synaptic responses in the Context B vCA1–BA pathway in hl. ChR2 was expressed in vCA1 neurons active in Context B. Photostimulation activated Context B vCA1 inputs and induced postsynaptic responses in BA neurons. h Mice were exposed to Context B for labeling vCA1 neurons. Mice in the FC group were trained for discriminative fear in Context A on Days 1–5 as in Supplementary Fig. 1b, whereas mice in NS group were exposed to the contexts without a shock. i Freezing behavior in Contexts A and B on Day 5 in the FC (6 mice) and NS groups (8 mice). In the FC group, only discriminators (D, freezing score in Context B on Day 5 <35%) were included in the analysis in jk. j Left: traces of EPSCs recorded in the Context B pathway. AMPAR and NMDAR EPSCs were induced and recorded as in d. k Comparison of the AMPA/NMDA ratio in Context B vCA1–BA pathway between the FC and NS groups (n.s., not significant; p = 0.68, two-sided Kruskal Wallis multiple comparisons). l Correlation between the average AMPA/NMDA ratio vs. freezing score in Context B on Day 5 (Pearson correlation coefficient r = 0.71, left) and discrimination index [DI = (Context A freezing − Context B freezing)/(Context A freezing + Context B freezing); Pearson correlation coefficient r = 0.69; right]. Both discriminators (D) and generalizers (G, freezing score in Context B on Day 5 >35%) in the FC group were included. For each mouse, the AMPA/NMDA ratios in 4–5 BA neurons were averaged. Error bars represent the SEM. Source data are provided as a Source Data file. See also Supplementary Figs. 8–11.
Fig. 5
Fig. 5. A subset of vCA1–BA synapses was selectively strengthened in discriminative contextual fear conditioning.
a Experimental setup for bj. b After surgery, mice received three context labeling sessions with a 1-week interval to induce ChR2 expression in vCA1 neurons active in Context A. After a week, the mice received tamoxifen injection and were fear-conditioned in Context A on Day 1 for tdTomato (tdT) expression in BA fear neurons. On Days 2–5, mice were trained for discriminative fear in Context A as in Supplementary Fig. 1b. c Comparison of freezing responses in Contexts (Ctx) A vs. Context B on Day 5 (p = 0.001, two-sided paired t-test; n = 5 mice). d Images showing ChR2-eYFP-expressing vCA1 neurons (green, circles; left) and tdT-labeled BA neurons (red; right). e Traces of EPSCs recorded in tdT− and tdT+ BA neurons. tdT+ neurons were identified with red fluorescence within the BA (inset; scale bar, 10 μm). EPSCs were induced with photostimulation of Context A vCA1 inputs and recorded as in Fig. 4d. f Left: comparison of the AMPA/NMDA (A/N) ratios between tdT− and tdT+ BA neurons. Two-way ANOVA with post hoc comparisons was used to analyze combined data in f and n. Right: scatter plot of the A/N ratios in 18 pairs of tdT− (x-axis) and tdT+ BA neurons (y-axis) that were adjacent to each other. g Comparison of the amplitude of AMPAR EPSC (EPSCAMPAR) induced by photostimulation of the same intensity (6.4 mW/mm2) and recorded in tdT− vs. tdT+ BA neurons (two-sided paired t-test). h Traces of AP firing induced by depolarizing current injection (500 ms long) in tdT− and tdT+ BA neurons. Baseline membrane potential was adjusted to approximate −85 mV. i Comparison of AP firing in tdT− (18 cells) and tdT+ BA neurons (17 cells) (p = 0.67, two-way ANOVA). j Comparison of resting membrane potential (RMP, p = 0.45) and input resistance (Rin; p = 0.96, two-sided unpaired t-test) in tdT− (18 cells) and tdT+ BA neurons (17 cells). k Experimental setup for ln. ChR2 was globally expressed in vCA1 neurons. BA fear neurons (tdT+) were labeled with tdT as in b. l Left: mice received three context labeling sessions and were then fear-conditioned in Context A on Day 1 for tdT expression in BA fear neurons as in b. On Days 2–5, the mice were trained for discriminative fear in Context A as in b. Right: quantification of freezing responses on Day 5. n = 5 mice. m Traces of EPSCs induced by global stimulation of vCA1 inputs and recorded in tdT− and tdT+ BA neurons as in e. n Left: comparison of the AMPA/NMDA ratios between tdT− and tdT+ BA neurons (p = 0.35, two-way ANOVA with post hoc comparisons). Right: scatter plot showing the AMPA/NMDA ratio in 10 pairs of tdT− and tdT+ BA neurons. Error bars represent the SEM. Source data are provided as a Source Data file. See also Supplementary Figs. 12–13.
Fig. 6
Fig. 6. Lack of synaptic potentiation of the vCA1–BA pathway under anisomycin-induced retrograde amnesia.
a Experimental setup for bg. b Mice were exposed to Context A to induce ChR2 expression in vCA1 neurons active in Context A. They were then fear conditioned in Context A for tdT expression in BA fear neurons and received anisomycin (ANI, 10 mice) or saline injections (SAL, 7 mice). c Comparison of freezing behavior in Context A 24 h after fear conditioning between groups (two-sided unpaired t-test). d Left: image showing ChR2-eYFP-expressing vCA1 neurons (green, circles). Right: image of a pair of BA neurons, one tdT+ (red) and one tdT−, loaded with biocytin during recording and labeled with streptavidin-Alexa Fluor 633 (green). e Left: traces of EPSCs recorded in tdT− and tdT+ BA neurons in the saline control group. EPSCs were induced with photostimulation of Context A vCA1 inputs and recorded as in Fig. 4d. Middle: comparison of the AMPA/NMDA (A/N) ratios between tdT− and tdT+ neurons. Two-way ANOVA with post hoc comparisons was used to analyze combined data in e and f. Right: scatter plot of the A/N ratios in 22 pairs of tdT− and adjacent tdT+ cells in the saline control group. f Left: traces of EPSCs recorded in tdT− and tdT+ BA neurons in the anisomycin group. Middle and Right: comparison of AMPA/NMDA ratios between tdT− and tdT+ neurons in the anisomycin group (p = 1.00, two-way ANOVA with post hoc comparisons). g The average difference in AMPA/NMDA ratio between tdT+ and tdT− neurons in each mouse positively correlated with freezing behavior during memory recall (Pearson correlation test). h Experimental setup for i and j. mCherry was expressed in BA and vCA1 neurons active during contextual fear conditioning (FC group) or those active in the home cages (HC group). Neurons active during fear memory recall were immunostained for c-Fos. i Images showing BA and vCA1 neurons labeled with mCherry (red) and c-Fos (green). Both mCherry+ and c-Fos+ neurons were marked with circles. j Comparison of c-Fos+ proportion among all mCherry-labeled BA and vCA1 neurons (two-sided unpaired t-test). n = 5–7 mice per group. Error bars represent the SEM. Source data are provided as a Source Data file. See also Supplementary Figs. 14–15.
Fig. 7
Fig. 7. Dual independent labeling revealed selective strengthening of synapses that connect context-specific vCA1 neurons to BA fear neurons in contextual fear conditioning.
a Experimental setup. b Left: mice were taken off Dox and exposed to Context A to induce ChR2 expression in Context A vCA1 neurons. Mice received two additional vCA1 labeling sessions with a 1-week interval (vCA1 label 3×). Mice were put back on Dox immediately after each context labeling session. After tamoxifen injection, the mice were fear-conditioned in Context A on Day 1 for mCherry expression in BA fear neurons (BA label). The mice were tested for freezing behavior on Day 2 (Recall). Recording experiments (E-phys) were performed on Day 4. Right: quantification of freezing responses in Context (Ctx) A on Day 2 (n = 5 mice). c Left: vCA1 neurons active in Context A express tTA under the control of c-Fos promoter, resulting in ChR2-eYFP expression in the absence of Dox. Right: images showing ChR2-eYFP-expressing vCA1 neurons (green, circles). Red, Nissl stain. d Left: BA neurons active during fear conditioning express CreERT2 under the control of c-Fos promoter, resulting in tamoxifen-dependent recombination of the DIO and subsequent mCherry expression. Right: images showing mCherry-expressing BA neurons (red, left) and eYFP-labeled vCA1 axons (green, right) in the BA. e Traces of EPSCs recorded in mCherry (mCh)− and mCh+ BA neurons. mCh+ neurons were identified with red fluorescence within the BA (inset; scale bar, 10 μm). EPSCs were induced with photostimulation of Context A vCA1 inputs and recorded as in Fig. 4d. f Left: comparison of the AMPA/NMDA (A/N) ratios between mCh− and mCh+ BA neurons (two-sided paired t-test). Right: scatter plot of the A/N ratios in 12 pairs of mCh− (x-axis) and mCh+ BA neurons (y-axis) that were adjacent to each other. Error bars represent the SEM. Source data are provided as a Source Data file. See also Supplementary Fig. 16.
Fig. 8
Fig. 8. BA fear neurons recruited during fear learning receive more monosynaptic vCA1 inputs conveying threat-predictive contextual information than other BA neurons do.
a Experimental setup for bg. BA neurons active during fear conditioning (FC group) or those active in the home cages (HC group) were labeled with TVA-G-GFP. b Comparison of freezing behavior in Context A between groups 24 h after BA labeling. Mice in the FC group were fear conditioned in Context A and received saline (FC/SAL, 12 mice) or anisomycin injections (FC/ANI, 10 mice), whereas mice in the HC/ANI group remained in the home cages and received anisomycin injections (9 mice). ***p < 0.001, one-way ANOVA with post hoc comparisons. Mice in the FC/SAL group were not used for RV-mediated tracing experiments in cg. c BA fear neurons in the FC group were labeled with TVA-G-GFP in a Cre-dependent manner under the control of the Arc promoter in the presence of 4-OHT in Arc-CreERT2 mice. EnvA-ΔG-RV-mCherry infected TVA-G-expressing BA neurons, replicated, and propagated trans-synaptically to presynaptic neurons. d Neural circuit diagram showing trans-synaptic labeling of vCA1 neurons projecting to BA fear neurons labeled with TVA-G in the FC group (neuron D). EnvA-ΔG-RV-mCherry infected TVA-G-labeled BA neurons, resulting in mCherry expression in vCA1 neurons (neurons 1 and 4) that projected monosynaptically to BA fear neurons. Context A-encoding vCA1 neurons were immunostained for c-Fos (neuron 1). e Images showing TVA-G-GFP-labeled BA neurons (green) and RV-infected BA neurons expressing mCherry (red). f Images showing labeled vCA1 neurons in the FC (top) and HC groups (bottom). vCA1 neurons labeled with both mCherry and c-Fos are circled. g Comparison of the density of mCherry+ vCA1 neurons (left, p = 0.19; n.s., not significant), c-Fos+ cells (middle, p = 0.21), and the c-Fos+ proportion among all mCherry+ vCA1 neurons (right; **p = 0.001) between the FC (10 mice) and HC groups (9 mice). Two-sided unpaired t-tests were used. Dotted horizontal lines indicate the probability that a randomly selected vCA1 neurons is c-Fos+. h Experimental setup for il. i Mice were exposed to Context A to label vCA1 neurons active in Context A with ChR2. Mice were then fear conditioned in Context A to label BA fear neurons with tdTomato (tdT) and received anisomycin injections to prevent learning-induced synaptic strengthening in the vCA1–BA pathway. j Freezing behavior in Context A 24 h after fear conditioning (6 mice). k Representative traces of monosynaptic EPSCs induced by photostimulation of Context A vCA1 inputs and recorded in tdT− and tdT+ BA neurons in the presence of TTX and 4-AP as in Fig. 3m. l Plot of the average amplitude of EPSCs recorded in tdT− (16 neurons) and tdT+ neurons (16 neurons) as in k. ***p < 0.001, repeated measures two-way ANOVA. m BA fear neurons (F, red) receive more vCA1 inputs conveying threat-predictive contextual representations (blue) than other BA neurons (gray) do. Error bars represent the SEM. Source data are provided as a Source Data file. See also Supplementary Figs. 17–19.
Fig. 9
Fig. 9. Context-specific vCA1 neuronal activity is involved in the acquisition of contextual fear memory.
a Left: experimental setup for b and c. vCA1 neurons active in Context A expressed hM4Di-mCherry (hM4Di group) or mCherry (mCherry group) in Arc-CreERT2 mice. Right: images showing mCherry-labeled vCA1 neurons (yellow). b Behavioral training and testing protocols for c. After labeling Context A vCA1 neurons, mice received a CNO or vehicle injection 30 min before fear conditioning in Context A and were tested for fear memory in Context A 24 h later. c Comparison of freezing behavior in Context A on the test days in the hM4Di (12 mice; **p = 0.004, CNO vs. vehicle; *p = 0.016) and mCherry control groups (8 mice; p = 1.00, CNO vs. vehicle) (two-way ANOVA with post hoc comparisons; group × treatment interaction, p = 0.023). d Left: experimental setup for e and f. vCA1 neurons active in Context B were labeled with hM4Di-mCherry. Right: images showing mCherry-labeled vCA1 neurons (yellow). e After labeling Context B vCA1 neurons, mice received a CNO or vehicle injection 30 min before fear conditioning in Context A and were tested for fear memory in Context A 24 h later. f Comparison of freezing behavior in Context A on the test days (7 mice; p = 0.18, CNO vs. vehicle; two-sided paired t-test). Error bars represent the SEM. Source data are provided as a Source Data file. See also Supplementary Figs. 20–21.
Fig. 10
Fig. 10. Silencing context-specific vCA1 neurons during fear conditioning inhibited both contextual fear learning and synaptic potentiation of the vCA1–BA pathway.
a Experimental setup for bg. AAV-DIO-ChR2-eYFP was injected into the vCA1, and AAV-TRE-mCherry was injected into the BA in Arc-CreERT2 × Fos-tTA mice. b Mice were fed with doxycycline (Dox)-containing food (gray horizontal bar). Mice were exposed to Context A and received a 4-OHT injection for ChR2 expression in vCA1 neurons active in Context A. Mice were then taken off Dox for 48 h and fear conditioned in Context A for mCherry expression in BA fear neurons. Mice were put back on Dox immediately after fear conditioning and tested for freezing behavior in Context A on Day 2. Recording experiments (E-phys) were performed on Day 4. c Quantification of freezing responses in Context A on Day 2. n = 6 mice. d Left: vCA1 neurons active in Context A express CreERT2 under the control of the Arc promoter, which then induced the recombination of the DIO in the presence of 4-OHT, resulting in permanent ChR2-eYFP expression. Right: images showing ChR2-eYFP-expressing vCA1 neurons (green). Red, Nissl stain. ACx, auditory cortex. e Left: BA neurons active during fear conditioning express tTA under the control of the c-Fos promoter, resulting in mCherry expression in the absence of Dox. Right: images showing mCherry+ BA neurons (red) and ChR2-eYFP-labeled vCA1 axons in the BA (green). f Traces of EPSCs recorded in mCherry (mCh)− and mCh+ BA neurons (inset; scale bar, 10 μm). EPSCs were induced by photostimulation of Context A vCA1 inputs and recorded in mCh− and mCh+ BA neurons. g Comparison of the AMPA/NMDA ratio between mCh− and mCh+ neurons (11 cells per group). ANOVA with post hoc comparisons was used to analyze combined data in g and n. h Experimental setup for in. Both AAV-DIO-hM4Di-mCherry and AAV-DIO-ChR2-eYFP were bilaterally injected into the vCA1, and AAV-TRE-mCherry was injected into the BA. i Mice were exposed to Context A and received a 4-OHT injection for the expression of both hM4Di and ChR2 in vCA1 neurons active in Context A. Mice were then taken off Dox and fear conditioned in Context A for mCherry expression in BA fear neurons. The mice received a CNO injection 30 min before fear conditioning to inhibit the activity of Context A vCA1 neurons. They were put back on Dox immediately after fear conditioning and tested for freezing behavior on Day 2. Recording experiments were performed on Day 4. j Quantification of freezing responses in Context A on Day 2. k Left: vCA1 neurons active in Context A expressed CreERT2 under the control of the Arc promoter, which then induced the recombination of the DIO in the presence of 4-OHT, resulting in expression of both hM4Di-mCherry and ChR2-eYFP. Right: images showing vCA1 neurons (circles) expressing both hM4Di-mCherry (red) and ChR2-eYFP (green). l Left: BA neurons active during fear conditioning express tTA under the control of the c-Fos promoter, resulting in mCherry expression in the absence of Dox. Right: images showing mCherry+ BA neurons (red) and ChR2-eYFP-labeled vCA1 axons in the BA (green). m Traces of EPSCs induced by photostimulation of Context A vCA1 inputs and recorded in mCh− and mCh+ BA neurons (inset; scale bar, 10 μm) as in f. n Comparison of the AMPA/NMDA ratio between mCh− (10 cells) and mCh+ BA neurons (12 cells) (p = 1.00, two-way ANOVA with post hoc comparisons). Error bars represent the SEM. Source data are provided as a Source Data file. See also Supplementary Fig. 22.

References

    1. Maren S, Phan KL, Liberzon I. The contextual brain: implications for fear conditioning, extinction and psychopathology. Nat. Rev. Neurosci. 2013;14:417–428. doi: 10.1038/nrn3492. - DOI - PMC - PubMed
    1. Tovote P, Fadok JP, Luthi A. Neuronal circuits for fear and anxiety. Nat. Rev. Neurosci. 2015;16:317–331. doi: 10.1038/nrn3945. - DOI - PubMed
    1. Kim WB, Cho JH. Synaptic targeting of double-projecting ventral CA1 hippocampal neurons to the medial prefrontal cortex and basal amygdala. J. Neurosci. 2017;37:4868–4882. doi: 10.1523/JNEUROSCI.3579-16.2017. - DOI - PMC - PubMed
    1. Xu C, et al. Distinct hippocampal pathways mediate dissociable roles of context in memory retrieval. Cell. 2016;167:961–972 e916. doi: 10.1016/j.cell.2016.09.051. - DOI - PMC - PubMed
    1. Tovote P, et al. Midbrain circuits for defensive behaviour. Nature. 2016;534:206–212. doi: 10.1038/nature17996. - DOI - PubMed

Publication types

MeSH terms