. 2020 Mar 13;3(1):124.
doi: 10.1038/s42003-020-0849-9.

Deep splicing plasticity of the human adenovirus type 5 transcriptome drives virus evolution

Affiliations

Deep splicing plasticity of the human adenovirus type 5 transcriptome drives virus evolution

I'ah Donovan-Banfield et al. Commun Biol. .

Abstract

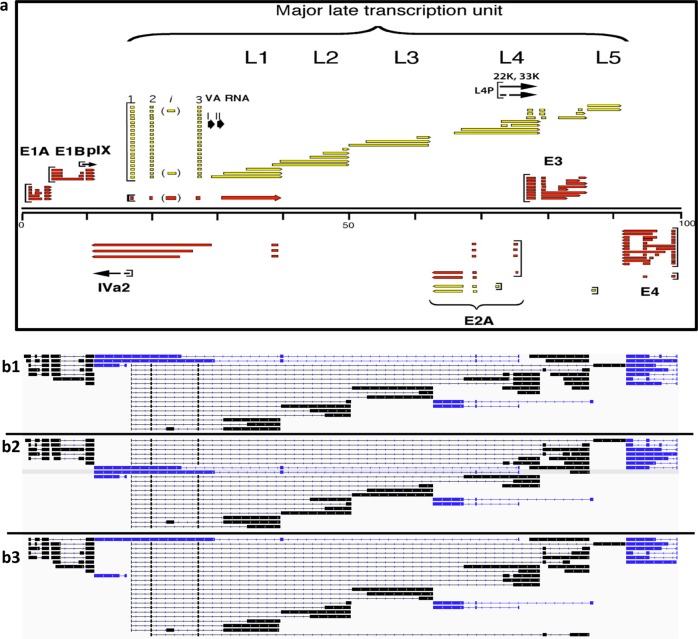
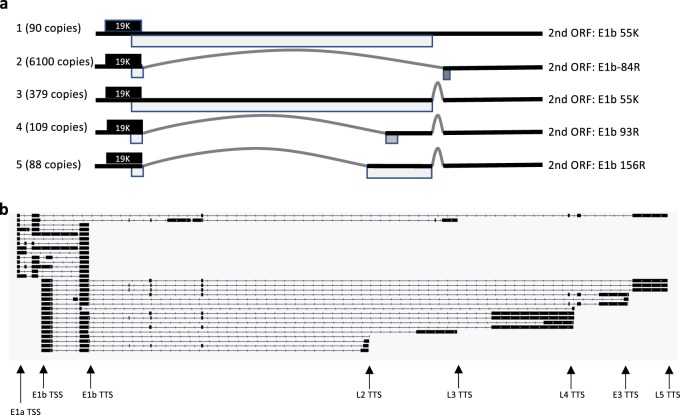
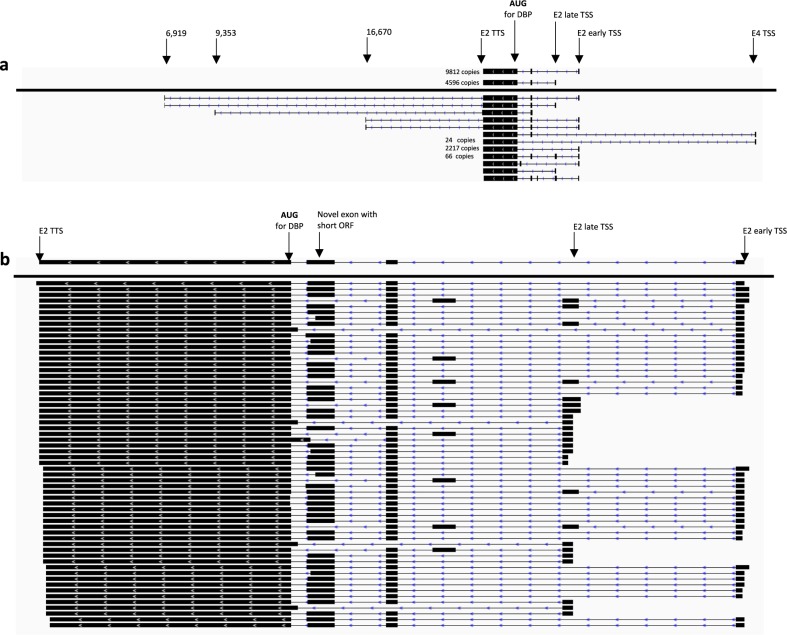
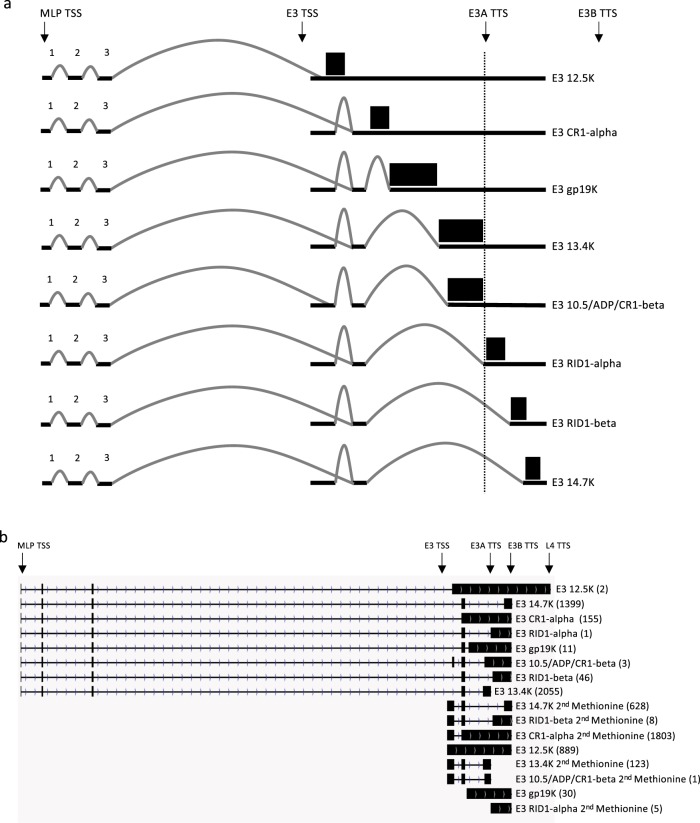
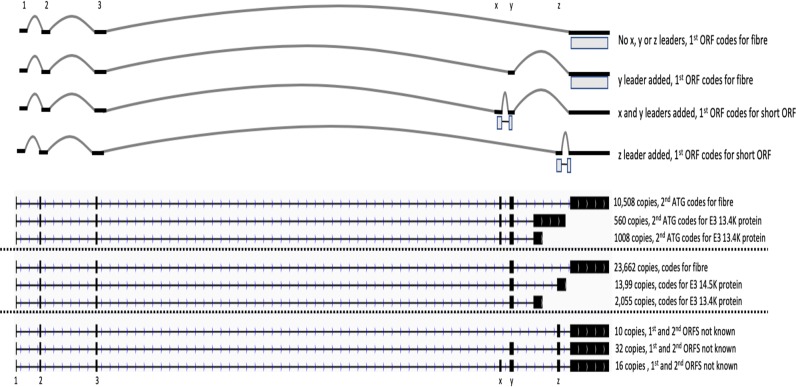
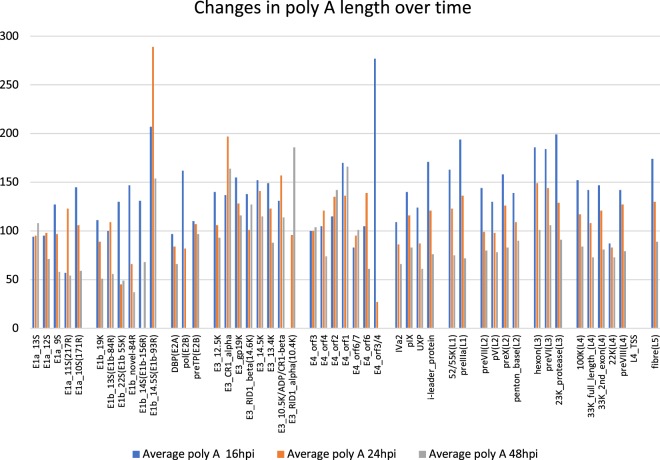
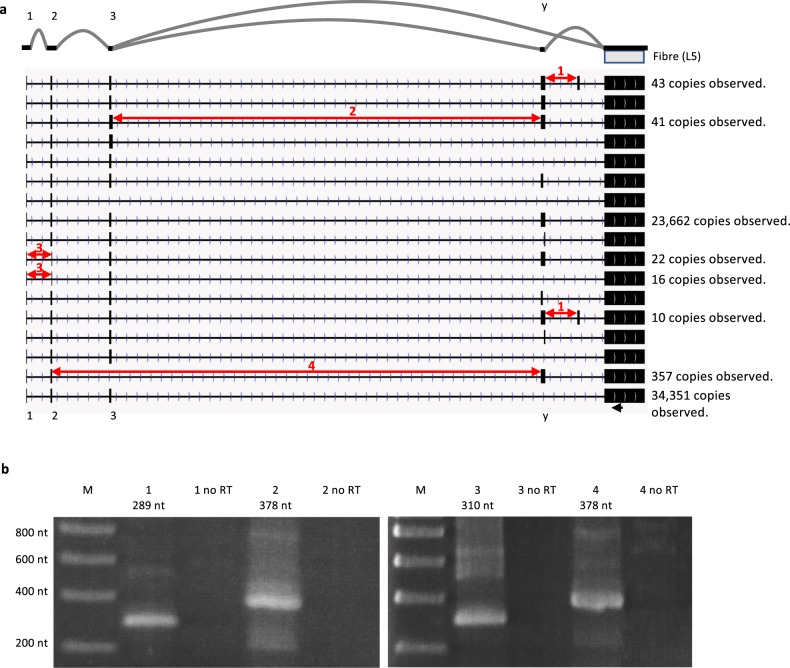
Viral genomes have high gene densities and complex transcription strategies rendering transcriptome analysis through short-read RNA-seq approaches problematic. Adenovirus transcription and splicing is especially complex. We used long-read direct RNA sequencing to study adenovirus transcription and splicing during infection. This revealed a previously unappreciated complexity of alternative splicing and potential for secondary initiating codon usage. Moreover, we find that most viral transcripts tend to shorten polyadenylation lengths as infection progresses. Development of an open reading frame centric bioinformatics analysis pipeline provided a deeper quantitative and qualitative understanding of adenovirus's genetic potential. Across the viral genome adenovirus makes multiple distinctly spliced transcripts that code for the same protein. Over 11,000 different splicing patterns were recorded across the viral genome, most occurring at low levels. This low-level use of alternative splicing patterns potentially enables the virus to maximise its coding potential over evolutionary timescales.


Conflict of interest statement

The authors declare no competing interests.

Figures

Fig. 1
Fig. 1. Transcription map overviews.
a Classical transcription map of adenovirus type 5. Transcripts shown above the genome are coded for on the top strand from left to right, while those below the genome are coded for on the bottom strand, transcribed from right to left. Genes are colour coded in red for early genes and yellow for late genes, denoting if their expression is predominantly before or after the onset of adenovirus DNA replication. Square brackets indicate classical TSS. Genes pIX and IVa2 are shown in black as they are classed as intermediate in their expression timing. The major late transcripts are further broken down into L1–5 according to their shared polyadenylation sites. b Transcript maps representing 16, 24 and 48 h post infection (b1, b2 and b3, respectively) derived from nanopore sequencing data. Each map shows the dominant transcript coding for each of the known adenovirus proteins. The black rectangles represent exons from the top strand of the genome, and blue rectangles represent exons coded by the bottom strand.
Fig. 2
Fig. 2. Overview of change in expression of known adenovirus ORFs over time.
The percent of transcripts that contain the indicated ORF as the most 5′ ORF at each time point is indicated. Note that these will not add up to 100% as not all transcripts meet this criterion as discussed in the main text. In addition, over the three time points 11% (16 h.p.i.), 13% (24 h.p.i.) and 16% (48 h.p.i.) of transcripts do not code for any known adenovirus protein. To aid clarity, the percent values on the chart are capped at 15%; the value for DBP expression at 16 h post infection is 29%.
Fig. 3
Fig. 3. E1 region transcripts.
a The coding potential of classical E1b transcripts (TSS at 1705 and TTS at 4073). A solid line illustrates the transcript structure (curved sections indicate introns) with boxes showing the encoded ORFs when appropriately spliced. The black ORF is the E1b19K protein, which is the 5′ most ORF on all classical E1b transcripts. To the left of each transcript is noted how many copies were seen cumulatively across all three time points. To the right is indicated which known E1b protein is coded for by the second initiating AUG. b The structure of rare transcripts that initiate at the E1a or E1b TSS but continue beyond the usual E1a or E1b TTS (image generated by IGV viewer). Black boxes indicate exons joined by fine lines with arrows. Each transcript structure shown is unique and in each case is evidenced by one nanopore transcript. The locations of relevant TSS and TTS are shown for orientation, except the normal E1a TTS that is 100 nt upstream of the E1b TSS and is omitted for clarity.
Fig. 4
Fig. 4. E2 region coding for DBP.
a Each line represents a transcript type coding for DBP, with exons represented as black boxes and the number of transcripts of each type detected across all time points indicated, where more than one transcript was sequenced in that transcript group. All the transcripts have right to left polarity. The transcripts above the dividing line represent the classical DBP-coding transcripts starting at the E2-early or E2-late TSS, while below the line is a representative sample of non-classical DBP transcripts also detected. These exemplify exons missing, novel exons included and transcription extending beyond the normal TTS. b Novel E2A region transcripts encoding DBP only if the 5′ proximal AUG is skipped. The transcript above the dividing line is the dominant example of this; almost 300 individual transcripts belong to this transcript group. The examples shown below range in abundance from 1 to 240 transcripts observed in each transcript group.
Fig. 5
Fig. 5. E3 transcripts.
a Coding and splicing potential of the E3 region: solid lines represent transcripts, potential splice events are indicated with a curved grey line with black boxes, representing ORFs with the ORF name indicated on the right. This schematic shows the two main promoters that drive E3 expression (MLP and the E3 promoter) and the two main transcription termination sites (E3A and E3B). Note that the initiating AUG for the E3 12.5K protein is present in every E3 transcript originating from the E3 TSS, thus on these transcripts other ORFs can only be expressed if the 5′ most AUG is skipped. b shows two representative transcripts for each classical E3 ORF. One representative is the most abundant transcript group initiating at the MLTU TSS, and the second is the most abundant transcript group initiating at (or as near as detected) to the known E3 TSS. In each case, after the indicated ORF name, the number of observed sequence reads that fit this transcript group across all three time points is shown in brackets. Where an ORF has “2nd Methionine” added to the name it indicates that, for this transcript, the 5′ proximal ORF does not code for a known adenovirus protein.
Fig. 6
Fig. 6. E4 transcripts.
An IGV viewer image of transcripts that have an E4 TSS and a TTS within 50 nt of the classical E4 TSS/TTS. These are further characterised according to whether they code for a known E4 ORF as indicated in the diagram. In addition, we show transcripts that code for ORFs that are unknown (labelled as no known ORF). Finally, we show the structure of a small number of rare transcripts (<3 per transcript group) that have a known ORF but only as the second ORF on the transcript or the known ORF is truncated. Also indicated are the locations of the start codons for the known E4 ORFs.
Fig. 7
Fig. 7. Adenovirus major late transcripts.
a The splicing events that give rise to the canonical set of adenovirus MLTU transcripts, grouped by polyadenylation class (L1–L5). Exons are shown as solid black lines with splice events depicted by curved grey lines. Boxes indicate the relative locations of the major ORFs. Splicing, as indicated, places the initiating AUG of each ORF immediately downstream of the TPL (exons 1, 2 and 3). Also shown is the dominant transcript that codes for the i-leader protein, which is in the L1 class. b Splicing to generate 33K, 33K 2nd exon/preVIII and preVIII transcripts. The ORF for 33K is shown in black, the theoretical ORF 33K 2nd exon in grey and the preVIII ORF in yellow.
Fig. 8
Fig. 8. Effects of adding x-, y- and z-leaders to the fibre transcript.
a The effects on coding potential of selective combinations of x, y and z exons added to an MLP-derived transcript that would otherwise code for the fibre protein. The three TPL exons of a classical major late transcript are labelled 1, 2 and 3. Grey boxes indicate the relative locations of potential ORFs. b Transcript groups detected that correspond to x, y and/or z-leader inclusion into MLP-derived L5 fibre transcripts. The three most abundant transcript groups, separated by dotted lines, that contain either an x-leader exon (b1), a y-leader exon (b2) or a z-leader exon (b3) are shown (image generated by IGV viewer). Coding capacity and transcript numbers are shown at the right of each transcript group representation. Note that in the groups containing the z-leader exon there are multiple ATG (potential initiating) codons in the z-leader which, when spliced as shown, do not lead to a known adenovirus protein being coded.
Fig. 9
Fig. 9. Average polyA lengths change over time during adenovirus infection.
This chart shows the changes in mean polyA length over time for the dominant transcript group that codes for each indicated ORF.
Fig. 10
Fig. 10. Distinct transcripts coding for fibre protein.
a shows the 17 transcript groups having at least ten observed transcripts, in which the fibre ORF was the first ORF are represented as lines with exons as black boxes. The numbers of transcripts belonging to the three most abundant transcript groups and the transcripts selected for targeted RT-PCR validation is shown to the right; the remaining transcripts were observed between 10 and 72 times. The exon structure and splicing pattern of the two most abundant transcript groups is shown schematically at the top. The locations of the tripartite leader exons and the y-leader exon are also shown. Note that in many cases the transcripts have truncated y-leader exons and in some cases, there is a novel exon downstream of the y-leader exon (i.e., it is not the x-leader exon). In order to validate by targeted PCR, we designed four primers that span two uniquely connected exons. Which exon pairs are spanned by each primer are numbered and indicated in the diagram by connecting double-headed red arrows. We also designed a universal reverse primer for the fibre ORF some 180 nt upstream of the fibre start codon and indicated by a black arrow at the bottom of the figure in a. b shows the results of RT-PCR (with and without reverse transcription) using the universal reverse primer and the numbered forward primers indicated in a—the expected size of the PCR product is indicated for each primer pair. Also indicated are the marker lanes (M) and the size of the markers are shown on the left hand side.

References

    1. Berget SM, Moore C, Sharp PA. Spliced segments at the 5’ terminus of adenovirus 2 late mRNA. Proc. Natl Acad. Sci. USA. 1977;74:3171–3175. doi: 10.1073/pnas.74.8.3171. - DOI - PMC - PubMed
    1. Chow LT, Gelinas RE, Broker TR, Roberts RJ. Amazing sequence arrangement at 5’ ends of adenovirus-2 messenger-Rna. Cell. 1977;12:1–8. doi: 10.1016/0092-8674(77)90180-5. - DOI - PubMed
    1. Thomas GP, Mathews MB. DNA-replication and the early to late transition in adenovirus infection. Cell. 1980;22:523–533. doi: 10.1016/0092-8674(80)90362-1. - DOI - PubMed
    1. Chow LT, Broker TR. Spliced structures of adenovirus-2 fiber message and other late messenger-Rnas. Cell. 1978;15:497–510. doi: 10.1016/0092-8674(78)90019-3. - DOI - PubMed
    1. Ramke, M. et al. The 5’UTR in human adenoviruses: leader diversity in late gene expression. Sci. Rep.7, 618 (2017). - PMC - PubMed

Publication types