. 2020 Mar 13;10(1):4625.
doi: 10.1038/s41598-020-61490-5.

Tead transcription factors differentially regulate cortical development

Affiliations

Tead transcription factors differentially regulate cortical development

Tanzila Mukhtar et al. Sci Rep. .

Abstract

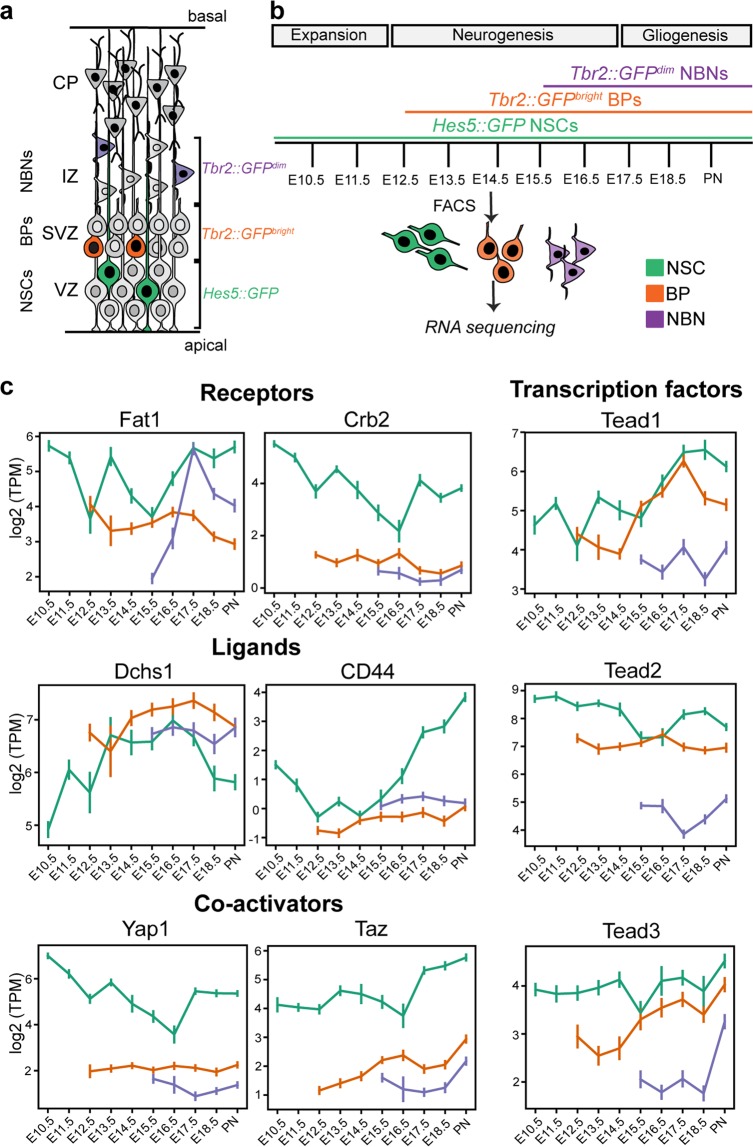
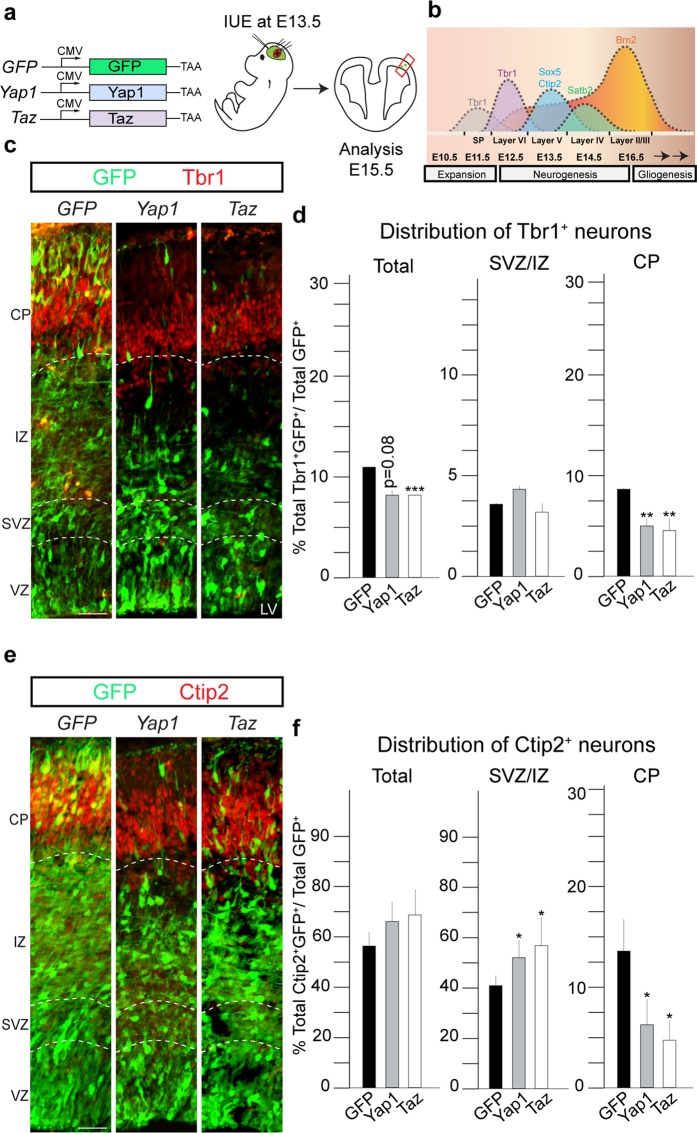
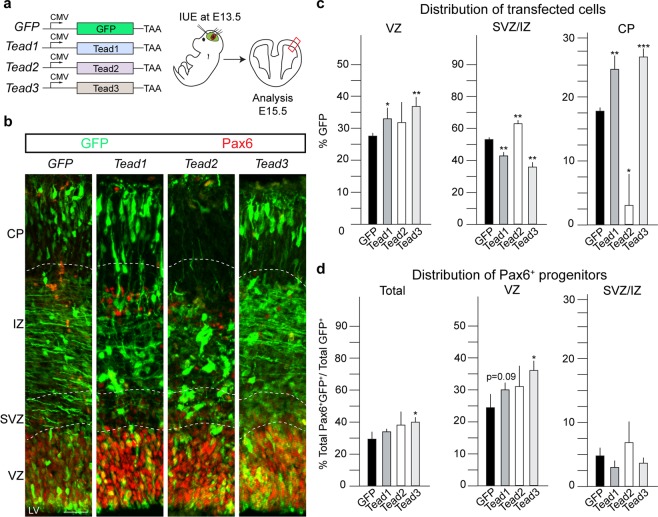
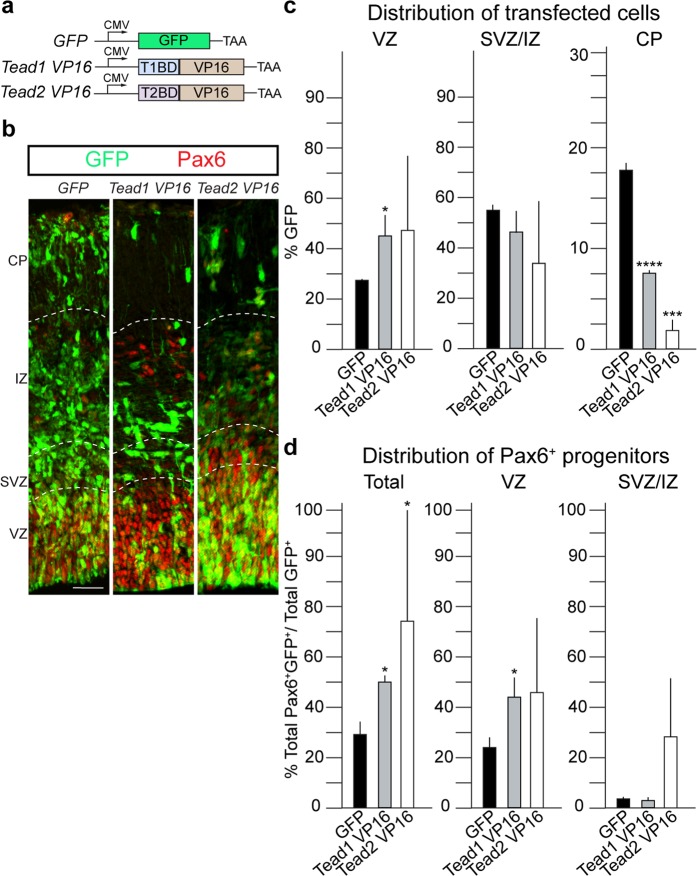
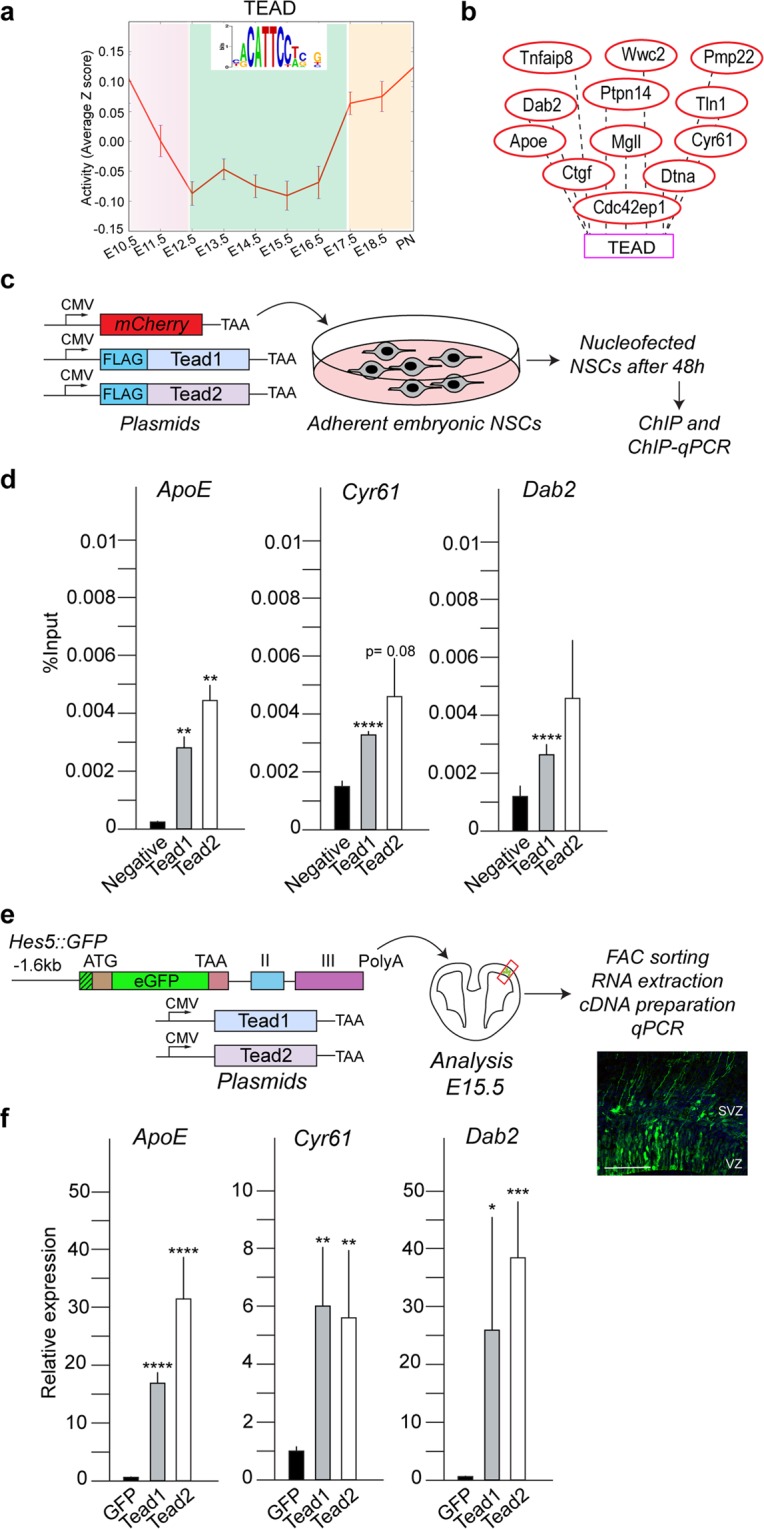
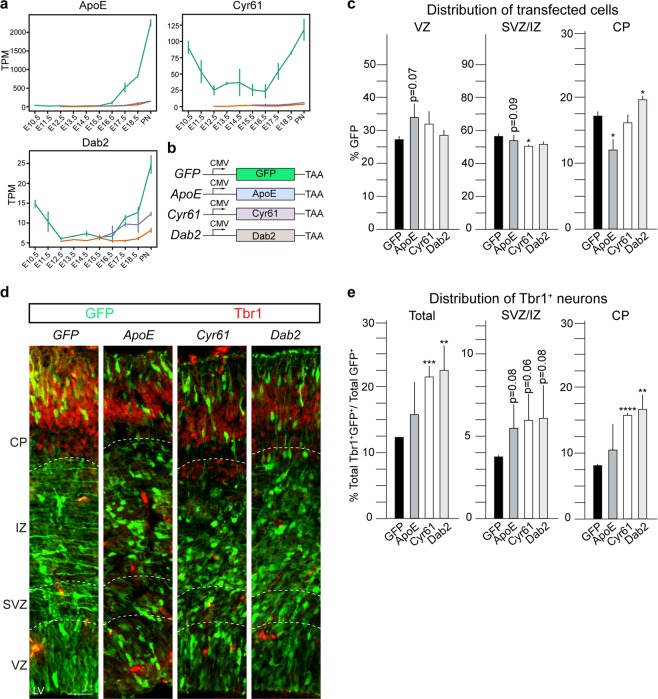
Neural stem cells (NSCs) generate neurons of the cerebral cortex with distinct morphologies and functions. How specific neuron production, differentiation and migration are orchestrated is unclear. Hippo signaling regulates gene expression through Tead transcription factors (TFs). We show that Hippo transcriptional coactivators Yap1/Taz and the Teads have distinct functions during cortical development. Yap1/Taz promote NSC maintenance and Satb2+ neuron production at the expense of Tbr1+ neuron generation. However, Teads have moderate effects on NSC maintenance and do not affect Satb2+ neuron differentiation. Conversely, whereas Tead2 blocks Tbr1+ neuron formation, Tead1 and Tead3 promote this early fate. In addition, we found that Hippo effectors regulate neuronal migration to the cortical plate (CP) in a reciprocal fashion, that ApoE, Dab2 and Cyr61 are Tead targets, and these contribute to neuronal fate determination and migration. Our results indicate that multifaceted Hippo signaling is pivotal in different aspects of cortical development.


Conflict of interest statement

The authors declare no competing interests.

Figures

Figure 1
Figure 1
Transcriptional dynamics of Hippo effectors in NSCs, BPs, NBNs from RNA sequencing data. (a) Schematic representation of mouse developing cortex. NSCs reside in the VZ, with long processes extending from apical to basal surface. NSCs are labelled by Hes5::GFP. BPs express high levels of Tbr2::GFP (Tbr2::GFPbright) and NBNs express low levels of Tbr2::GFP (Tbr2::GFPdim) expression. (b) Experimental paradigm used. 3–4 RNA samples extracted from FAC-sorted GFP+ NSCs, BPs and NBN populations each day during development, from biological replicates, following the time-course (E10.5 to PN), through phases of expansion, neurogenesis and gliogenesis. cDNA libraries were prepared and Next-Generation RNA-sequencing performed. (c) Expression profiles of Hippo signaling effectors; receptors Fat1 and Crb2, ligands Dchs1, CD44, co-activators Yap1, Taz, transcription factors Tead1, Tead2, Tead3 in NSCs, BPs and NBNs show dynamics during corticogenesis in these populations. Y-axis: mRNA level expressed as log2 TPM (transcripts per million). Also see Figs. S1 and S2. NSCs- Neural stem cells, BPs- Basal progenitors, NBNs- Newborn neurons, VZ - ventricular zone, SVZ - subventricular zone, IZ - intermediate zone, CP - cortical plate, E - Embryonic day, PN - postnatal day 1.
Figure 2
Figure 2
Overexpression of co-activators Yap1 and Taz affects cell fate, neuronal migration and cortical layering. (a) Experimental paradigm used to perform overexpression of Yap1 and Taz, and GFP as a control. IUEs were performed at E13.5 and brains isolated at and analyzed at E15.5, after 48 hours. (b) Illustration to show the sequential generation of distinct types of cortical layers, specified by different TFs. The cortical development is divided in expansion, neurogenesis and gliogenesis. (c) Coronal sections of transfected cortices immunostained for GFP and Tbr1, deep layer marker. (d) Quantification of Tbr1+GFP+ cells shows a reduction upon overexpression of Yap1 and Taz, compared to GFP control in CP and total. (e) Coronal sections of transfected cortices immunostained for GFP and Ctip2, deep layer marker. (f) Quantification of Ctip2+GFP+ cells shows a reduction compared to GFP control in CP and no change in total, upon overexpression of Yap1 and Taz. IUE- in utero electroporation. Total = VZ+SVZ/IZ+CP. Also see Fig. S3. Summaries of the quantifications are in Table S1. Scale bar = 50 μm. Data are shown as average ± SEM, *p = 0.05, **p = 0.01, ***p = 0.001.
Figure 3
Figure 3
Overexpression of Tead1, Tead2, Tead3 affect cell fate, neuronal migration and cortical layering. (a) Experimental paradigm used to perform overexpression of Tead1, Tead2 and Tead3 and empty GFP as a control. IUE were performed at E13.5 and brains isolated at E15.5, after 48 hours. (b) Coronal sections of transfected cortices immunostained for GFP and Pax6, NSC marker. (c) Quantification of distribution of GFP+ transfected cells shows Tead1 and Tead3 induce similar phenotypic changes in cell distribution while Tead2 overexpression shows an opposite phenotype. (d) Quantification of Pax6+GFP+ cells shows an increase in total Pax6+ cells upon overexpression of Tead3, compared to GFP control in VZ and total. Also see Fig. S4. Summaries of the quantifications are in Table S2. Scale bar = 50 μm. Data are shown as average ± SEM, *p = 0.05, **p = 0.01, ***p = 0.001.
Figure 4
Figure 4
Dominant negative forms of Tead1, Tead2 and Tead3 show reciprocal phenotypes to their corresponding overexpression. (a) Experimental paradigm used to perform loss of function of Tead1, Tead2 and Tead3 and empty GFP as a control. DN constructs were cloned without the DNA-binding domains. IUE were performed at E13.5 and brains isolated at E15.5, after 48 hours. (b) Coronal sections of transfected cortices immunostained for GFP and Pax6. (c) Quantification of distribution of GFP+ transfected cells shows Tead1 DN and Tead3 DN induce similar phenotypic changes in cell distribution while Tead2 DN shows an opposite phenotype. (d) Quantification of Pax6+GFP+ cells shows an increase in total Pax6+ upon Tead1 DN, Tead2 DN and Tead3 DN, compared to GFP control in VZ and total. DN - Dominant negative, tTead = Truncated Tead, Y/TBD = Yap1/Taz binding domain. Also see Fig. S5. Summaries of the quantifications are in Table S3. Scale bar = 50 μm. Data are shown as average ± SEM, *p = 0.05, **p = 0.01, ***p = 0.001.
Figure 5
Figure 5
Transactive forms of Tead1 and Tead2 show similar phenotypic changes. (a) IUE with the transactive forms (with VP16 domain) of Tead1 and Tead2 were performed at E13.5 and brains isolated at E15.5, after 48 hours. (b) Coronal sections of transfected cortices immunostained for GFP and Pax6. (c) Quantification of distribution of GFP+ transfected cells shows Tead1 VP16 and Tead2 VP16 induce similar phenotypic changes in cell distribution. (d) Quantification of Pax6+GFP+ cells shows an increase in total Pax6+ cells upon Tead1 VP16, Tead2 VP16 compared to GFP control in all zones. Summaries of the quantifications are in Table S4. Scale bar = 50 μm. Data are shown as average ± SEM, *p = 0.05, ***p = 0.001, ****p = 0.0001.
Figure 6
Figure 6
In silico predicted Tead targets by ISMARA and their experimental validation. (a) Activity of Tead binding motif in NSCs during expansion, neurogenesis and gliogenesis. (b) Examples of in silico predicted targets of Tead. (c) Chromatin Immunoprecipitation for flag tagged-Tead1 and Tead2, performed in adherent NSCs, 48 hours after nucleofection. (d) ChIP-qPCR reproducibly pulls-down ApoE, Cyr61 and Dab2 with both Tead1 and Tead2. An empty mCherry vector was used as the negative control. (e) IUE performed with co-transfection of pBluescript-Hes5::GFP plasmid, with Tead1 and Tead2 expression constructs, at E13.5. specifically expressed in NSCs in VZ and this approach allows to isolate only transfected NSCs after 48 hours. (f) Relative expression of ApoE, Cyr61 and Dab2 mRNAs show an induced expression upon overexpression of both Tead1 and Tead2. Also see Fig. S6. Summaries of the quantifications are in Table S5. Scale bar = 100 μm. Data are shown as average ± SEM, *p = 0.05, **p = 0.01, ***p = 0.001, ****p = 0.0001.
Figure 7
Figure 7
ApoE, Cyr61 and Dab2 overexpression recapitulate Tead overexpression phenotypic changes. (a) mRNA expression profiles of ApoE, Cyr61 and Dab2 in NSCs, BPs and NBNs. (b) Expression constructs used for overexpression. (c) Quantification of distribution of GFP+ transfected cells shows ApoE overexpression recapitulates Tead2 overexpression phenotype while Dab2 overexpression recapitulates the Tead1 overexpression phenotype. (d) Coronal sections of transfected cortices immunostained for GFP and Tbr1. (e) Quantification of Tbr1+GFP+ cells shows an increase upon overexpression of Cyr61 and Dab2, compared to GFP control in CP and all zones. Also see Figs. S7 and S8. Summaries of the quantifications are in Table S6. Scale bar = 50 μm. Data are shown as average ± SEM,*p = 0.05, **p = 0.01, ***p = 0.001, ****p = 0.0001.

References

    1. Lee HK, Lee HS, Moody SA. Neural transcription factors: from embryos to neural stem cells. Mol. Cell. 2014;37:705–712. doi: 10.14348/molcells.2014.0227. - DOI - PMC - PubMed
    1. Mukhtar T, Taylor V. Untangling Cortical Complexity During Development. J. Exp. Neurosci. 2018;12:1179069518759332. doi: 10.1177/1179069518759332. - DOI - PMC - PubMed
    1. Paridaen JT, Huttner WB. Neurogenesis during development of the vertebrate central nervous system. EMBO Rep. 2014;15:351–364. doi: 10.1002/embr.201438447. - DOI - PMC - PubMed
    1. Gotz M, Huttner WB. The cell biology of neurogenesis. Nat. Rev. Mol. Cell Biol. 2005;6:777–788. doi: 10.1038/nrm1739. - DOI - PubMed
    1. Taverna E, Gotz M, Huttner WB. The cell biology of neurogenesis: toward an understanding of the development and evolution of the neocortex. Annu. Rev. Cell Dev. Biol. 2014;30:465–502. doi: 10.1146/annurev-cellbio-101011-155801. - DOI - PubMed

Publication types

MeSH terms