. 2020 Mar 13;11(1):1396.
doi: 10.1038/s41467-020-15163-6.

The Aurora B specificity switch is required to protect from non-disjunction at the metaphase/anaphase transition

Affiliations

The Aurora B specificity switch is required to protect from non-disjunction at the metaphase/anaphase transition

Joanna R Kelly et al. Nat Commun. .

Erratum in

Abstract

The Aurora B abscission checkpoint delays cytokinesis until resolution of DNA trapped in the cleavage furrow. This process involves PKCε phosphorylation of Aurora B S227. Assessing if this PKCε-Aurora B module provides a more widely exploited genome-protective control for the cell cycle, we show Aurora B phosphorylation at S227 by PKCε also occurs during mitosis. Expression of Aurora B S227A phenocopies inhibition of PKCε in by-passing the delay and resolution at anaphase entry that is associated with non-disjunction and catenation of sister chromatids. Implementation of this anaphase delay is reflected in PKCε activation following cell cycle dependent cleavage by caspase 7; knock-down of caspase 7 phenocopies PKCε loss, in a manner rescued by ectopically expressing/generating a free PKCε catalytic domain. Molecular dynamics indicates that Aurora B S227 phosphorylation induces conformational changes and this manifests in a profound switch in specificity towards S29 TopoIIα phosphorylation, a response necessary for catenation resolution during mitosis.


Conflict of interest statement

The authors declare no competing interests.

Figures

Fig. 1
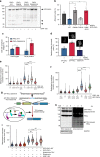
Fig. 1. Phosphorylation of Aurora B S227 is required to support the metaphase response to catenation.
a DLD1 cells expressing GFP-Aurora B wild type or S227A were scored for nuclear morphology. The mean ± SD of three independent experiments is graphed (n = ≥200) (one-way ANOVA, *P = ≤0.024; Control 6.76% ± 1.46, WT 11.76% ± 5.63, S227A 27.63% ± 10.07). Scale bar = 5 μm. b Anaphase cells were scored for DAPI-positive bridges or PICH-positive strands. The graph represents the mean ± SD of three independent experiments, >20 cells per condition were scored per experiment (two-tailed Students’ t test, *P = 0.027, DAPI: WT 10.35% ± 7.49, S227A 46.02% ± 25.62, PICH: WT 17.18% ± 14.8, S227A 35.98% ± 15.83). Scale bar = 5 μm. c Representative images of single sister chromatids or retained/catenated sister chromatids after 24 h Shugoshin knockdown (siSgo). Scale bar = 2 μm. d Cells were scored for the percent retained (catenated) sister chromatids. The mean ± SEM of three experiments where ≥15 cells per experiment were analysed is graphed (one-way ANOVA; **P = 0.0061; siControl 47.05% ± 5.75, siTopoIIα 78.84 ± 6.61, WT 46.23 ± 4.13, S227A 83.21 ± 5.561). Scale bar = 5 μm. e DLD1 cells expressing GFP-Aurora B wild type or S227A were treated ± 1 μM ICRF193 immediately prior to time-lapse imaging and scored for time from metaphase to anaphase. Violin plots represent all cells scored, median in red. A minimum of 100 cells per condition in three independent experiments were analysed. (one-way ANOVA; ****P = ≥0.0001). f Immunoblot of DLD1 cells (representative of three independent experiments) enriched in mitosis and treated with ICRF193 (1 µM) ± BLU577 (500 nM). TritonX-100 insoluble fractions were probed for Aurora B phospho-S227, total Aurora B, and TopoIIα. Mean ± SD of the immunoblots is graphed (two-tailed Students’ t test; **P = 0.001; +ICRF/+BLU 0.5835 ± 0.085). g Cells were treated with 500 nM nocodazole and imaged using live-cell time-lapse microscopy for 24 h and scored for their time arrested in mitosis. The mean ± SD of three experiments where >50 cells were analysed per condition, per experiment are graphed. Representative images of (h) BubR1 and (i) MAD2 kinetochore localisation after inducing a metaphase delay with ICRF193 (4 h, 1 µM) ± BLU577 (20 min 500 nM) or ±nocodazole (5 min, 500 nM), from three independent experiments, a minimum of ten images were acquired. DAPI (blue), GFP-Aurora B (green), BubR1/MAD2 (magenta), CREST (white). Scale bar = 5 μm.
Fig. 2
Fig. 2. A chromatin-associated pool of PKCε is cleaved by Caspase-7 in mitosis.
a Pre-extraction of cells with 0.1% Triton X-100 prior to fixation revealed a chromatin-associated pool of PKCε. Images are representative of three independent experiments. Scale bar = 5 μm. b Triton X-100 insoluble fraction of asynchronous or nocodazole (500 nM) arrested DLD1 cell lysates were probed for PKCε, GFP, and Histone H3. Western blot is representative of three independent experiments. c Schematic of PKCε domains and cleavage products with putative cleavages sites described by Basu et al. marked by red arrows. d Immunoblot of GFP-PKCε to assess cleavage after knockdown of Caspases 3 and 7. Graph denotes the mean ± SD of three independent experiments where the proportion of cleaved 43 kDa fragment of PKCε present in the immunoblots was determined by densitometry (two-tailed Students’ t test; **P = 0.01; siControl 20.85 ± 0.76, SiCas3 13.9 ± 6.38, siCas7 7.4 ± 4.95, siCas3 + siCas7 8.98 ± 4.37). DLD1 cells were depleted of Caspase-7 and induced to express (e) GFP-PKCε wild type or (f) GFP-PKCε kinase domain and assessed for their response to metaphase catenation. Cells were treated with ±1μM ICRF193 immediately prior to time-lapse imaging and scored for the time to progress from metaphase to anaphase. Violin plots represent all cells scored, the median is in red. A minimum of 100 cells per condition in three independent experiments were analysed. (One-way ANOVA, ****P = ≤0.0001). Caspase-7 knockdown was confirmed by immunoblot for each experiment.
Fig. 3
Fig. 3. Cleaved PKCε is required for the metaphase catenation response.
a Immunoblot of the TritonX-100-insoluble fraction of DLD1 cells expressing GFP-PKCε cleavage-site mutants, after arrest with nocodazole (500 nM) ± ICRF193 (1 μM) (representative of three independent experiments). b DLD1 cells expressing GFP-PKCε wild type or cleavage mutants were scored for nuclear morphology. The mean ± SD of three independent experiments is graphed (n = ≥200 cells per condition, per experiment, two-tailed Students’ t test; *P = 0.023, **P = 0.008; siPKCε 22.11% ± 3.68, WT 11.4% ± 1.21, D383N 29.4% ± 8.64, D451N 12.85% ± 5.94, D383/451 N 28.53% ± 3.43). c Anaphase DLD1 cells expressing GFP-PKCε wild type or D383/451N were scored for DAPI-positive bridges or PICH-positive strands. The mean ± SD of three independent experiments is graphed (n = ≥20 cells per condition, per experiment) (two-tailed Students’ t test, *P = 0.012, DAPI:WT 27.33% ± 2.52, D383/451N 35.06% ± 1.761, PICH: WT 19% ± 6.93, D383/451N 53.01% ± 11.88). d Cells scored for the percent retained (catenated) sister chromatids. The mean ± SEM of three independent experiments is graphed (n = ≥15 cells per experiment) (One-way ANOVA; **P = ≤0.0064; WT 44.24% ± 5.74, D383/451N 76.43% ± 2.36, D383/451N + rTopoIIa 34.4% ± 5.83) Scale bar = 5 μm. e DLD1 cells expressing GFP-PKCε wild type or cleavage mutants were treated ± 1 μM ICRF193 immediately prior to time-lapse imaging and scored for metaphase-to-anaphase transition time. Violin plots represent all cells scored. A minimum of 50 cells per condition in three independent experiments were analysed (One-way ANOVA, ****P = ≤0.0001; WT + ICRF193 46.26 ± 4.62 min, D383N + ICRF193 25.51 ± 1.32 min, D451N + ICRF193 48.9 ± 1.18 min, D383/451 N + ICRF193 23.05 ± 1.62 min). f DLD1 cells expressing GFP-PKCε wild type, cleavage mutants or kinase domain were treated ±1 μM ICRF193 immediately prior to time-lapse imaging and scored for metaphase-to-anaphase transition time. Violin plots represent all cells scored. A minimum of 50 cells per condition in three independent experiments were analysed. (one-way ANOVA; ****P = ≤0.0001; siPKCε + ICRF193 24.05 ± 1.15 min, WT + ICRF193 55.71 ± 2.3 min, D383/451N + ICRF193 24.92 ± 2.46 min, kinase domain 55.01 ± 2.6 min). g Schematic of split-TEV system. h Immunoblot (representative of three independent experiments) of DLD1 cells co-expressing GFP-PKCεD383/451N ± TEV recognition sequence and split-TEV (sTEVp) after ± rapamycin (100 nM) for 3 and 6 h to demonstrate TEV-dependent cleavage. i DLD1 cells expressing GFP-PKCε wild type or TEV-cleavage mutant were arrested with nocodazole (3 h, 500 nM) followed by ± rapamycin (2 h,100 nM). After nocodazole washout cells were treated ±1μM ICRF193 immediately prior to time-lapse imaging and scored for metaphase-to-anaphase transition time. Violin plots represent all cells scored. A minimum of 100 cells per condition in three independent experiments were analysed (one-way ANOVA; ****P = ≥0.0001; WT + ICRF193 47.15 ± 0.82 min, WT + ICRF193 + Rapamycin 47.86 ± 0.9 min, D383/451NTEV + ICRF193 25.25 ± 1.15 min, D383/451NTEV + ICRF93 + Rapamycin 44.95 ± 1.35 min).
Fig. 4
Fig. 4. Aurora B switches substrate specificity to phosphorylate TopoIIα.
a Immunofluorescent images of DLD1 cells stained for TopoIIα phospho-S29 (magenta), a-tubulin (green) and DNA (blue). Images are representative of three independent experiments. Scale bar = 5 μm. b Representative still images of DLD1 cells stained with TopoIIα pS29 (magenta), a-tubulin (green) and DNA (blue) after 30 min treatment with the PKCε inhibitor BLU577 (500 nM) or 15 min Aurora B inhibition with ZM447439 (2 μM). Quantification of integrated pixel intensity measurements of TopoIIα pS29. Graph shows mean ± SEM of three experiments where 20 cells were scored per condition (one-way ANOVA; **P = 0.0034 ****P = ≤0.0001; Control 1 ± 0, BLU577 0.5967 ± 0.08, ZM447439 0.18 ± 0.04) Scale bar = 5 μm. c Peptide array (n = 1) of full length TopoIIα with recombinant Aurora B wild type (top panel) or Aurora B S227A (lower panel). d Quantification of TopoIIα array spot intensity for S29 and T1460 peptides. Graph represents mean ± SD of the intensity of spots highlighted in red in c (n = 3 spots for S29, n = 4 spots for T1460). (two-tailed Students’ t test; ****P = 5.17 × 10−6(S29), P = 1.4 × 10−8 (T1460); S29: Aurora B WT 1.45 ± 0.34, S227A 0.12 ± 0.03, T1460: WT 0.2 ± 0.05, S227A 1.47 ± 0.13). Spot densitometry analysed by ImageJ software. e In vitro kinase assay of TopoIIα with Aurora B wild type or S227A kinase. TopoIIα was immunoblotted for phosphorylation at residues S29 and T1460. Immunoblot is representative of four independent experiments. f Representative images of DLD1 cells induced to express GFP-PKCε WT or D383/451N mutant stained for TopoIIα pS29 (magenta) and tubulin (green). Quantification of integrated pixel intensity measurements of TopoIIα pS29. Graph shows mean ± SEM of three experiments where ≥20 cells were scored per condition (two-tailed Students’ t test; **P = 0.009) Scale bar = 5 µm. g Representative images of DLD1 cells induced to express GFP-Aurora B WT or S227A mutant stained for TopoIIα pS29 (magenta) and GFP-Aurora B (green). Quantification of integrated pixel intensity measurements of TopoIIα pS29. Graph shows mean ± SEM of three experiments where ≥10 cells were scored per condition (two-tailed Students’ t test; ***P = 0.0008) Scale bar = 5 µm.
Fig. 5
Fig. 5. Phosphorylation is required for enhanced TopoIIα decatenation.
a DLD1 cells induced to express GFP-TopoIIa wild type or mutants were assessed for the metaphase catenation response. Cells were treated ±1 μM ICRF193 immediately prior to time-lapse imaging and scored for the time to progress from metaphase to anaphase. The mean ± SEM of three independent experiments is represented by the graph, ≥100 cells per condition were analysed. (one-way ANOVA; WT + ICRF193 55.6 ± 2.23 min S29A + ICRF193 44.18 ± 6.69 min, T1460A + ICRF193 46.11 ± 2.77 min, S29/T1460A + ICRF193 45.52 ± 1.71 min). b In vitro decatenation assay. Quantification of the amount of decatenated kDNA present after addition of TopoIIα and recombinant Aurora B (wild type or S227A). Graph represents the mean ± SD of five independent experiments. (two-tailed Students’ t test, *P = 0.012, **P = 0.0025; Control 0.024 ± 0.009, WT 0.208 ± 0.06, S227A 0.132 ± 0.05). c Representative immunofluorescence images of DLD1 cells after 1 h treatment with ICRF193 (1 μM) showing TopoIIα pS29 (magenta), a-tubulin (green) and DNA (blue). Images are representative of three independent experiments. Scale bar = 5 μm. d, e Catenation spread assay analysis. d DLD1 cells induced to express GFP-TopoIIα wild type or mutants were scored for the per cent joined (catenated) chromatids. The mean ± SEM of three experiments where ≥15 cells per experiment were analysed is represented by the graph. (two-tailed Students’ t test; *P = 0.047; siControl 43.38% ± 8.22, siTopoIIa 78.64% ± 6.61, WT 55.88% ± 4.58, S29A 69.24% ± 0.36, T1460A 72.07% ± 7.94, S29/T1460A 83.17% ± 12.49). e HEK293 cells induced to express GFP-TopoIIa wild type or mutants were scored for the per cent joined (catenated) chromatids. The mean ± SEM of three experiments where ≥15 cells per experiment were analysed is represented by the graph (two-tailed Students’ t test; ****P = ≤0.0001; siControl 25.66% ± 6.17, siTopoIIa 99.57% ± 0.26, WT 25.62% ± 3.63, S29A 90.68% ± 4.44, T1460A 83.21% ± 8.47, S29/T1460A 90.46% ± 4.25).
Fig. 6
Fig. 6. Working model of non-canonical PKCε signalling in response to excess metaphase catenation.
In mitosis, Aurora B switches substrate specificity in response to phosphorylation of S227 in the activation loop by a cell cycle-processed active fragment of PKCε. Here, we show that this switch protects from chromosome non-disjunction by delaying anaphase entry and promoting TopoIIα-dependent resolution.

References

    1. Özer Ö, Hickson ID. Pathways for maintenance of telomeres and common fragile sites during DNA replication stress. Open Biol. 2018;8:180018. doi: 10.1098/rsob.180018. - DOI - PMC - PubMed
    1. Brownlow N, Pike T, Zicha D, Collinson L, Parker PJ. Mitotic catenation is monitored and resolved by a PKCε-regulated pathway. Nat. Commun. 2014;5:5685. doi: 10.1038/ncomms6685. - DOI - PMC - PubMed
    1. Carmena M, Wheelock M, Funabiki H, Earnshaw WC. The chromosomal passenger complex (CPC): from easy rider to the godfather of mitosis. Nat. Publ. Group. 2012;13:789–803. - PMC - PubMed
    1. Pike T, Brownlow N, Kjaer S, Carlton J, Parker PJ. PKCɛ switches Aurora B specificity to exit the abscission checkpoint. Nat. Commun. 2016;7:13853. doi: 10.1038/ncomms13853. - DOI - PMC - PubMed
    1. Carlton JG, Caballe A, Agromayor M, Kloc M, Martin-Serrano J. ESCRT-III governs the Aurora B-mediated abscission checkpoint through CHMP4C. Science. 2012;336:220–225. doi: 10.1126/science.1217180. - DOI - PMC - PubMed

Publication types

MeSH terms