

Emergence of Visual Center-Periphery Spatial Organization in Deep Convolutional Neural Networks
- PMID: 32170209
- PMCID: PMC7070097
- DOI: 10.1038/s41598-020-61409-0
Emergence of Visual Center-Periphery Spatial Organization in Deep Convolutional Neural Networks
Abstract
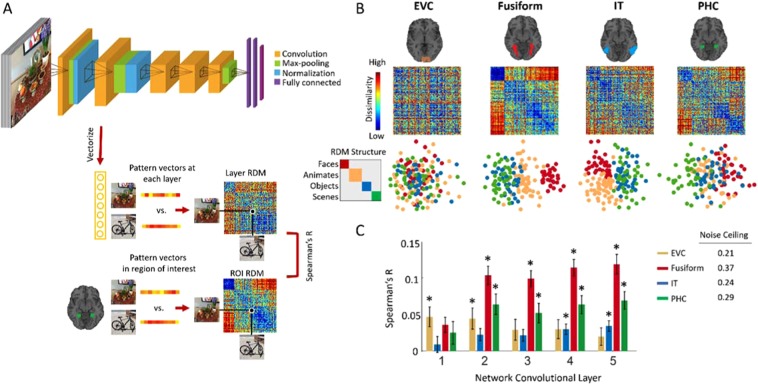
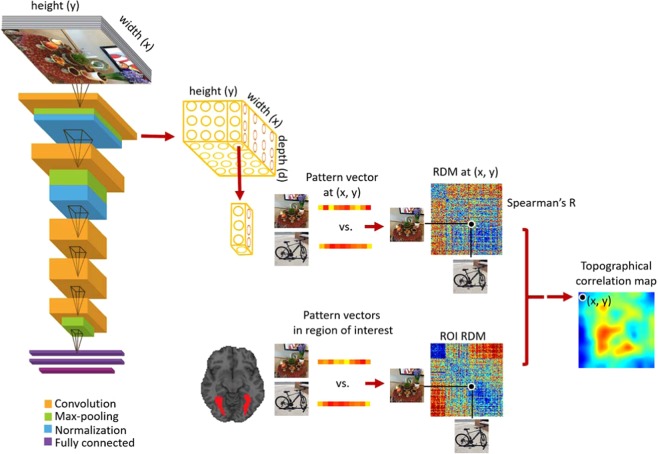
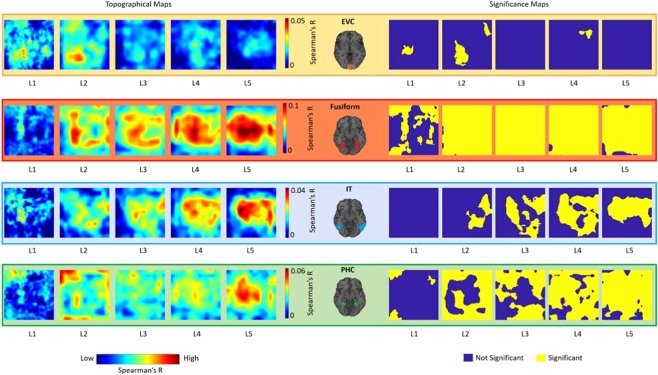
Research at the intersection of computer vision and neuroscience has revealed hierarchical correspondence between layers of deep convolutional neural networks (DCNNs) and cascade of regions along human ventral visual cortex. Recently, studies have uncovered emergence of human interpretable concepts within DCNNs layers trained to identify visual objects and scenes. Here, we asked whether an artificial neural network (with convolutional structure) trained for visual categorization would demonstrate spatial correspondences with human brain regions showing central/peripheral biases. Using representational similarity analysis, we compared activations of convolutional layers of a DCNN trained for object and scene categorization with neural representations in human brain visual regions. Results reveal a brain-like topographical organization in the layers of the DCNN, such that activations of layer-units with central-bias were associated with brain regions with foveal tendencies (e.g. fusiform gyrus), and activations of layer-units with selectivity for image backgrounds were associated with cortical regions showing peripheral preference (e.g. parahippocampal cortex). The emergence of a categorical topographical correspondence between DCNNs and brain regions suggests these models are a good approximation of the perceptual representation generated by biological neural networks.
Conflict of interest statement
The authors declare no competing interests.
Figures
Similar articles
-
Human Visual Pathways for Action Recognition versus Deep Convolutional Neural Networks: Representation Correspondence in Late but Not Early Layers.J Cogn Neurosci. 2024 Nov 1;36(11):2458-2480. doi: 10.1162/jocn_a_02233. J Cogn Neurosci. 2024. PMID: 39106158
-
Human Visual Cortex and Deep Convolutional Neural Network Care Deeply about Object Background.J Cogn Neurosci. 2024 Mar 1;36(3):551-566. doi: 10.1162/jocn_a_02098. J Cogn Neurosci. 2024. PMID: 38165735
-
The Ventral Visual Pathway Represents Animal Appearance over Animacy, Unlike Human Behavior and Deep Neural Networks.J Neurosci. 2019 Aug 14;39(33):6513-6525. doi: 10.1523/JNEUROSCI.1714-18.2019. Epub 2019 Jun 13. J Neurosci. 2019. PMID: 31196934 Free PMC article.
-
Visual Object Recognition: Do We (Finally) Know More Now Than We Did?Annu Rev Vis Sci. 2016 Oct 14;2:377-396. doi: 10.1146/annurev-vision-111815-114621. Epub 2016 Aug 3. Annu Rev Vis Sci. 2016. PMID: 28532357 Review.
-
Category selectivity in human visual cortex: Beyond visual object recognition.Neuropsychologia. 2017 Oct;105:177-183. doi: 10.1016/j.neuropsychologia.2017.03.033. Epub 2017 Apr 2. Neuropsychologia. 2017. PMID: 28377161 Review.
Cited by
-
Perceptual Expertise and Attention: An Exploration using Deep Neural Networks.bioRxiv [Preprint]. 2024 Oct 16:2024.10.15.617743. doi: 10.1101/2024.10.15.617743. bioRxiv. 2024. PMID: 39464001 Free PMC article. Preprint.
-
Acute Angiotensin II Receptor Blockade Facilitates Parahippocampal Processing During Memory Encoding in High-Trait-Anxious Individuals.Biol Psychiatry Glob Open Sci. 2023 Dec 25;4(2):100286. doi: 10.1016/j.bpsgos.2023.100286. eCollection 2024 Mar. Biol Psychiatry Glob Open Sci. 2023. PMID: 38323154 Free PMC article.
-
Will We Ever Have Conscious Machines?Front Comput Neurosci. 2020 Dec 22;14:556544. doi: 10.3389/fncom.2020.556544. eCollection 2020. Front Comput Neurosci. 2020. PMID: 33414712 Free PMC article.
-
Evaluating large language models in theory of mind tasks.Proc Natl Acad Sci U S A. 2024 Nov 5;121(45):e2405460121. doi: 10.1073/pnas.2405460121. Epub 2024 Oct 29. Proc Natl Acad Sci U S A. 2024. PMID: 39471222 Free PMC article.
-
Reconstructing feedback representations in the ventral visual pathway with a generative adversarial autoencoder.PLoS Comput Biol. 2021 Mar 24;17(3):e1008775. doi: 10.1371/journal.pcbi.1008775. eCollection 2021 Mar. PLoS Comput Biol. 2021. PMID: 33760819 Free PMC article.
References
Publication types
MeSH terms
LinkOut - more resources
Full Text Sources
