. 2020 May 7;48(8):4521-4537.
doi: 10.1093/nar/gkaa155.

A transient α-helix in the N-terminal RNA recognition motif of polypyrimidine tract binding protein senses RNA secondary structure

Affiliations

A transient α-helix in the N-terminal RNA recognition motif of polypyrimidine tract binding protein senses RNA secondary structure

Christophe Maris et al. Nucleic Acids Res. .

Abstract

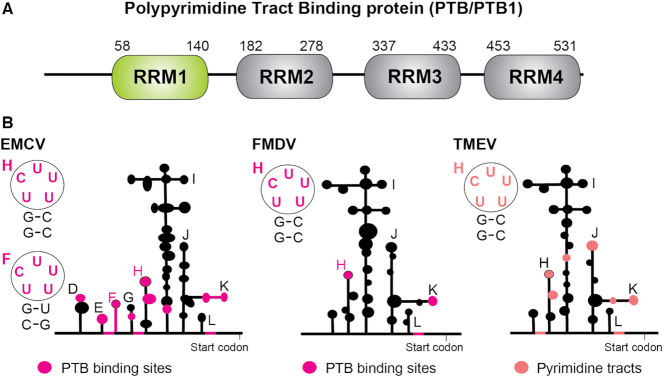
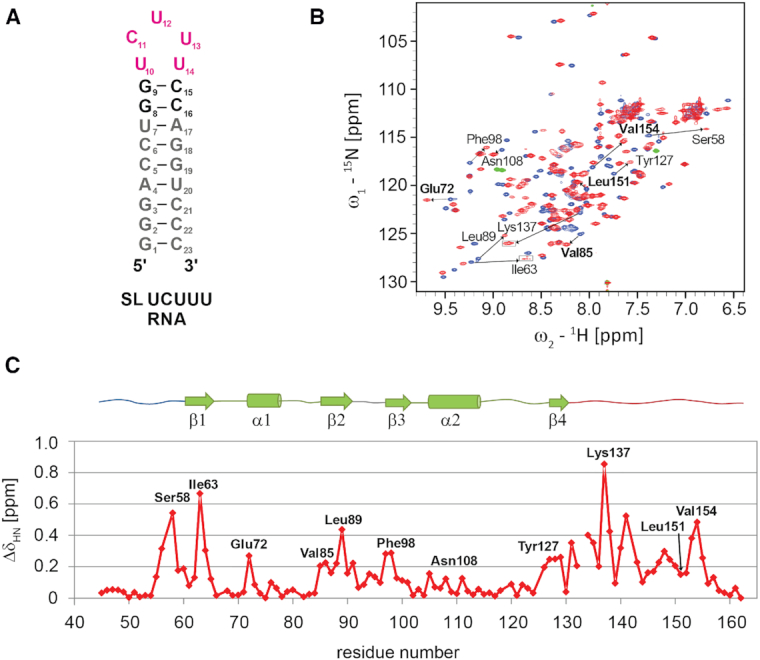
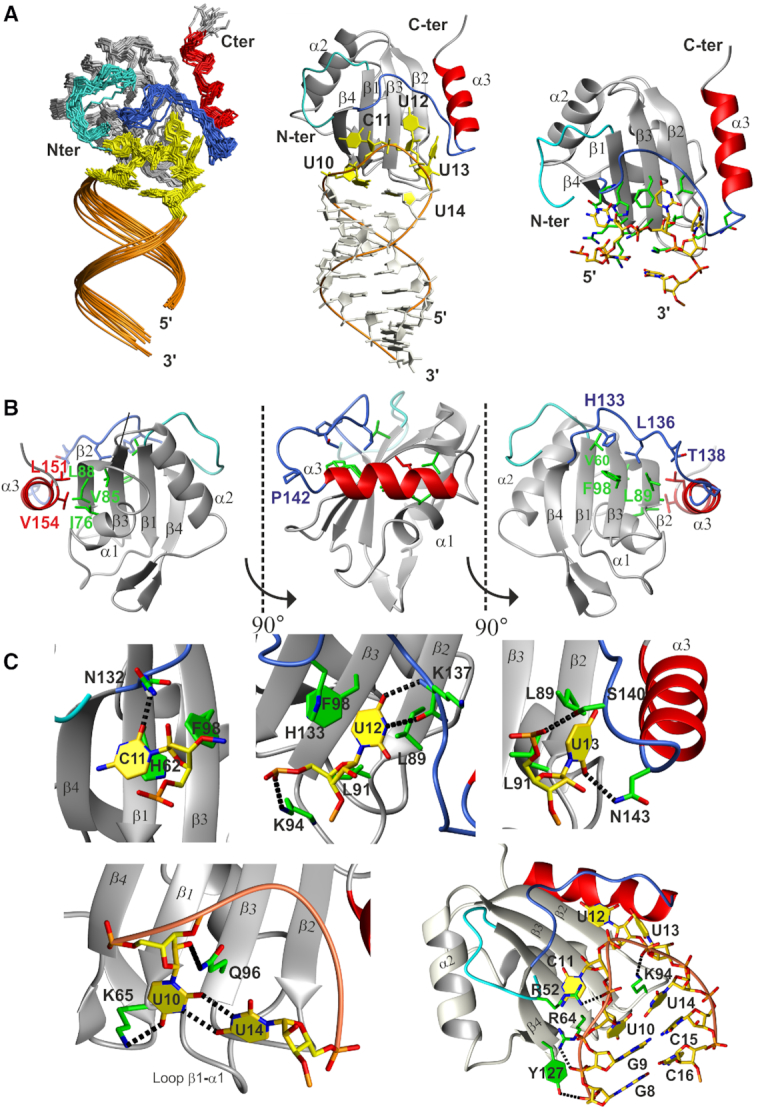
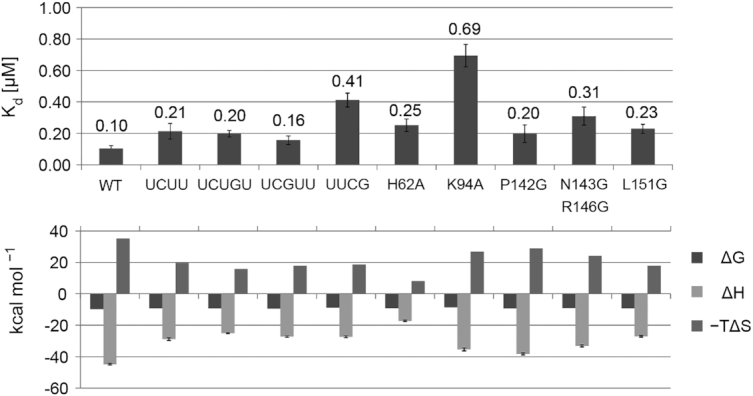
The polypyrimidine tract binding protein (PTB) is a multi-domain protein involved in alternative splicing, mRNA localization, stabilization, polyadenylation and translation initiation from internal ribosome entry sites (IRES). In this latter process, PTB promotes viral translation by interacting extensively with complex structured regions in the 5'-untranslated regions of viral RNAs at pyrimidine-rich targets located in single strand and hairpin regions. To better understand how PTB recognizes structured elements in RNA targets, we solved the solution structure of the N-terminal RNA recognition motif (RRM) in complex with an RNA hairpin embedding the loop sequence UCUUU, which is frequently found in IRESs of the picornovirus family. Surprisingly, a new three-turn α3 helix C-terminal to the RRM, folds upon binding the RNA hairpin. Although α3 does not mediate any contacts to the RNA, it acts as a sensor of RNA secondary structure, suggesting a role for RRM1 in detecting pyrimidine tracts in the context of structured RNA. Moreover, the degree of helix formation depends on the RNA loop sequence. Finally, we show that the α3 helix region, which is highly conserved in vertebrates, is crucial for PTB function in enhancing Encephalomyocarditis virus IRES activity.


Figures

Figure 1.
Figure 1.
(A) Domain structure of PTB with its four RRMs. (B) Schematic representation of the secondary structures of the picornavirus IRESs of type II: encephalomyocarditis virus (EMCV), foot and mouse disease virus (FMDV) and Theiler's murine encephalomyelitis virus (TMEV). The RNA binding sites of PTB identified in EMCV and FMDV, and the pyrimidine tracts in TMEV, are colored magenta and pink respectively. The secondary structures of several hairpin binding sites containing a UCUUU motif are highlighted.
Figure 2.
Figure 2.
(A) Secondary structure of SL UCUUU. (B) Superposition of 1H-15N HSQC of PTB RRM1 in SL UCUUU RNA free and bound states acquired at 40°C (blue and red respectively). Boxed regions have lower contour thresholds. Selected amide shift changes from residues at the RRM-α3 interface are indicated in bold. (C) Amide chemical shift perturbation mapping of PTB RRM1 upon binding SL UCUUU.
Figure 3.
Figure 3.
(A) Overview of the structure of PTB RRM1 in complex with SL UCUUU RNA. Left: Ensemble of the 20 structures superimposed on the backbone heavy atoms of the well-defined residues of the protein and RNA (residues 58-155 of the protein and 1–23 of the RNA). The N-terminal extension, extended β4-α3 loop, α3 helix and pentaloop nucleotides are highlighted in cyan, blue, red and yellow respectively. Middle: lowest energy structure of the RNA-protein complex. Right: RNA–protein interface, key protein sidechains in green. (B) Contacts between RRM domain and structured parts of the N- and C-termini. Side chains from the RRM domain, N-terminus, extended β4–α3 loop and α3 helix are represented in cyan, green, blue and red respectively. (C) Details of protein interactions with the loop nucleotides, mismatched U10–U14 base pair and RNA backbone. Hydrogen bonds are represented by black dashed lines.
Figure 4.
Figure 4.
Dissociation constants Kd1 and thermodynamic parameters (ΔH enthalpy, ΔS entropy and ΔG free energy) of the wild type and mutant complexes obtained with ITC.
Figure 5.
Figure 5.
(A) Combined amide chemical shift difference between the WT PTB RRM1 protein and the P142G (green) and L151G (blue) mutant proteins both in their RNA free state. (B) Smoothed secondary 13C chemical shift values (Δ13Cα–Δ13Cβ) of the WT PTB RRM1 in free state (purple), in complex with SL UCUUU (red) and for the free state of the L151G mutant (blue). The experiments were acquired at 40°C for the WT protein in the free and SL UCUUU bound states, and at 25°C for the L151G mutant.
Figure 6.
Figure 6.
(A) Val154 and Glu72, residues from α3 and α1 respectively, which are monitored in 1H–15N HSQC spectra, highlighted on WT PTB RRM1/SL UCUUU complex structure. (B, C) Superposition of 1H-15N HSQC spectra of WT PTB RRM1 in the free state with (B) spectra of WT PTB RRM1/SL UCUUU complex and mutants P142G and L151G in the free state, (C) spectra of SL UCUUU-bound states of WT PTB RRM1, P142G and L151G. (D) Correlation of the magnitude of the amide 1H shift change of Val154 upon binding SL UCUUU, for WT PTB RRM1, P142G, and L151G relative to the range spanned by PTB RRM1/UCUUU and L151G, versus the entropic contribution to binding free energy relative to L151G/SL UCUUU. (E) 1H–15N HSQC spectra of complexes of WT PTB RRM1/SL UCUUU, WT PTB RRM1/SL E RNA and complexes of WT PTB RRM1 with various RNA loop mutants of SL UCUUU. (F) The 1H amide chemical shift difference between WT PTB RRM1/SL UCUUU complex and L151G mutant for residues 72–86 (α1–β2 segment) plotted versus shift difference between WT PTB RRM1, or its complexes with SL RNA mutants, and L151G. A similar analysis was performed with 15N chemical shifts and is shown in Supplementary Figure S10. The color code is the same as that employed to represent different samples in the 1H–15N HSQC spectra in (E). Fitting parameters for the linear least squares fitting in (E) and Supplementary Figure S10 are given in Supplementary Table S2. The red line represents a slope of 1 and corresponds to the maximum effect of α3-RRM docking observed for the WT PTB RRM1/SL UCUUU complex.
Figure 7.
Figure 7.
(A) Schematic diagram of the reporter construct pRF, the emcv IRES-containing construct pRemcvF, and the same construct with a single mutated loop E+, F*, H* or two mutated loops F*H*. These constructs were transfected into HEK293T cells. (B) IRES activity of wild type emcv and emcv IRESs with mutations of SL F, H or both F and H. Bars represent the average of two replicates ± s.d. of the IRES activity calculated as a ratio between Firefly and Renilla luciferase normalized to IRES activity of pRemcvF. (C) IRES activity for wt emcv compared to emcv with mutated SL E. Bars represent average values of biological duplicates, each as technical triplicate. (D) Upper panel: EMSA was performed using radiolabeled wild type 5′-emcv and variable concentration of wild type or mutant his-tagged PTB1. Lower panel: EMSA with radiolabeled F*, H* or F*H* mutant 5′-emcv and variable concentration of wild type his-tagged PTB1. In all EMSAs concentration of PTB1 ranged from 0, 125, 250, 375, 500, 750, 1000, 1500, 2000 and 4000 nM and complex formation is marked with white arrows. (E) IRES activity of wild type and mutated PTB1. Top panel: pRemcvF was transfected into HEK293T cells together with only control siRNA, or with siRNA against PTB/nPTB and either empty plasmid (pc) or plasmid expressing wild type or mutant PTB1. IRES is normalized to the IRES activity measured for pRF. Bottom panel: Equivalent amount of lysates from transfected cells was analyzed by immunoblot probed with anti-PTB-NT or anti GAPDH (loading control). This showed knockdown of endogenous PTB1 using siPTB/nPTB and similar expression levels for ectopic wild type and mutant PTB1.
Figure 8.
Figure 8.
(A) Comparison of the structure of PTB RRM1 in the SL RNA bound state with PTB RRM2 and RRM3 in the unbound state. The additional C-terminal elements are highlighted; the α3 helix of RRM1 and the fifth β strand of RRM2 and RRM3 (accession code: 1SJR.pdb (RRM2) and 2EVZ.pdb (RRM3). (B) Structures of PTB RRM1 and Snup17 RRM superimposed on the RRM domain to highlight the relative position of their α3 helices, (left) and the position of the binding partners of Snu17p, (right) (accession code: 2MKC.pdb). (C) Schematic representation of PTB RRM1 bound to CU6-mer RNA and to SL UCUUU RNA.

References

    1. Dominguez D., Freese P., Alexis M.S., Su A., Hochman M., Palden T., Bazile C., Lambert N.J., Van Nostrand E.L., Pratt G.A. et al. .. Sequence, structure, and context preferences of human RNA binding proteins. Mol. Cell. 2018; 70:854–867. - PMC - PubMed
    1. Sawicka K., Bushell M., Spriggs K.A., Willis A.E.. Polypyrimidine-tract-binding protein: a multifunctional RNA-binding protein. Biochem. Soc. Trans. 2008; 36:641–647. - PubMed
    1. Kafasla P., Mickleburgh I., Llorian M., Coelho M., Gooding C., Cherny D., Joshi A., Kotik-Kogan O., Curry S., Eperon I.C. et al. .. Defining the roles and interactions of PTB. Biochem. Soc. Trans. 2012; 40:815–820. - PubMed
    1. Romanelli M.G., Diani E., Lievens P.M.. New insights into functional roles of the polypyrimidine tract-binding protein. Int. J. Mol. Sci. 2013; 14:22906–22932. - PMC - PubMed
    1. Garcia-Blanco M.A., Jamison S.F., Sharp P.A.. Identification and purification of a 62,000-Dalton protein that binds specifically to the polypyrimidine tract of introns. Genes Dev. 1989; 3:1874–1886. - PubMed

Publication types

MeSH terms

Substances